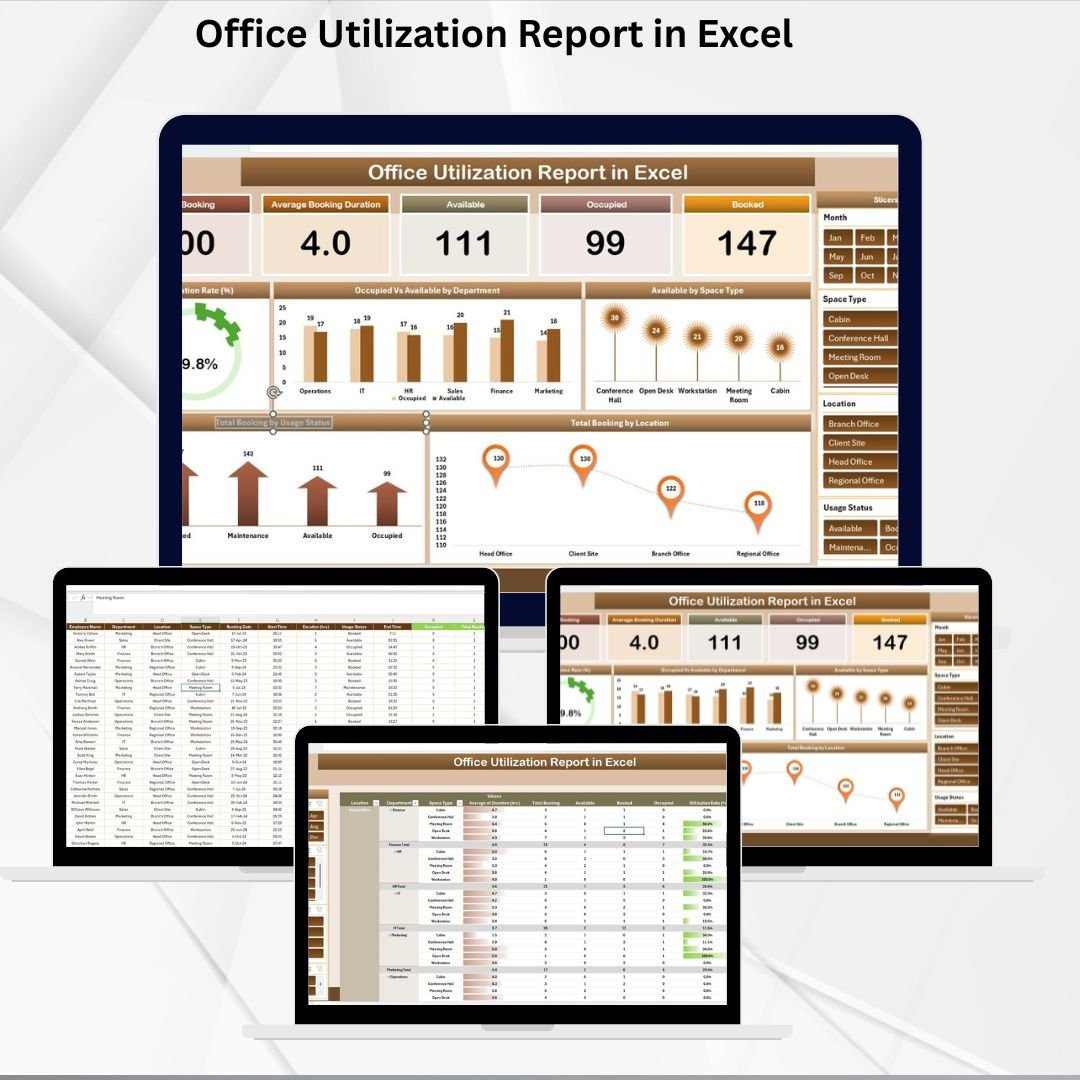
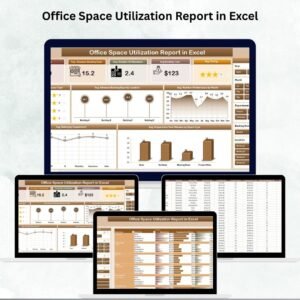
Office space is one of the most valuable yet underutilized resources in modern organizations. With hybrid and flexible work models becoming the new standard, facility managers and HR leaders must track space usage carefully to ensure efficiency and cost savings. That’s why we created the Office Utilization Report in Excel — a ready-to-use, visual, and data-driven tool to monitor occupancy, bookings, and utilization trends. 🏢📊
This Excel-based report simplifies how organizations measure office usage, identify underutilized areas, and make smarter decisions about layout, resource allocation, and long-term planning. With clear cards, interactive charts, and pivot-ready analysis, it provides everything you need to maximize your office efficiency.
🔑 Key Features of Office Utilization Report in Excel
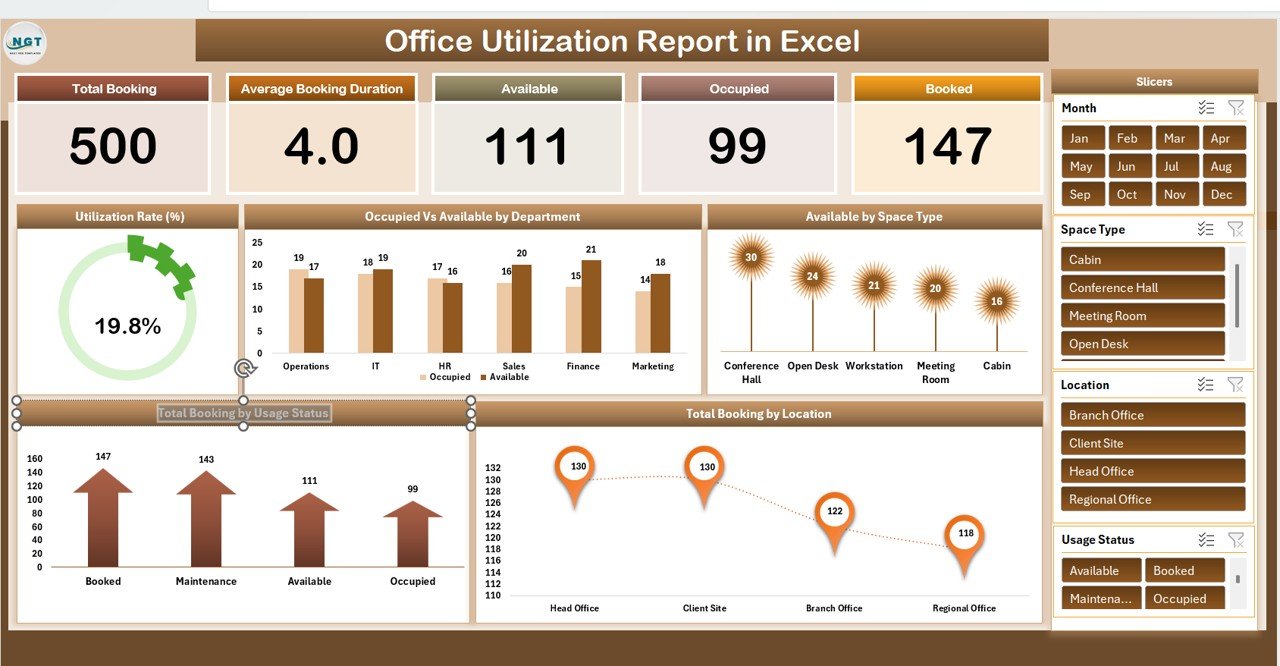
📋 Summary Sheet (High-Level Overview)
-
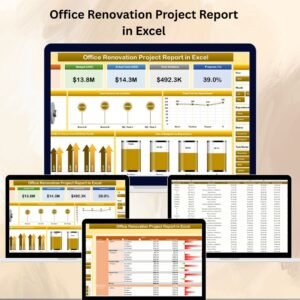
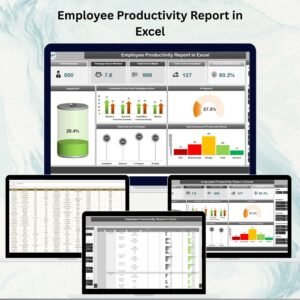
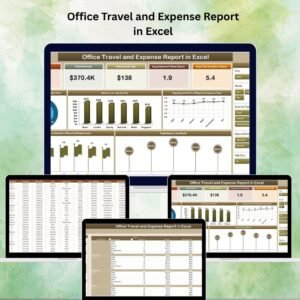
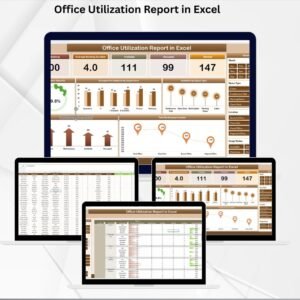
Cards showing Total Bookings, Average Booking Duration, Available, Occupied, Booked Spaces.
-
Charts to visualize:
-
Utilization Rate (%)
-
Occupied vs Available by Department
-
Available by Space Type (desks, meeting rooms, etc.)
-
Bookings by Location
-
Bookings by Usage Status (confirmed, pending, canceled).
-
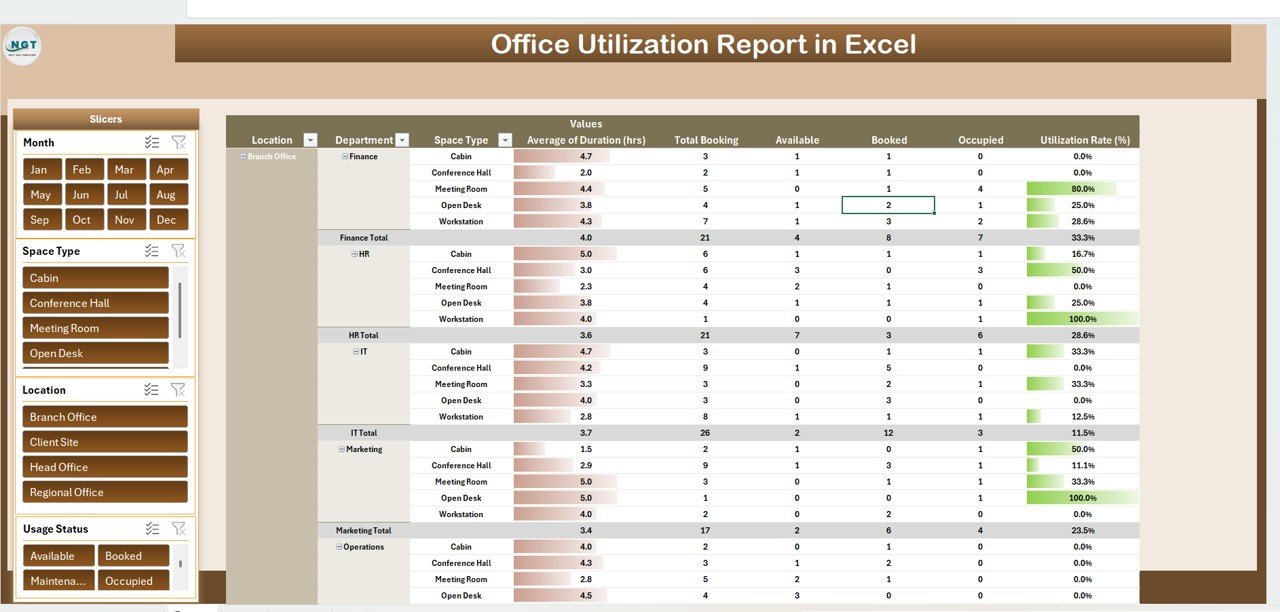
📊 Report Sheet (Detailed Analysis)
-
Power Pivot integration for in-depth insights.
-
Drill-down views by department, location, or space type.
-
Summarized tables for management-level reporting.
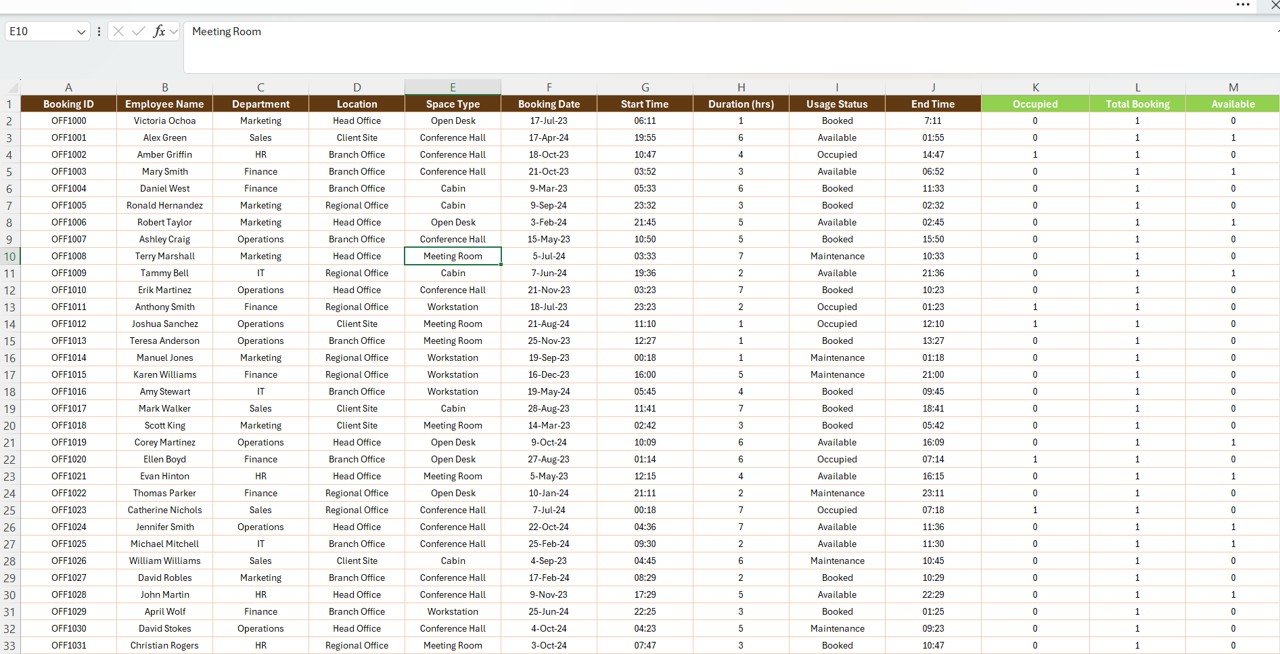
🧾 Data Sheet (Input Source)
-
Structured records with Date, Department, Space Type, Location, Duration, and Status.
-
Automatic reflection of updates in Summary & Report tabs.
-
Centralized and consistent tracking of office data.
📦 What’s Inside the Report?
✅ Summary Tab – Dashboard with KPIs and charts
✅ Report Tab – Pivot-ready, drill-down analysis
✅ Data Tab – Input sheet with structured booking records
✅ Pre-Built Calculations – Automated metrics and utilization rates
✅ Customizable Layout – Add new departments, space types, or booking categories
✅ Sample Data – Preloaded for easy understanding and instant use
🎯 Who Can Benefit from This Report?
🏢 Facility Managers – Track utilization across office spaces and optimize resources.
👩💼 HR Teams – Monitor hybrid schedules and ensure fair workspace allocation.
📊 Operations Leaders – Use occupancy trends to plan expansions or downsizing.
💼 Executives – Gain high-level visibility into office efficiency and cost savings.
🌍 Organizations of All Sizes – Adaptable for startups, SMEs, and enterprises.
🧠 How to Use the Office Utilization Report
-
Enter bookings and space data into the Data Sheet Tab.
-
Review cards and charts on the Summary Tab for high-level trends.
-
Drill into the Report Tab for pivot analysis by location, department, or space type.
-
Update data regularly for real-time accuracy.
-
Share insights with leadership teams for decision-making.
No coding or add-ins needed — just Excel and your office data. ✅
🚀 Advantages of Using This Report
-
Centralized Data – Keep all office bookings and occupancy details in one file.
-
Visual Insights – Cards and charts simplify complex space usage data.
-
Optimize Resources – Identify underutilized areas and reallocate effectively.
-
Support Hybrid Work – Plan for flexible and shared workspaces.
-
Time-Saving – Automated calculations eliminate manual reporting.
-
Scalable – Works for single offices or multiple locations.
🔗 Click here to read the Detailed blog post
Watch the step-by-step video Demo:


Reviews
There are no reviews yet.