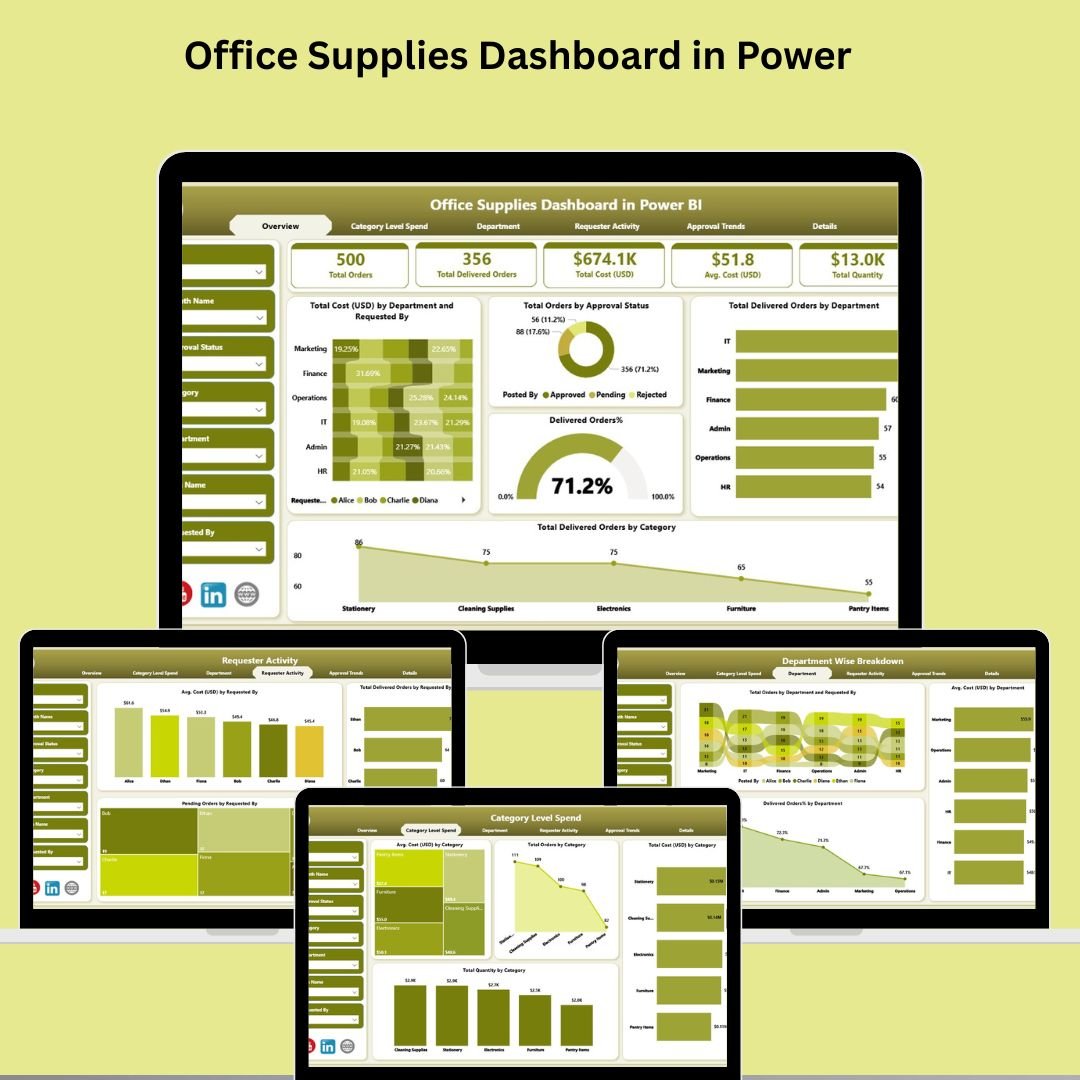
Tired of manually tracking orders, overspending, or juggling spreadsheets for your office supply chain? Say hello to the Office Supplies Dashboard in Power BI—your all-in-one analytics solution designed to transform how your organization manages and monitors its office supplies.
Built using Power BI and Excel, this dashboard empowers operations teams, procurement officers, and department heads with real-time data, rich visuals, and powerful insights—all at the click of a button. From order tracking to cost control, this tool ensures nothing slips through the cracks.
Let’s break down exactly how this dashboard helps you take charge of your supply chain 👇
✨ Key Features of Office Supplies Dashboard in Power BI
🧩 Overview Page – Real-Time Insights at a Glance
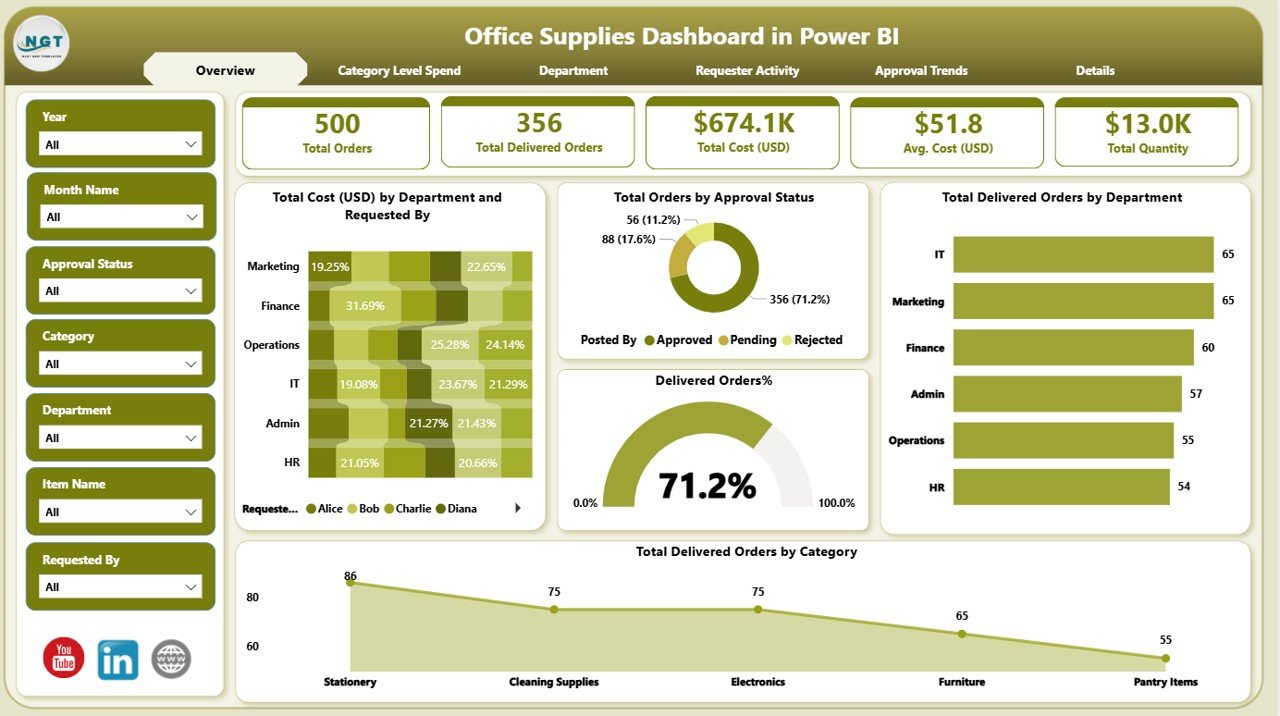
Your executive summary of everything that matters:
-
🎯 6 Smart Slicers – Filter by department, requester, approval status & more
-
💳 5 KPI Cards – Total Cost by Department, Total Orders by Status, Delivered Orders
-
📊 Charts for Quick Insight:
-
% Delivered Orders
-
Total Cost (USD) by Department
-
Total Delivered Orders by Category
-
Perfect for decision-makers who need quick, actionable overviews.
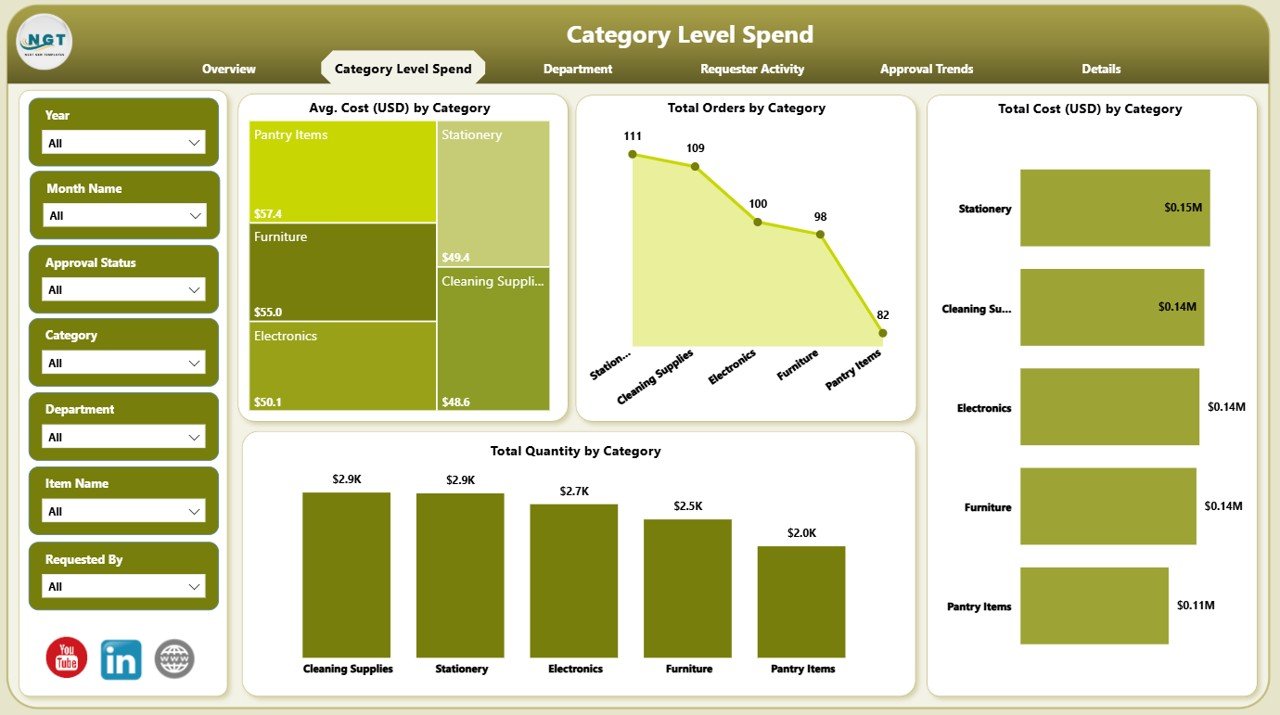
💸 Category Level Spend Page – Deep Cost Analysis
Drill into where your budget is really going:
-
6 slicers for granular filtering
-
📈 4 key visuals including:
-
Avg. Cost by Category
-
Total Orders
-
Total Cost
-
Quantity Ordered
-
This view helps you identify expensive categories and optimize purchasing.
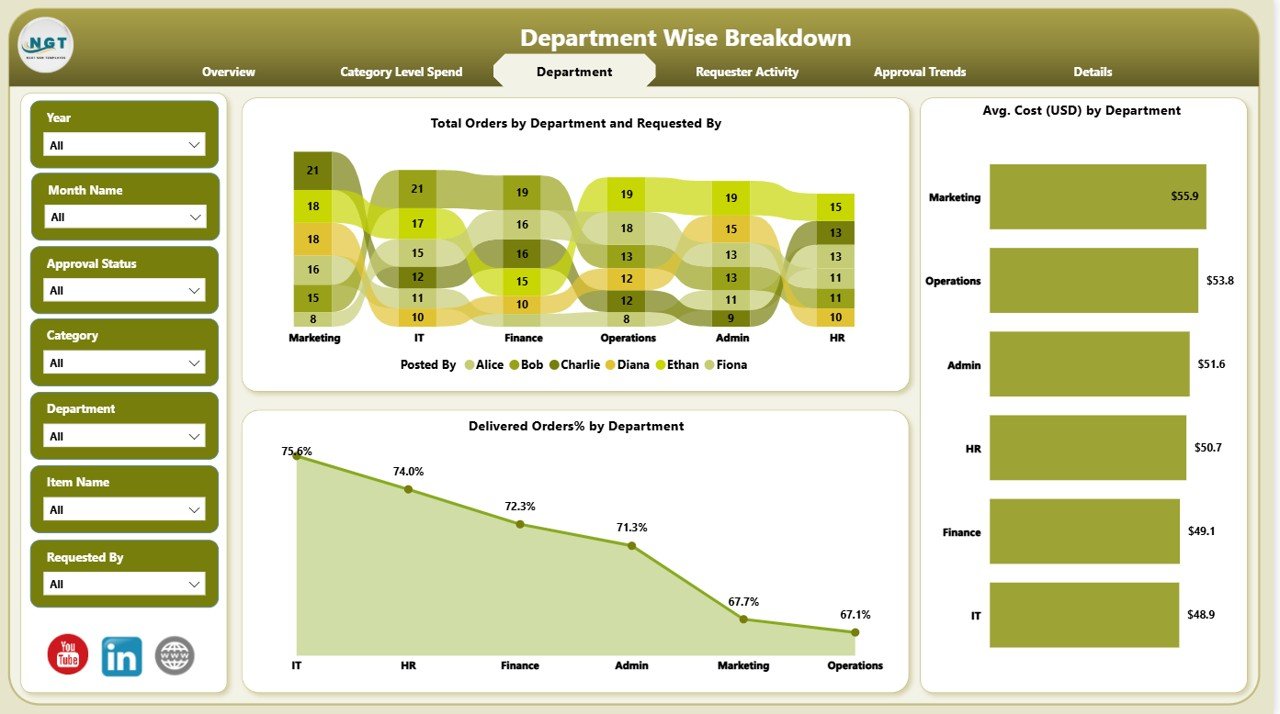
🏢 Department Page – Monitor Departmental Efficiency
Understand how each department is managing their orders:
-
📊 Charts show:
-
Total Orders by Department
-
% Delivered Orders
-
Avg. Cost by Department
-
Use this page to hold departments accountable and optimize internal supply distribution.
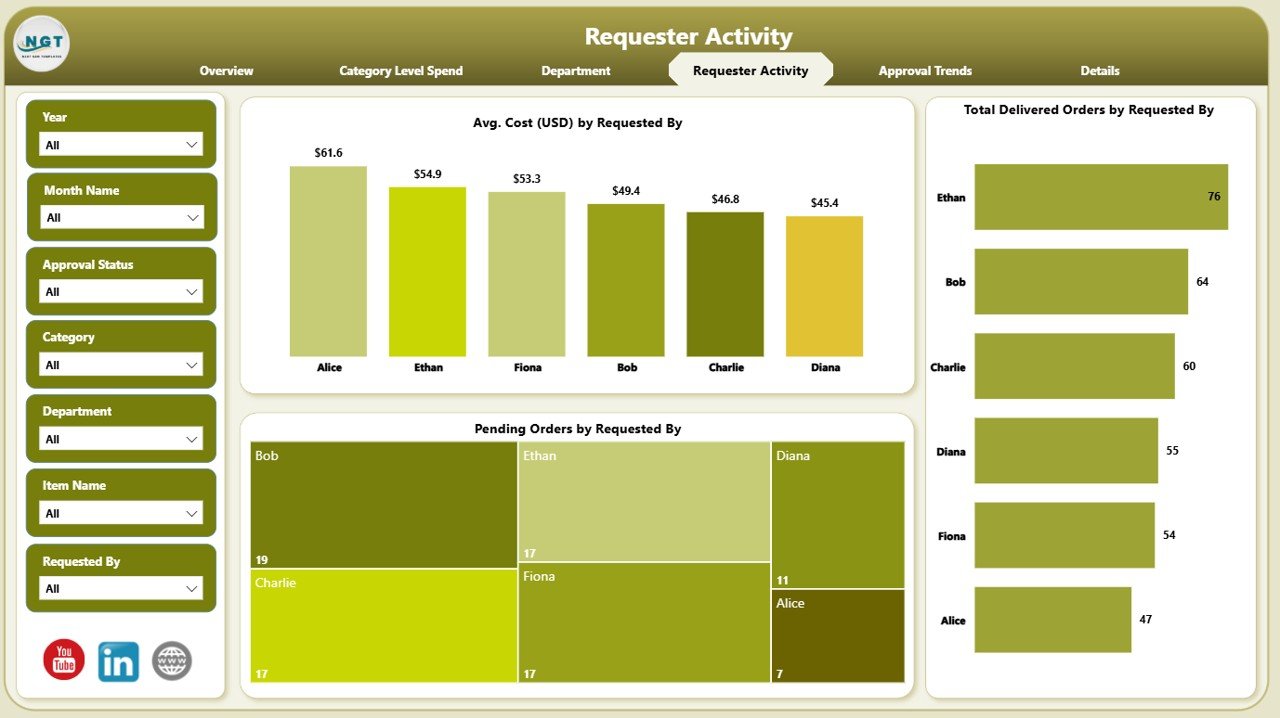
👥 Requester Activity Page – Who’s Ordering What?
Track individual usage and streamline procurement:
-
Visuals include:
-
Avg. Cost per Requester
-
Delivered Orders per Requester
-
Pending Orders per Requester
-
Great for spotting inefficiencies, duplicate orders, or high-usage staff.
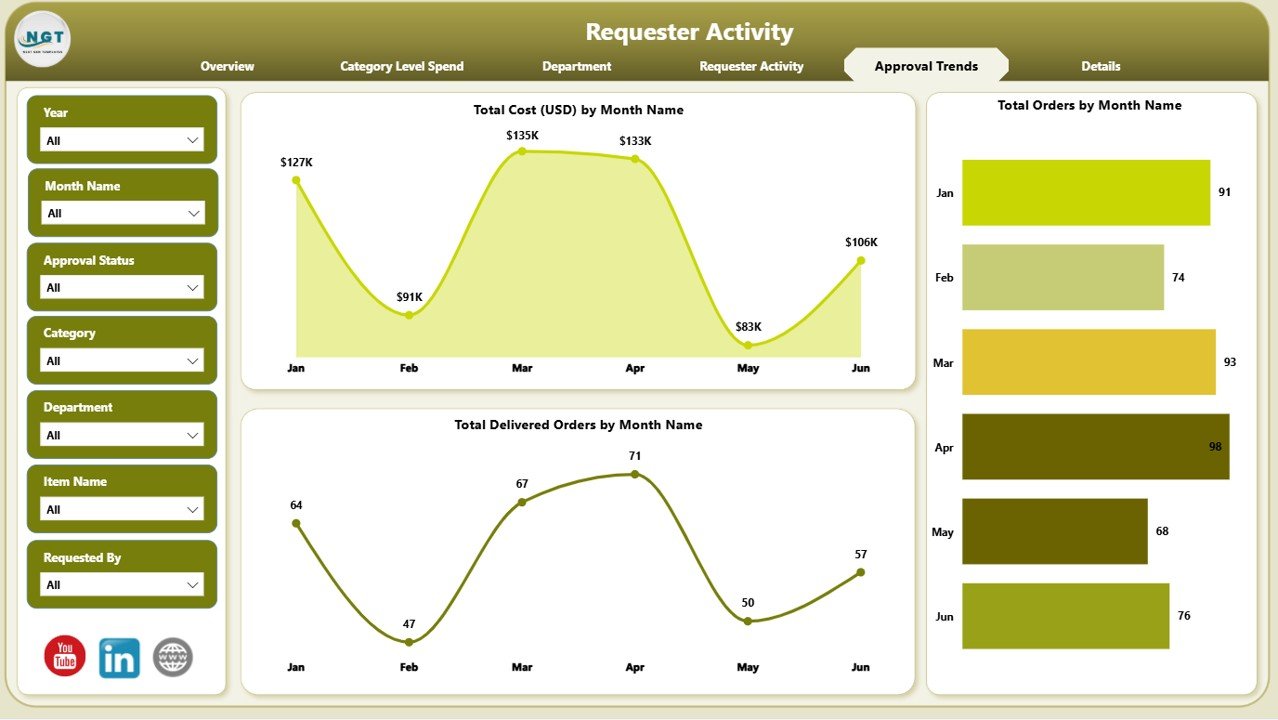
📝 Approval Trends Page – Optimize Your Workflow
Improve your internal approval process:
-
Charts to track:
-
Cost by Month
-
Orders by Month
-
Delivered Orders by Month
-
This is ideal for identifying approval bottlenecks and streamlining turnaround times.
📂 What’s Inside the Dashboard?
You’ll get a fully interactive Power BI file connected to a structured Excel dataset, including:
✅ Overview Page
✅ Category Level Spend Page
✅ Department Page
✅ Requester Activity Page
✅ Approval Trends Page
All visuals are powered by structured data models and DAX calculations—designed to be flexible and easily updatable.
🛠️ How to Use the Office Supplies Dashboard
-
✅ Update your Excel file with the latest order and delivery data
-
📥 Open the Power BI dashboard and hit “Refresh”
-
🎛️ Use slicers to filter by categories, departments, dates, or requesters
-
📊 Analyze visual trends to spot overspending or approval delays
-
🔧 Customize charts to suit your workflow or reporting format
-
🧠 Make data-driven decisions—from procurement to delivery tracking
👥 Who Can Benefit from This Dashboard?
📦 Procurement Teams – Track and control supply costs
🏢 Department Heads – Monitor their team’s ordering behavior
🧾 Finance Teams – Evaluate spend patterns and optimize budgets
🛠️ Operations Managers – Streamline workflows and approvals
💼 SMEs & Enterprises – Scalable for businesses of all sizes
🔗 Click here to read the Detailed blog post
📺 Visit our YouTube channel to learn step-by-step video tutorials


Reviews
There are no reviews yet.