The Network Performance KPI Dashboard in Excel is an essential tool for network administrators, IT professionals, and business owners to monitor, analyze, and optimize their network infrastructure. This Excel-based dashboard provides real-time insights into critical network metrics, such as bandwidth usage, uptime, packet loss, and response times, helping you ensure your network is operating at its peak performance.
With a focus on visualizing network health and performance, the dashboard offers powerful tools for tracking network performance trends, identifying issues, and making data-driven decisions that can improve network reliability and efficiency. Whether you’re monitoring a small local network or managing a complex corporate infrastructure, this tool will help you streamline network operations and ensure optimal service delivery.
Key Features of the Network Performance KPI Dashboard in Excel
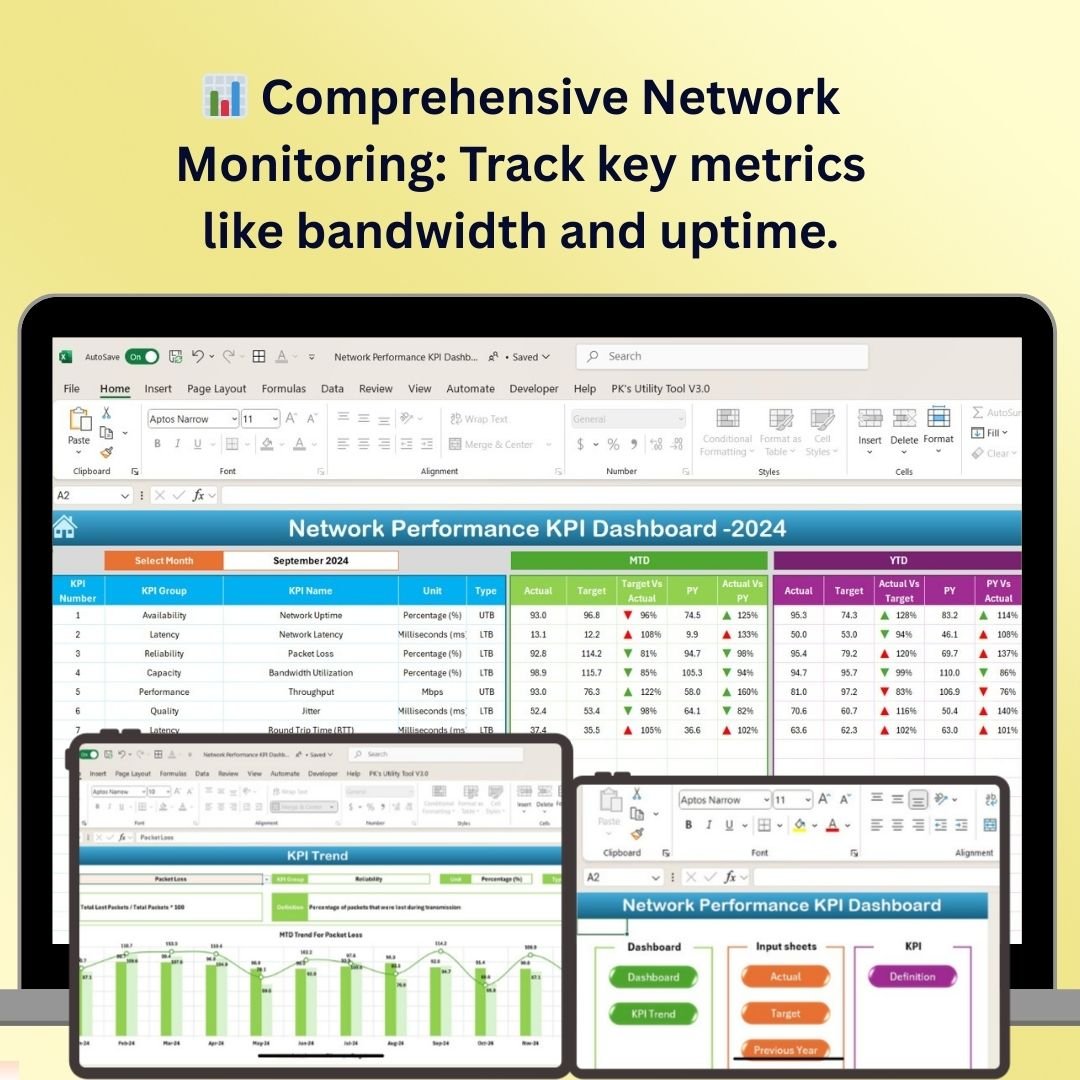
📊 Comprehensive Network Monitoring
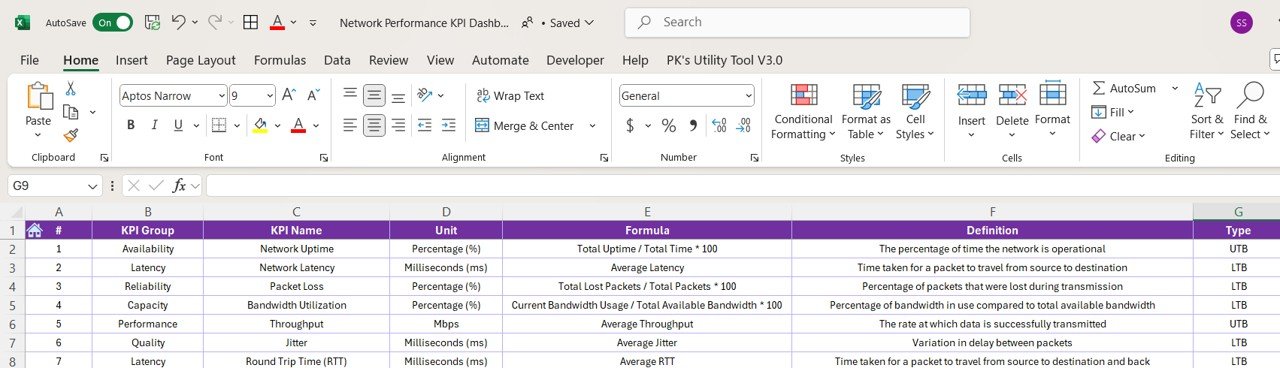
Track critical network performance metrics such as uptime, response time, bandwidth usage, packet loss, and network traffic volume. Monitor all aspects of your network to ensure smooth and continuous service delivery.
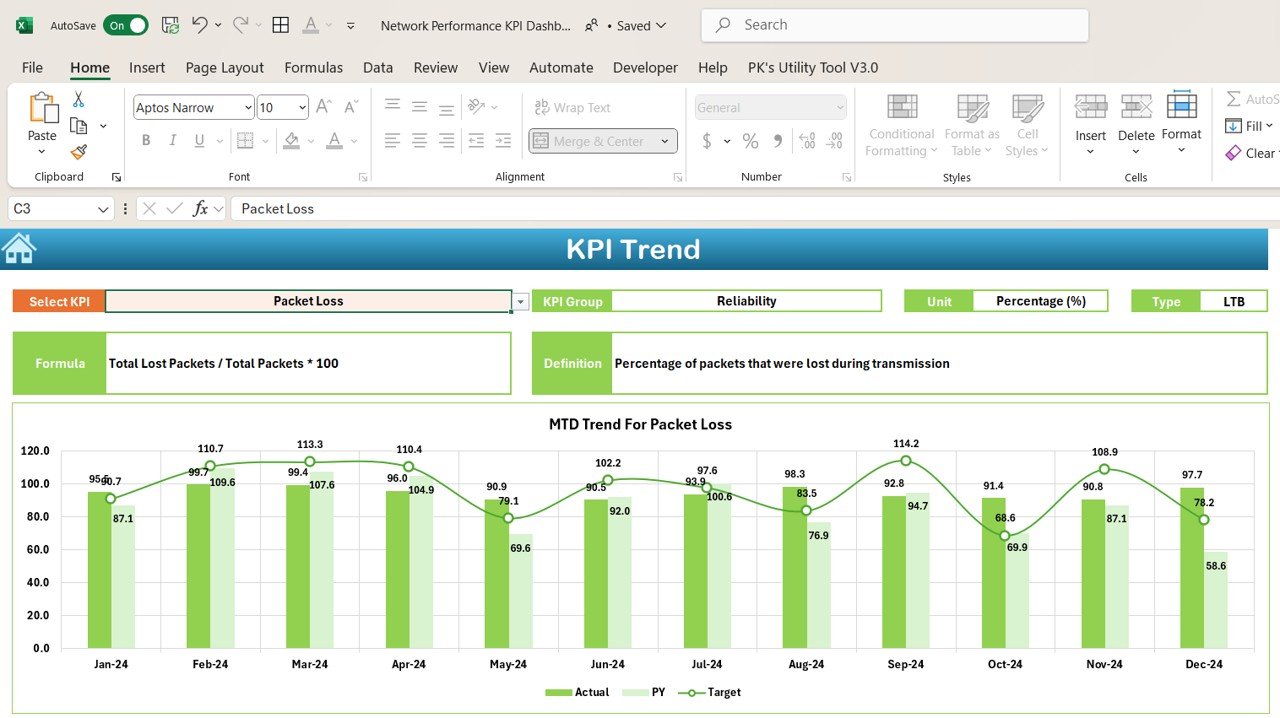
📈 Performance Trend Analysis
Analyze network performance trends over various time periods (daily, weekly, monthly). Identify any fluctuations in performance and potential bottlenecks that may affect network efficiency.
⚙️ Bandwidth Usage Monitoring
Keep track of bandwidth usage by monitoring data transfer rates. Detect any unusual spikes in network traffic and optimize bandwidth allocation for improved service delivery.
🔑 Real-Time Alerts & Notifications
Set up alerts and notifications for performance anomalies, such as packet loss or high latency. Stay informed of any issues that may need immediate attention to prevent network downtimes.
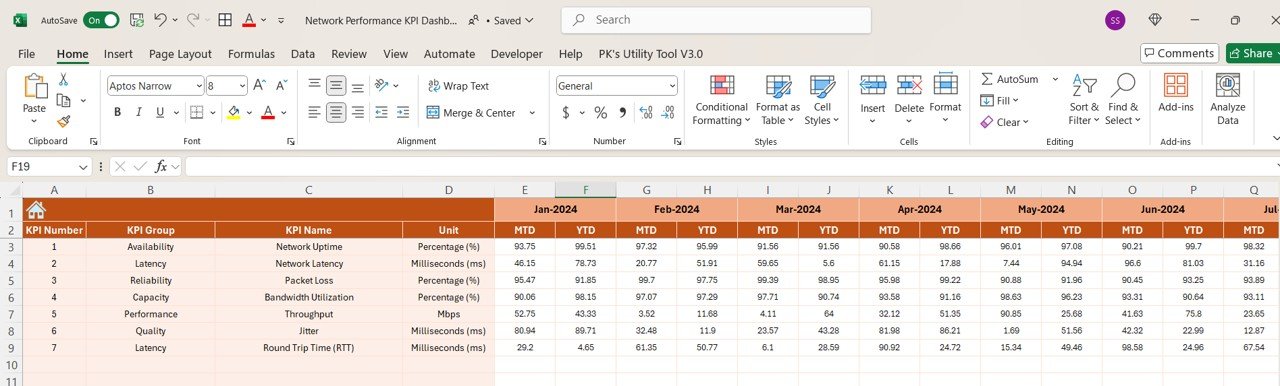
📅 Time-Based KPI Performance Analysis
Monitor network performance over different time periods. Track improvements, issues, and trends to make proactive adjustments and ensure long-term network reliability.
📈 Customizable Metrics & Dashboards
Customize the dashboard to focus on the KPIs that matter most to your network setup. Tailor the tracking metrics, data sources, and dashboard design to suit your network infrastructure and business requirements.
Why You’ll Love the Network Performance KPI Dashboard in Excel
✅ Comprehensive Insights in One Place
Access all the key metrics you need to track your network’s performance, from bandwidth usage to packet loss, in one convenient dashboard.
✅ Optimize Network Efficiency
Monitor your network’s health over time, identify performance issues, and make data-driven decisions to optimize network operations.
✅ Real-Time Monitoring & Alerts
Receive real-time notifications about network issues such as latency or bandwidth overload. Address potential problems before they impact the network’s performance.
✅ Improve Network Reliability
Use performance data to identify trends, troubleshoot network issues, and optimize the infrastructure to ensure reliable service.
✅ Customizable & Scalable
Adapt the dashboard to fit your network’s needs, whether you’re managing a small business network or a large-scale corporate system.
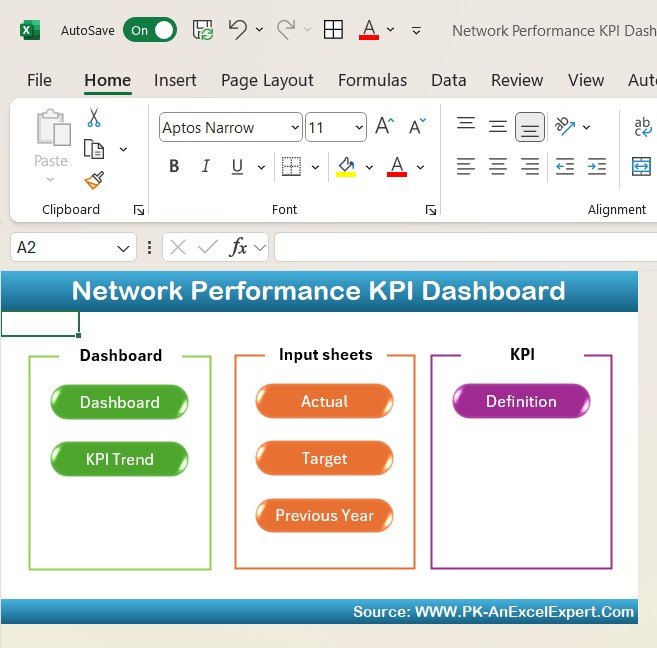
What’s Inside the Network Performance KPI Dashboard in Excel?
-
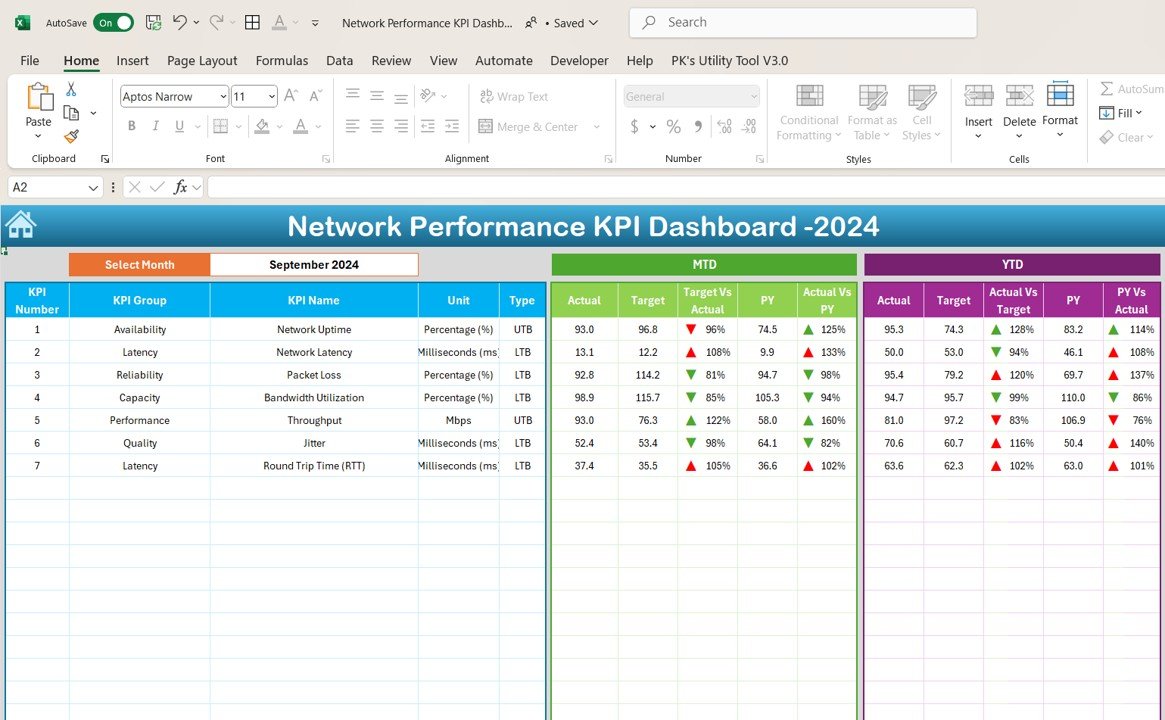
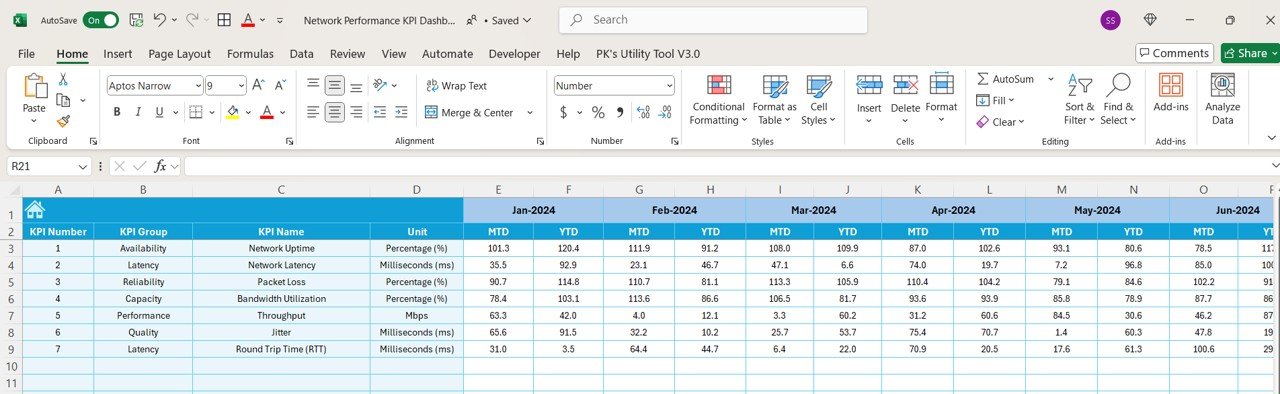
Comprehensive Network Monitoring: Track key network metrics such as uptime, latency, and packet loss.
-
Bandwidth Usage Monitoring: Track bandwidth usage and identify bandwidth allocation issues.
-
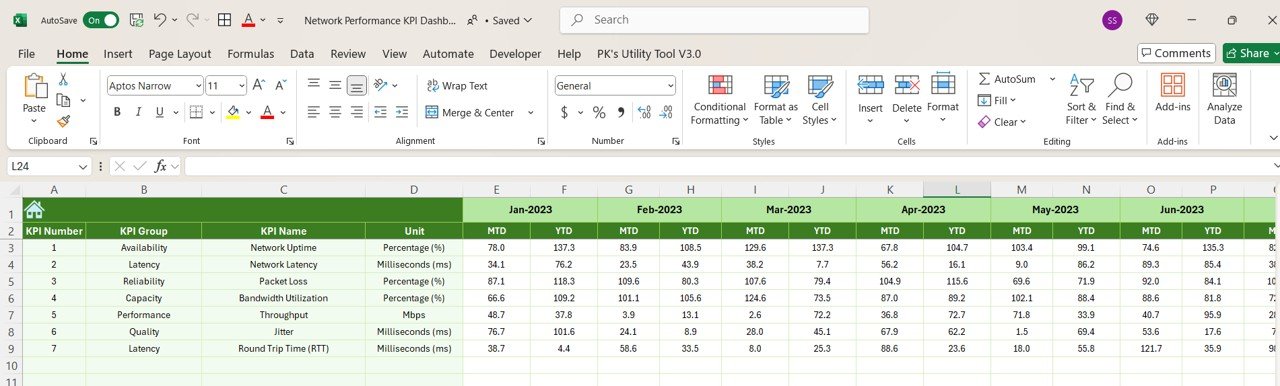
Performance Trend Analysis: Analyze historical data to identify trends and issues.
-
Real-Time Alerts & Notifications: Set up alerts for anomalies in network performance.
-
Time-Based Analysis: Monitor performance over different time periods for proactive management.
-
Customizable Metrics & Dashboards: Tailor the dashboard to suit your network’s needs.
How to Use the Network Performance KPI Dashboard in Excel
1️⃣ Download the Template: Access the Network Performance KPI Dashboard in Excel instantly.
2️⃣ Input Network Data: Enter your network’s performance data, such as bandwidth usage, latency, and uptime.
3️⃣ Monitor Key Metrics: Track network performance metrics such as packet loss and response time.
4️⃣ Set Alerts & Notifications: Configure alerts to notify you of performance anomalies.
5️⃣ Analyze Trends & Data: Use the time-based analysis tools to review network performance over time and optimize infrastructure.
Who Can Benefit from the Network Performance KPI Dashboard in Excel?
🔹 Network Administrators & IT Professionals
🔹 Business Owners & Managers
🔹 Data Center Operators
🔹 IT Infrastructure Teams
🔹 Internet Service Providers (ISPs)
🔹 Telecom & Networking Companies
🔹 Large Enterprises with Complex Networks
Ensure your network operates at peak performance with the Network Performance KPI Dashboard in Excel. Track key metrics, identify issues, and make data-driven decisions to enhance network reliability and efficiency.
Click here to read the Detailed blog post
Visit our YouTube channel to learn step-by-step video tutorials
Youtube.com/@PKAnExcelExpert


Reviews
There are no reviews yet.