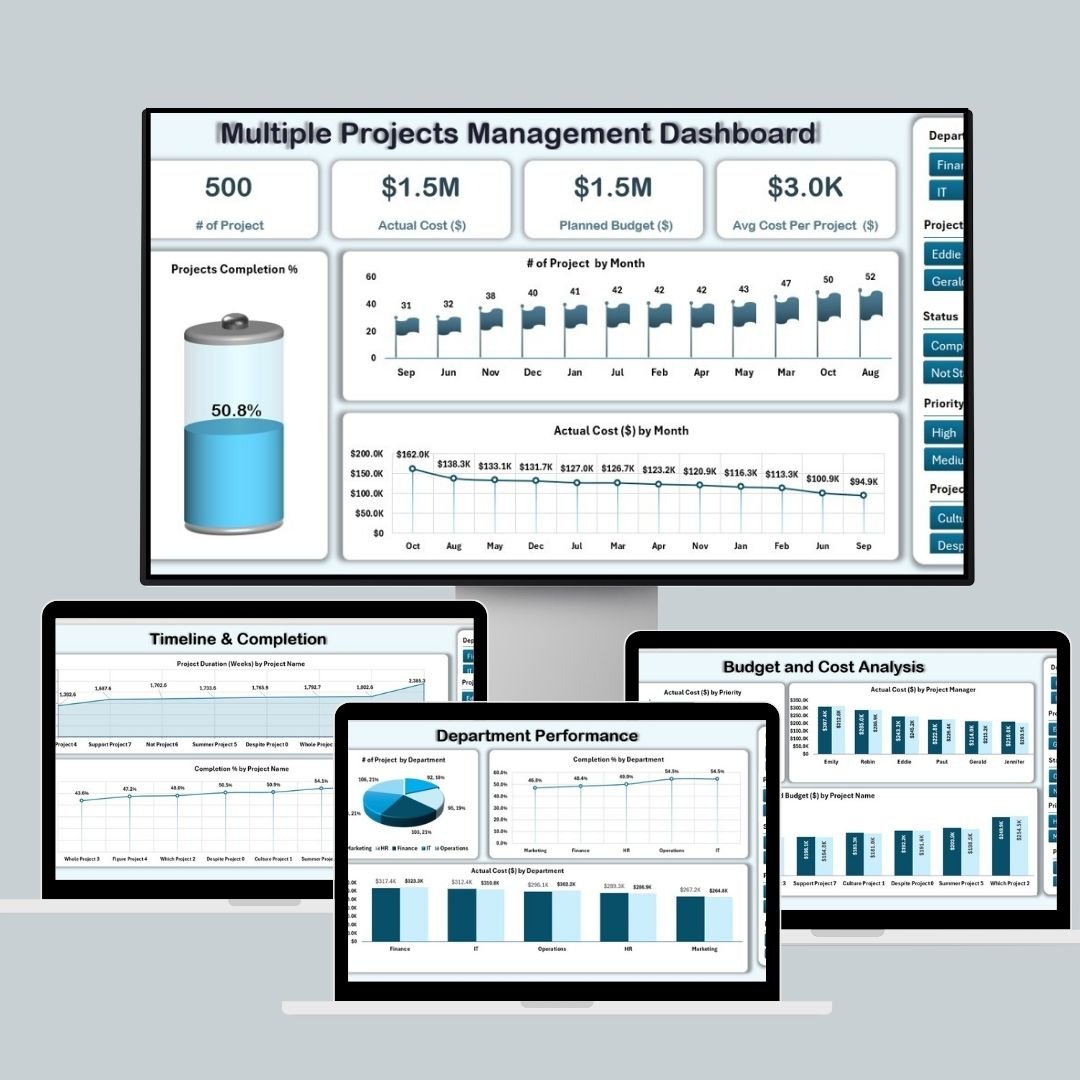
Managing multiple projects simultaneously can be a daunting task, especially when balancing various deadlines, budgets, and teams. The Multiple Projects Management Dashboard in Excel is designed to streamline this process, allowing you to monitor and manage all your projects in one place. Here are the powerful features that make this dashboard essential for any project manager:
-
Centralized Project Monitoring: Track all active projects in one place, eliminating the need to toggle between various documents or platforms.
-
Visual Data Representation: Multiple charts, including battery charts, line charts, and column charts, help visualize project progress, budget health, and key performance indicators (KPIs).
-
Real-Time Updates: As new data is entered in the data sheet, all the related metrics and visualizations update automatically, providing real-time insights.
-
Customizable: Tailor the dashboard to your specific project management needs by modifying the metrics, visualizations, and fields according to your requirements.
-
Slicers for Easy Filtering: Use slicers to filter the data by various categories like project manager, department, or completion percentage to get targeted insights.
What’s Inside the Multiple Projects Management Dashboard 📈
The Multiple Projects Management Dashboard in Excel is organized into six key sheets:
-
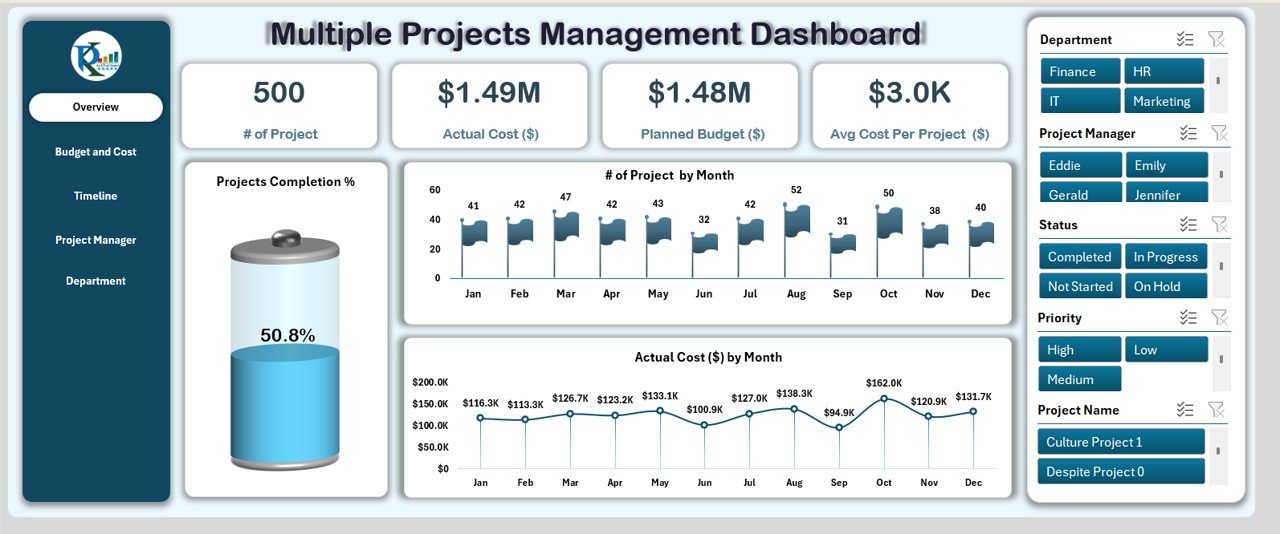
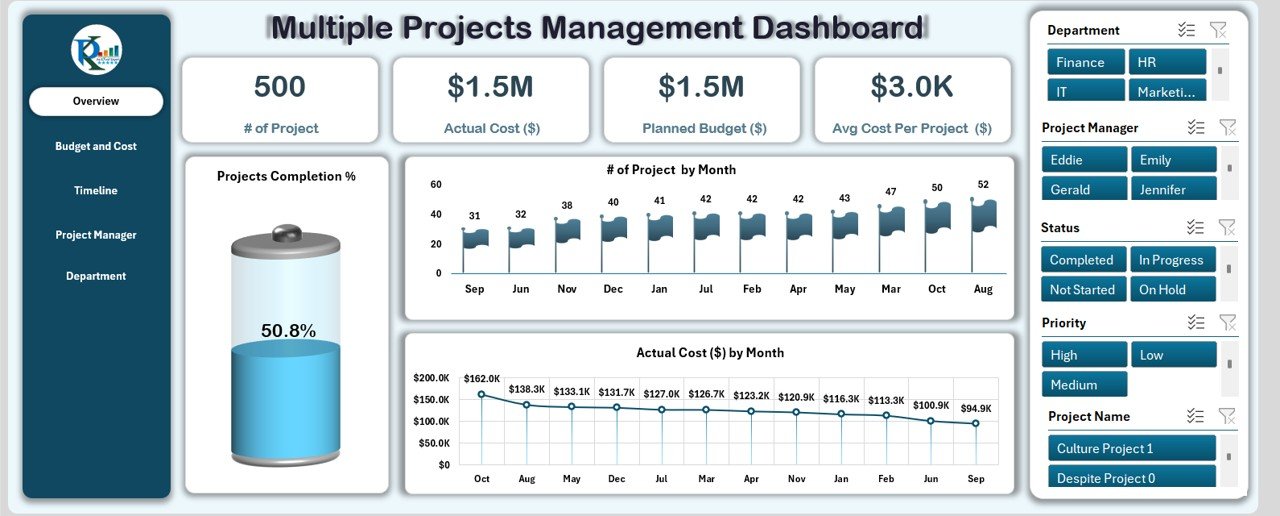
Overview Sheet Tab: This provides a snapshot of your entire project portfolio, including:
-
Key Metrics: # of Projects, Actual Cost ($), Planned Budget ($), Average Cost per Project ($).
-
Charts: Visualizations such as the Projects Completion % (Battery Chart) and # of Projects by Month (Flag Chart).
-
-
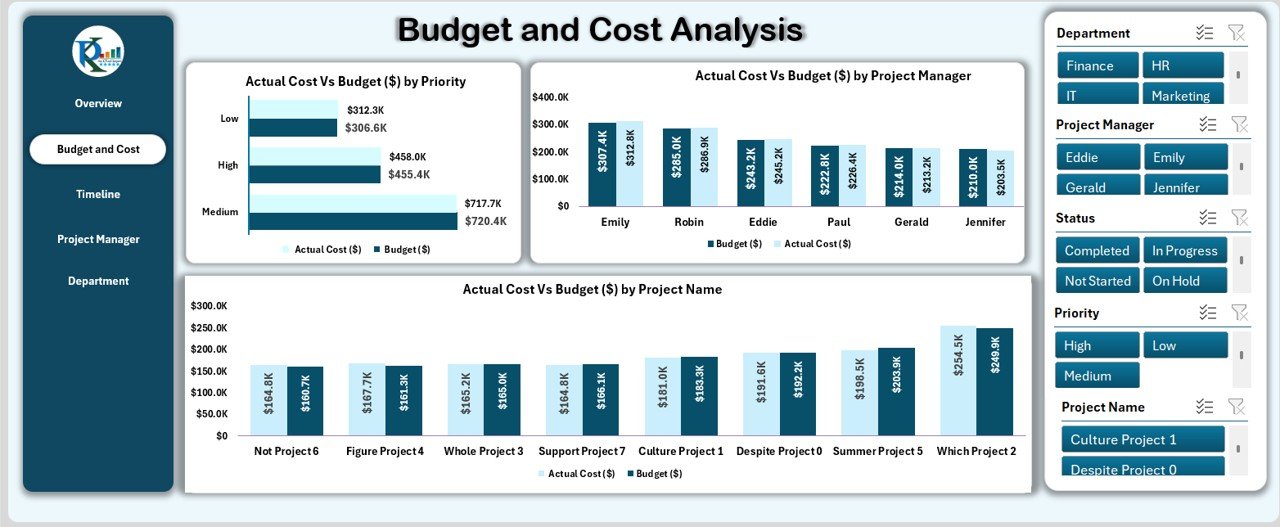
Budget and Cost Analysis Sheet Tab: A deeper dive into the financials of your projects, including:
-
Charts: Actual cost analysis by priority and project manager, planned budget by project name.
-
-
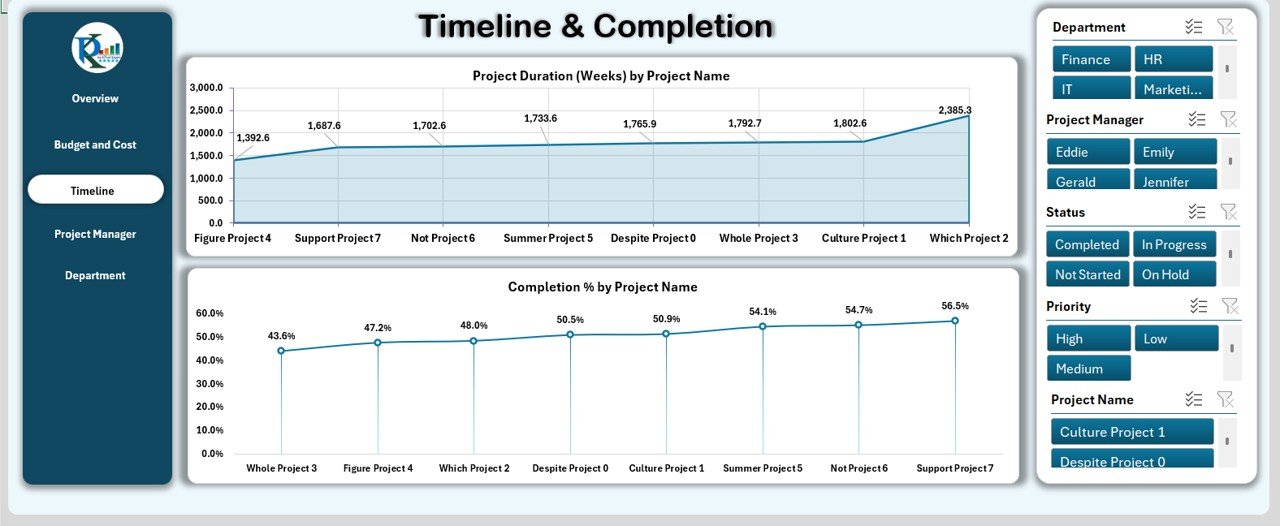
Timeline & Completion Sheet Tab: Tracks the progress and duration of each project.
-
Charts: Project duration (weeks) by project name and completion percentage by project name.
-
-
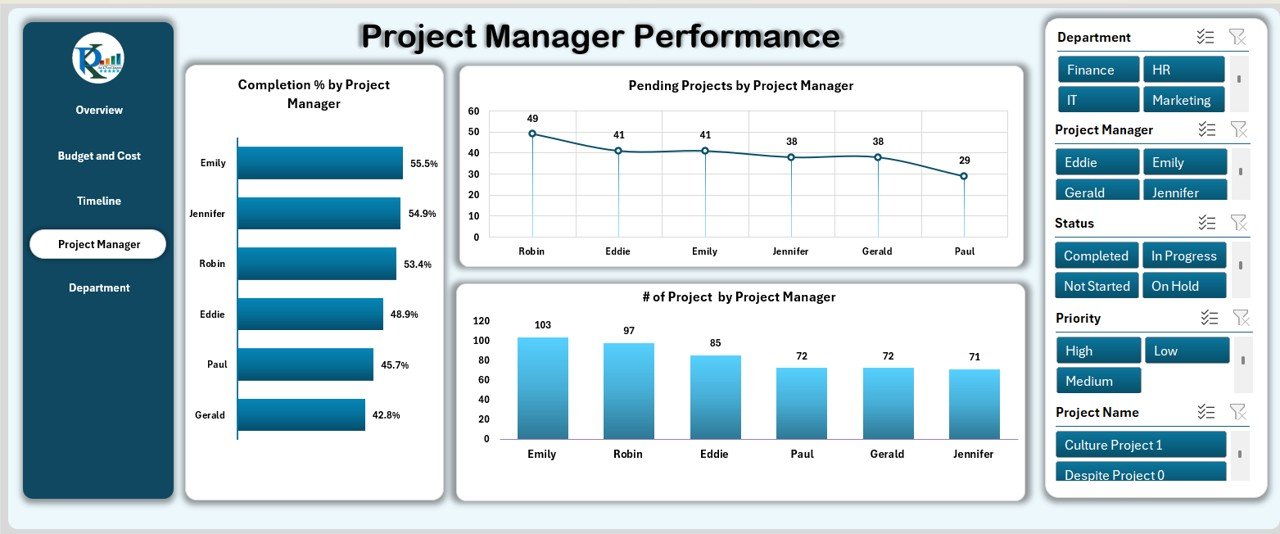
Project Manager Performance Sheet Tab: Allows you to evaluate the performance of each project manager.
-
Charts: Completion % by Project Manager, Pending Projects by Project Manager, and # of Projects by Project Manager.
-
-
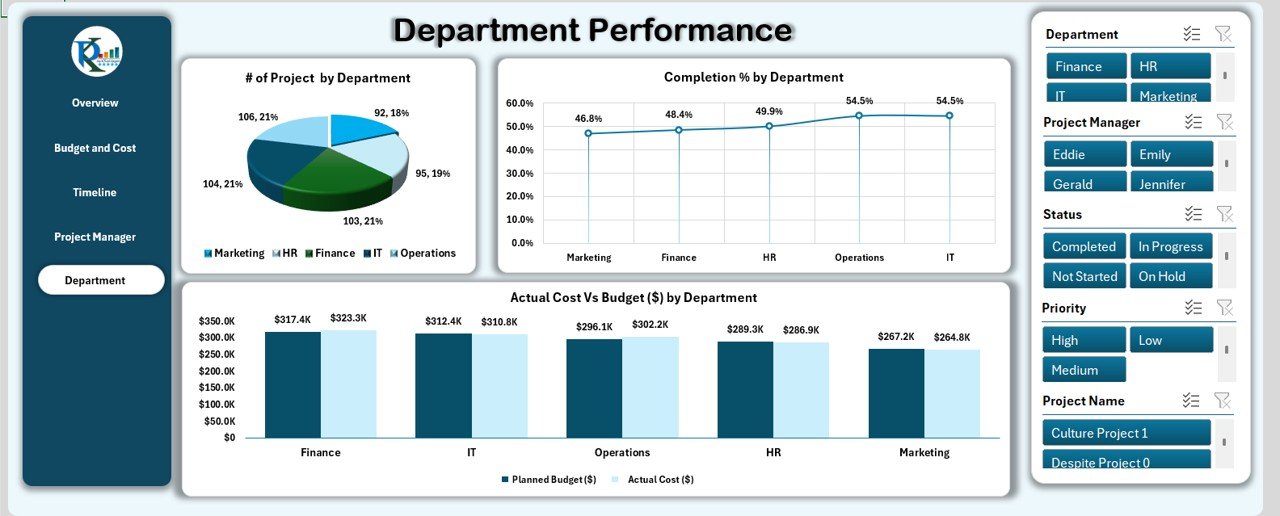
Department Performance Sheet Tab: Evaluates how well different departments are managing their projects.
-
Charts: # of Projects by Department, Completion % by Department, Actual Cost by Department.
-
-
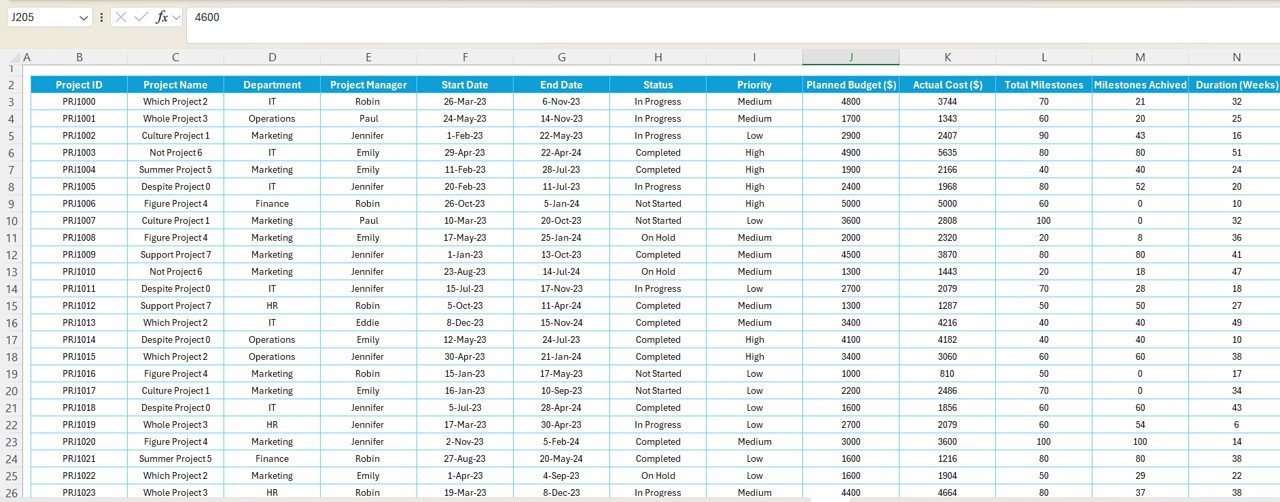
Data Sheet Tab: The input sheet where all project data is stored, driving the calculations and visualizations in the other tabs.
How to Use the Multiple Projects Management Dashboard 🛠️
Using the Multiple Projects Management Dashboard is simple and efficient:
-
Input Your Data: Enter all your project-related information in the Data Sheet Tab. This includes project names, costs, timelines, and more.
-
Monitor Key Metrics: Track key performance indicators (KPIs) such as budget health, project completion percentage, and timeline adherence in the Overview Sheet.
-
Evaluate Financials: Dive deeper into the project costs and budget with the Budget and Cost Analysis Sheet.
-
Assess Project Progress: Use the Timeline & Completion Sheet to visualize each project’s duration and completion percentage.
-
Performance Evaluation: Evaluate both project managers and departments using the Project Manager Performance Sheet and Department Performance Sheet tabs.
-
Use Slicers: Filter the data by various parameters to get a deeper understanding of specific project metrics.
Who Can Benefit from This Multiple Projects Management Dashboard? 👩💼
This dashboard is designed for:
-
Project Managers: Track and manage multiple projects with ease, ensuring timely completion and adherence to budgets.
-
Department Heads: Evaluate department-level performance, identify bottlenecks, and allocate resources effectively.
-
Business Owners: Stay on top of multiple ongoing projects and make data-driven decisions to keep your projects on track.
-
Operations Teams: Monitor project timelines, costs, and performance to ensure operational efficiency.
-
Finance Teams: Track the budget, actual costs, and budget variance for each project to ensure financial control.
Whether you’re managing a handful of projects or a large portfolio, this dashboard will help you keep everything in check.


Reviews
There are no reviews yet.