

The Risk Management KPI Dashboard in Excel is a vital tool designed to help businesses track, assess, and mitigate various risks. Whether you’re managing financial risks, operational risks, or strategic risks, this dashboard provides a centralized view of key performance indicators (KPIs) that help identify and manage risk factors across different business areas.
With real-time updates, customizable features, and visual charts, this dashboard is ideal for risk managers, compliance officers, financial analysts, and business owners who need to monitor, measure, and control potential risks within their organization. It allows businesses to make data-driven decisions to minimize risks and ensure the organization’s sustainability and growth.
Key Features of the Risk Management KPI Dashboard in Excel:
📊 Comprehensive Risk Tracking
Track various types of risks, including financial, operational, strategic, and compliance risks, across different business areas with a single dashboard.
📈 Real-Time Risk Monitoring
Monitor your organization’s exposure to risk in real time, providing insights into high-risk areas that may require immediate attention.
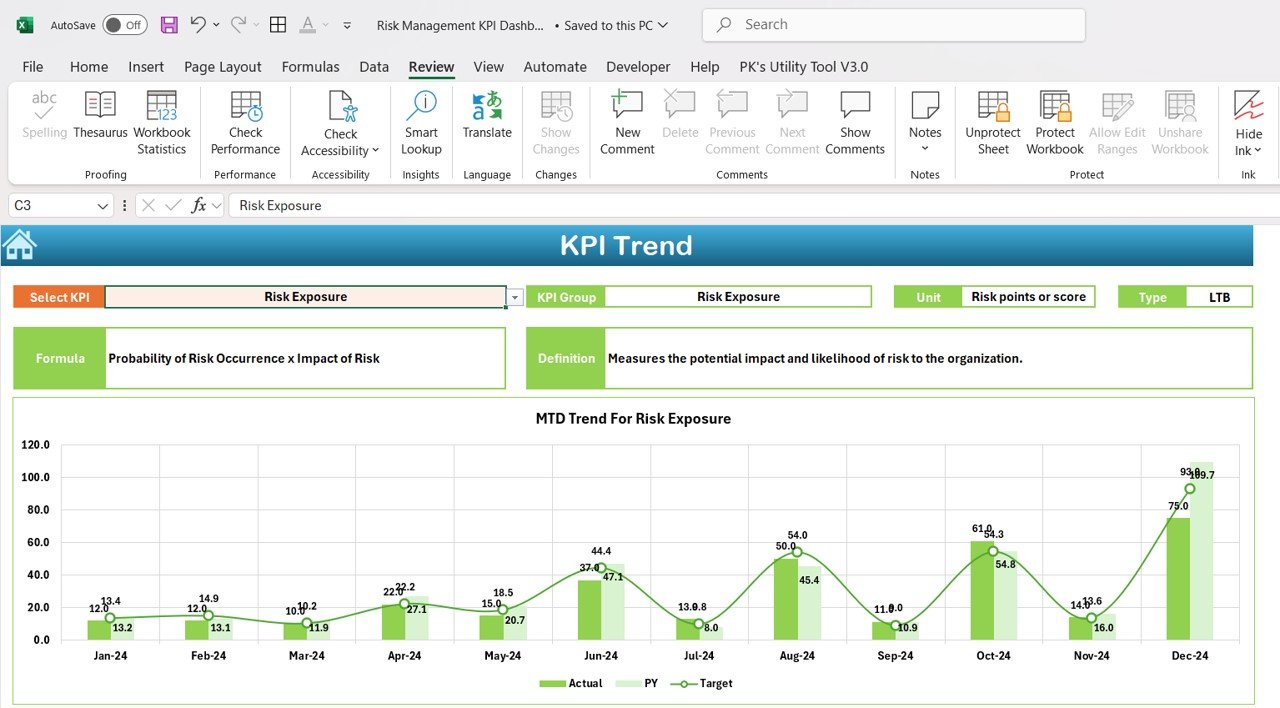
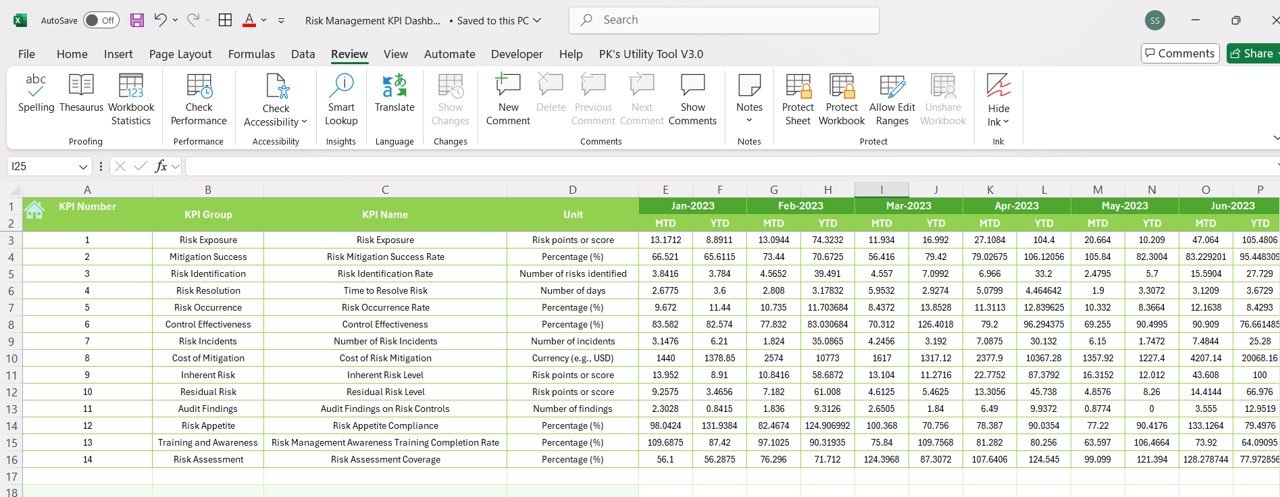
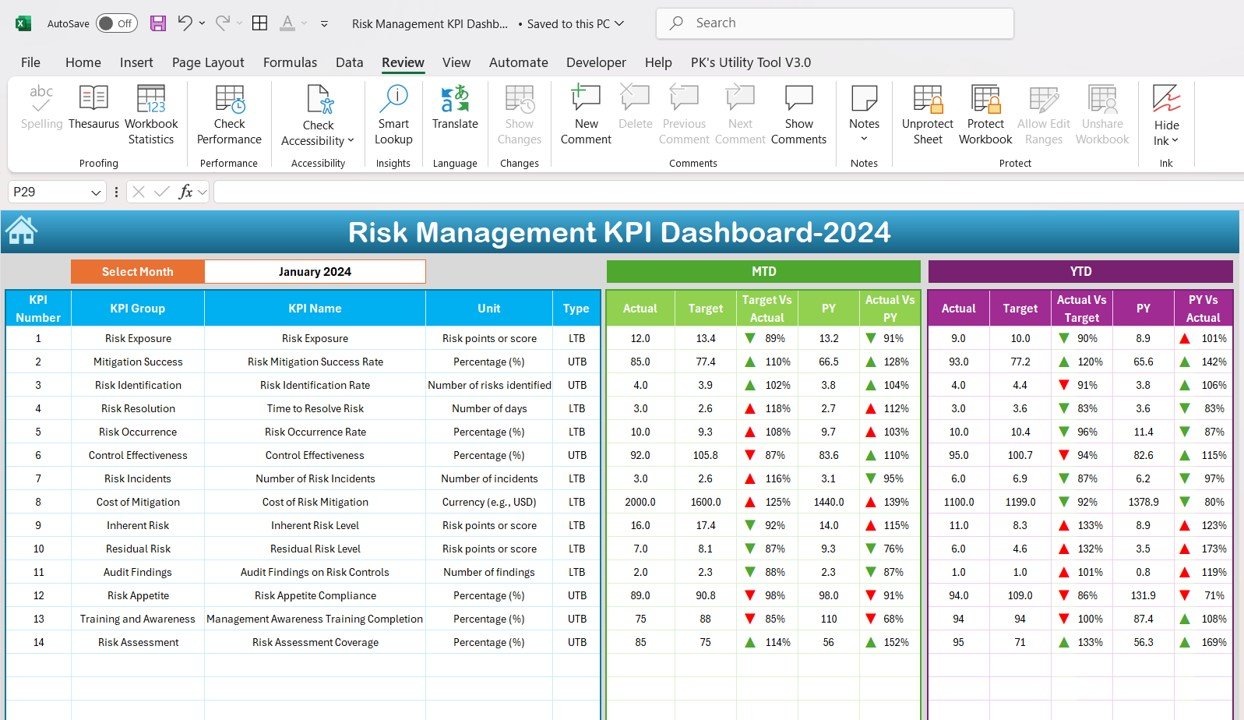
📅 Month-to-Date (MTD) and Year-to-Date (YTD) Tracking
Analyze risk trends over different periods to compare current performance against historical data and identify areas that need improvement.
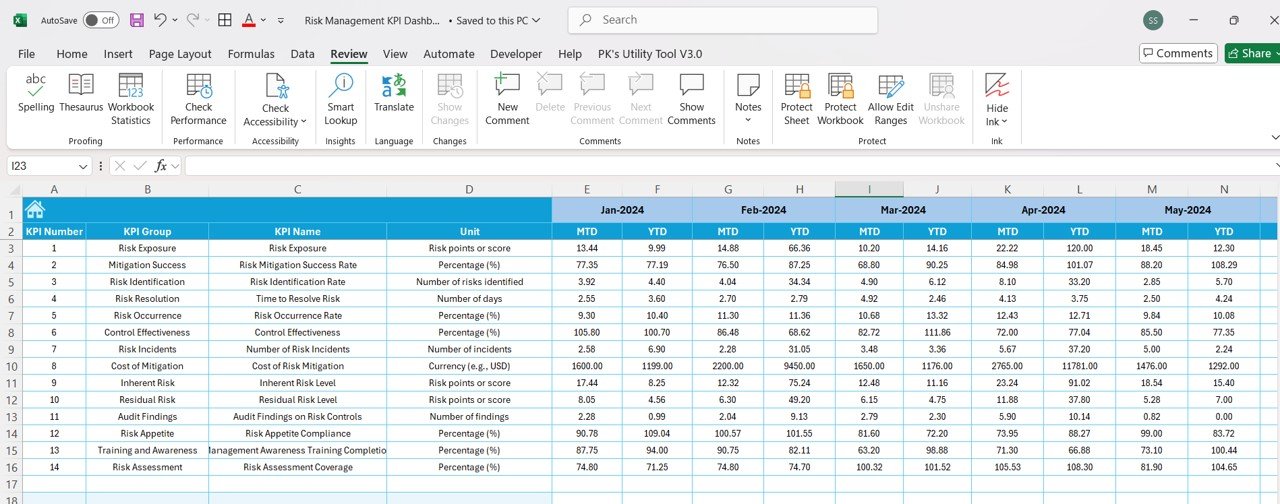
🎯 Goal Setting and Risk Comparison
Set specific risk mitigation goals for each KPI and compare actual risk levels against set targets to ensure risk reduction strategies are effective.
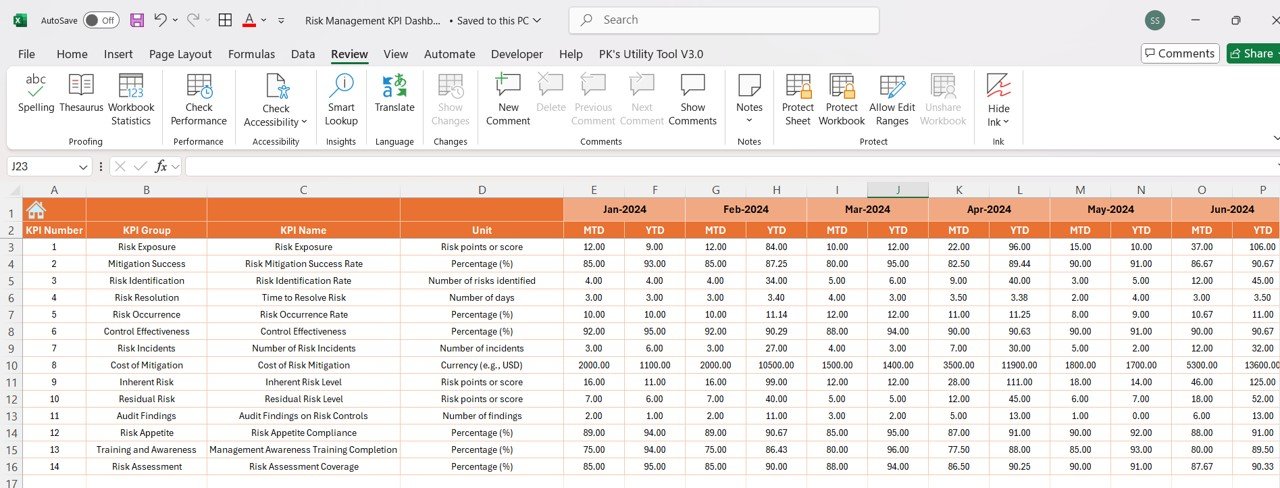
🛠 Customizable Inputs
Easily input your risk data, including potential risks, risk probability, impact scores, and mitigation actions, and customize the dashboard to meet your organization’s risk management needs.
🔔 Conditional Formatting Alerts
Receive color-coded alerts for high-risk areas that exceed acceptable thresholds, helping you take prompt actions to mitigate risks.
💡 Risk Exposure and Mitigation Insights
Gain deeper insights into risk exposure, mitigation progress, and the effectiveness of your risk management strategies with dynamic charts and graphs.
🚀 Why You’ll Love the Risk Management KPI Dashboard in Excel:
✅ Comprehensive Risk Overview – Track financial, operational, and compliance risks all in one place, providing a holistic view of your organization’s risk landscape.
✅ Proactive Risk Management – Quickly identify high-risk areas and take proactive steps to mitigate potential impacts.
✅ Improve Decision-Making – Use data-driven insights to adjust risk management strategies and ensure the organization stays on track.
✅ Enhance Risk Mitigation Strategies – Track the success of mitigation actions and identify which strategies are most effective in reducing risks.
✅ User-Friendly Interface – Designed for ease of use, this dashboard allows non-technical users to input data and interpret risk metrics quickly.
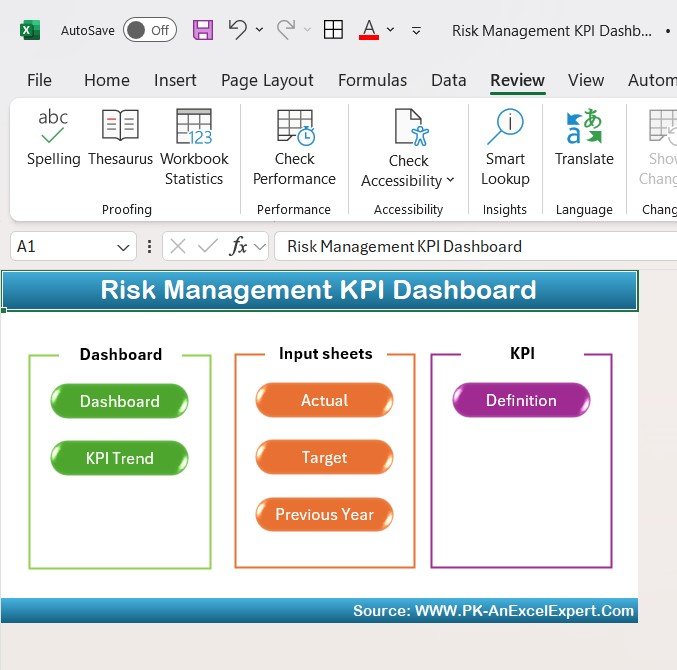
What’s Inside the Risk Management KPI Dashboard in Excel:
- Risk Identification KPI: Track identified risks, their probability of occurring, and their potential impact on the organization.
- Risk Mitigation KPI: Monitor the progress of risk mitigation actions and their effectiveness in reducing exposure to risks.
- Risk Impact and Probability KPI: Measure the probability and impact of identified risks, helping prioritize actions based on severity.
- Compliance Risk KPI: Track compliance risks by monitoring adherence to regulations, policies, and industry standards.
- Financial Risk KPI: Assess exposure to financial risks, including liquidity, credit, and market risks.
- Operational Risk KPI: Track risks related to business operations, including supply chain disruptions, system failures, and workforce issues.
How to Use the Risk Management KPI Dashboard in Excel:
1️⃣ Download the Template – Get instant access to the Excel dashboard upon purchase.
2️⃣ Input Your Risk Data – Enter risk data such as potential risks, probability, impact scores, and mitigation actions into the pre-designed fields.
3️⃣ Set Risk Management Targets – Define acceptable risk thresholds and mitigation goals to track progress.
4️⃣ Monitor Risk Levels – Use the real-time monitoring feature to stay updated on risk levels and mitigation efforts.
5️⃣ Generate Reports – Use the dashboard to generate comprehensive risk reports for internal reviews, audits, or stakeholder presentations.
Who Can Benefit from the Risk Management KPI Dashboard in Excel:
- Risk Managers
- Compliance Officers
- Financial Analysts
- Business Owners
- Operational Managers
- Internal Auditors
- Project Managers
- Legal Advisors
The Risk Management KPI Dashboard in Excel is an essential tool for any organization looking to monitor, mitigate, and manage risks effectively.
Click here to read the Detailed blog post
https://www.pk-anexcelexpert.com/risk-management-kpi-dashboard/
Visit our YouTube channel to learn step-by-step video tutorials
Youtube.com/@PKAnExcelExpert


Reviews
There are no reviews yet.