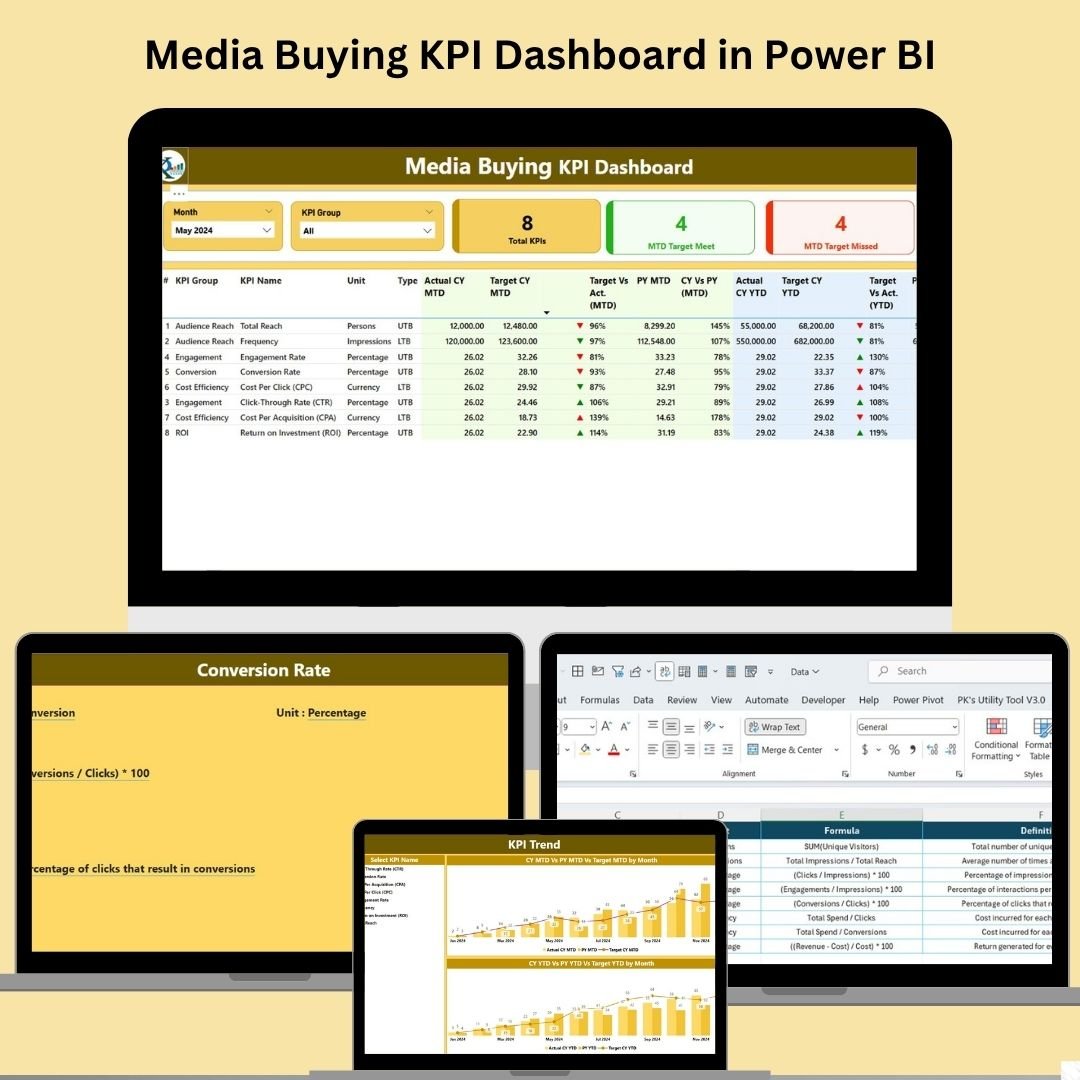
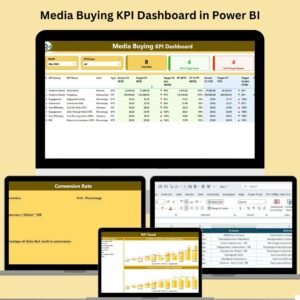
In today’s fast-paced digital landscape, tracking and optimizing your advertising efforts is no longer optional—it’s a necessity. That’s why we created the Media Buying KPI Dashboard in Power BI—a ready-to-use, fully interactive dashboard built to empower marketers and media buyers with real-time insights and data-driven decisions. 🚀📈
With just a few clicks, you can monitor all your essential KPIs like Cost Per Acquisition (CPA), Click-Through Rate (CTR), ROI, and more—all in one place. Whether you’re running Facebook Ads, Google Ads, or programmatic campaigns, this dashboard helps you make smarter media buying decisions, faster.
🔑 Key Features of the Media Buying KPI Dashboard in Power BI
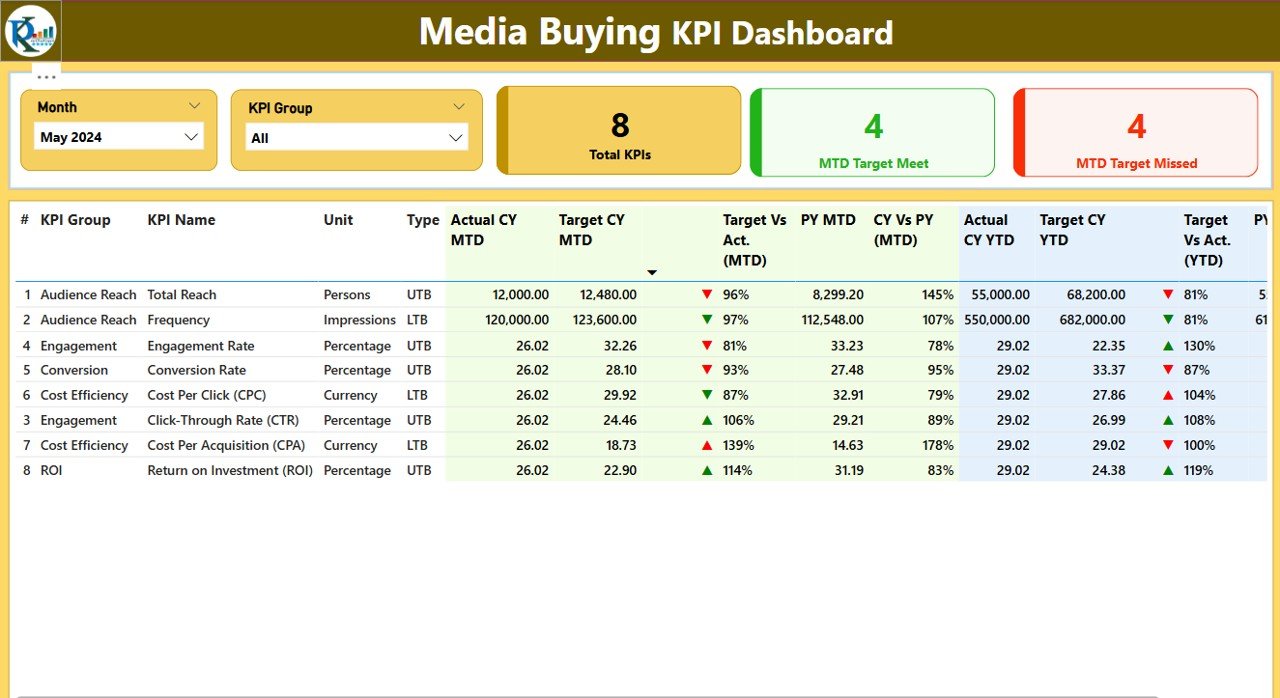
🎯 Summary Page Overview
-
Month & KPI Group Slicers to filter data by campaign period or category
-
KPI Cards to instantly see total KPIs, MTD Target Met, and Missed Counts
-
Detailed KPI Table with actuals, targets, performance indicators, and trend comparisons
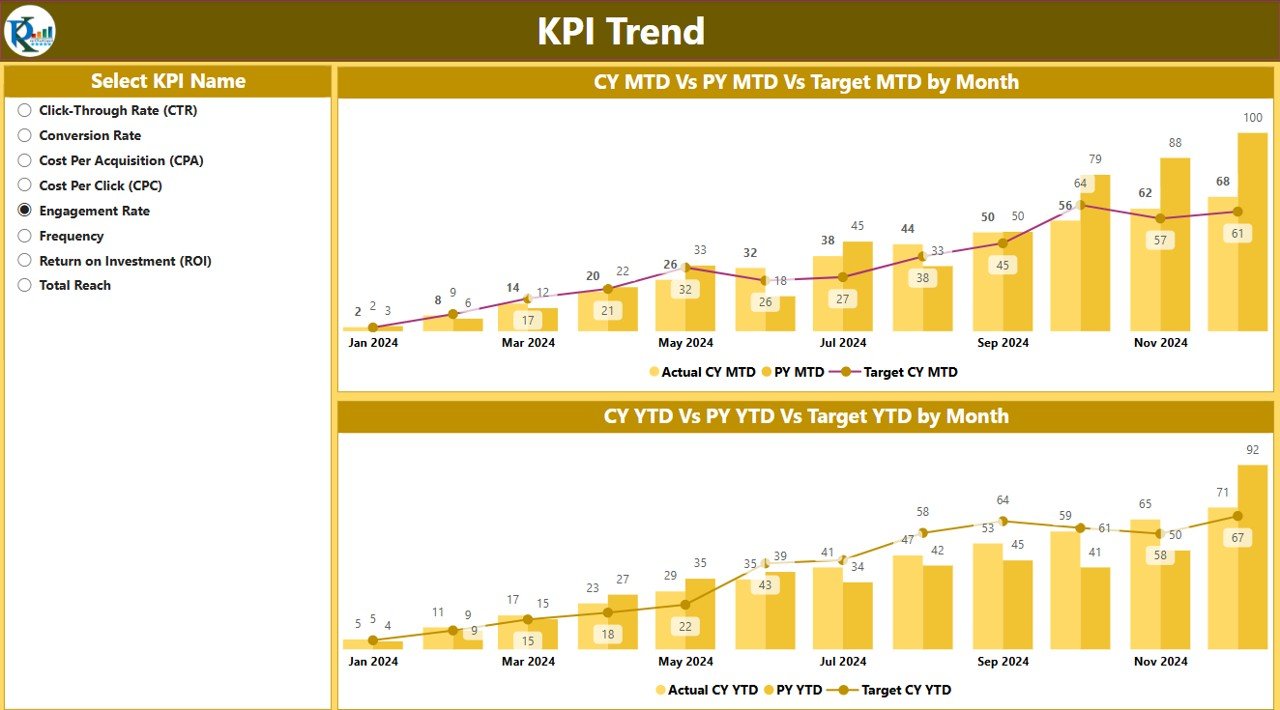
📊 KPI Trend Page
-
Two powerful combo charts showing MTD/YTD performance vs. targets
-
Select any KPI using the KPI Slicer and track results visually over time
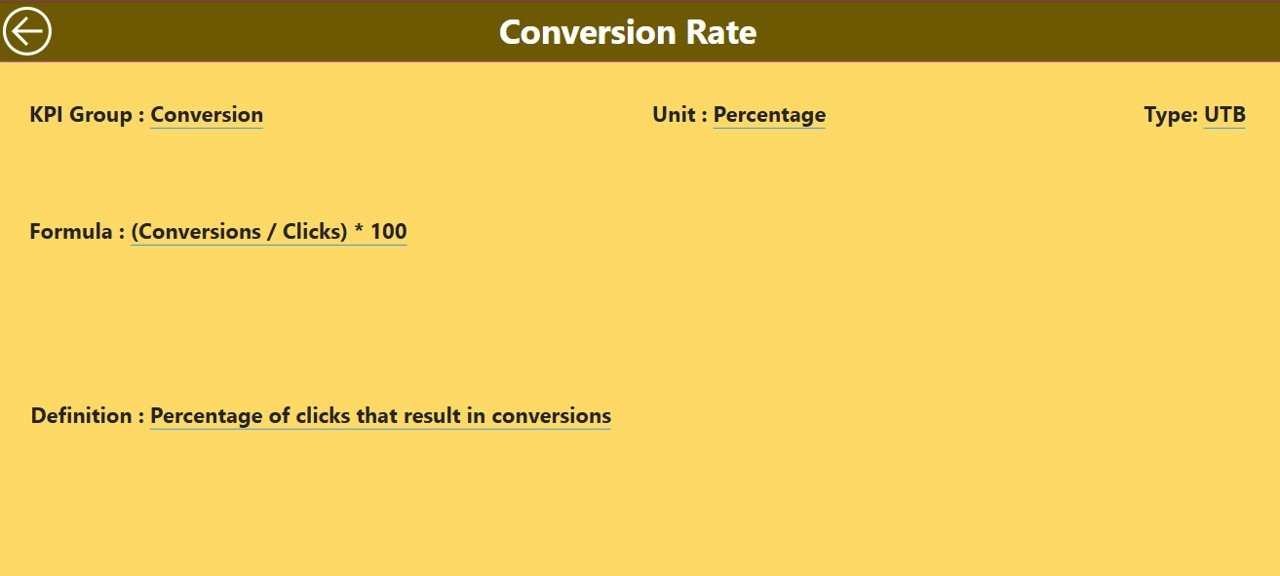
📖 KPI Definition Page
-
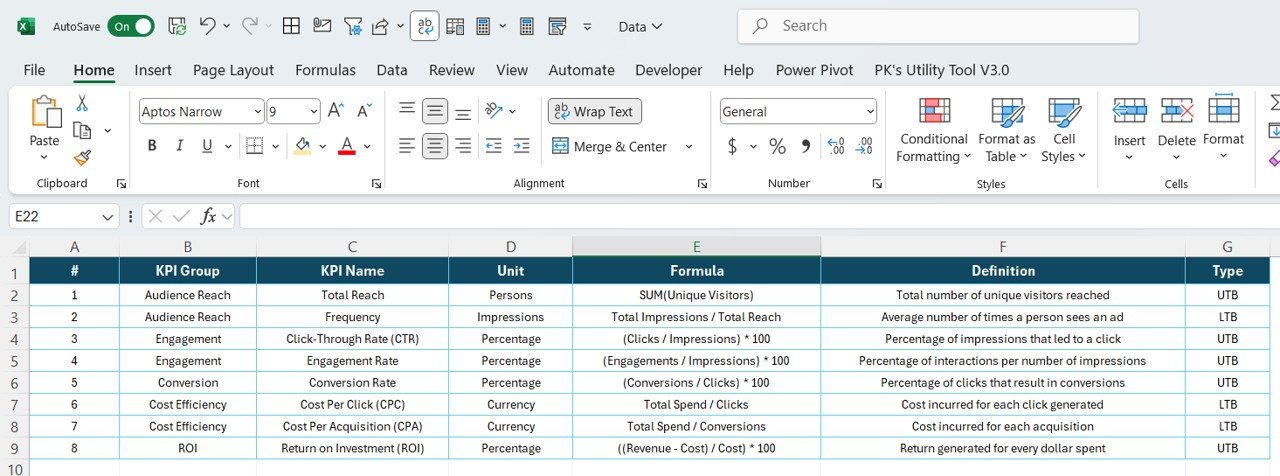
Drill-through enabled definitions of each KPI
-
Shows formula, meaning, and business impact
-
Back button for smooth navigation
📂 Excel Data Integration
-
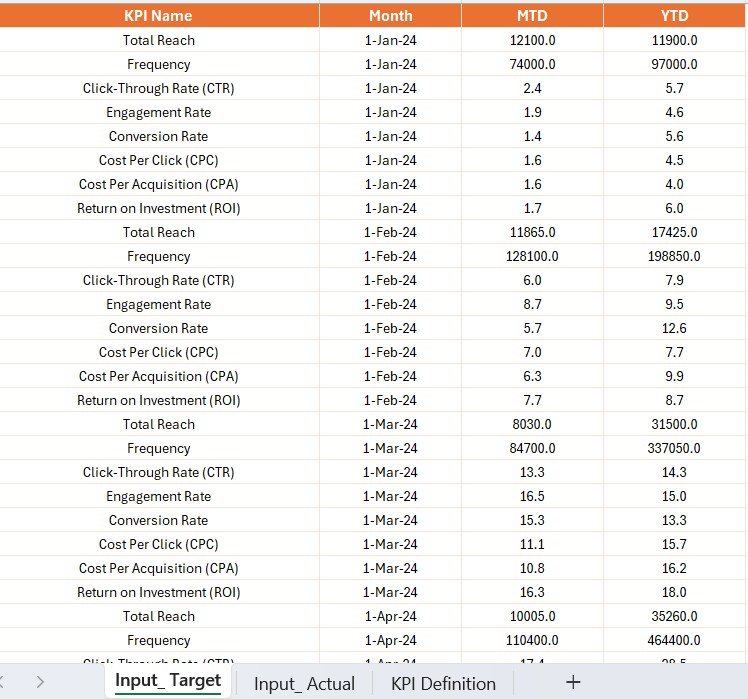
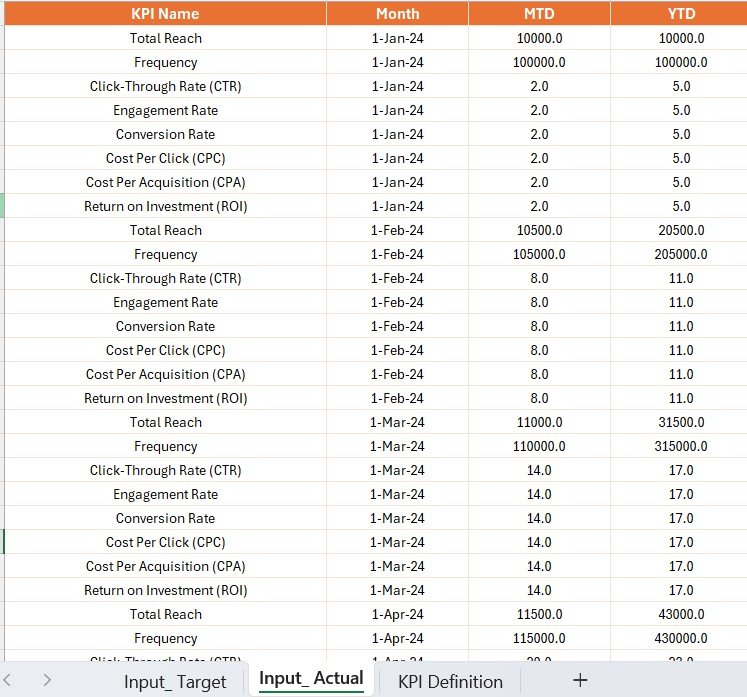
Pulls data directly from Excel worksheets
-
Input_Actual– for actuals -
Input_Target– for monthly targets -
KPI_Definition– for metadata and formulas
-
-
Makes data management super easy and refreshes seamless
💡 Visual Alerts with Icons
-
Green and Red indicators instantly show whether KPIs are on track or underperforming
-
Compare CY MTD vs. PY MTD in seconds
🛠️ Customizable & Scalable
-
Tailor the dashboard to your business: Add or remove KPIs, change slicers, or update visualizations
-
Ideal for agencies, freelancers, or in-house teams
📦 What’s Inside the Product
-
Power BI File (.pbix) with fully built dashboard
-
Excel Data File with 3 sheets: Actuals, Targets, Definitions
-
Pre-Connected Visuals & Slicers – no setup needed
-
Drill-Through & Back Navigation for ease of use
-
Dynamic Charts for MTD, YTD, and trend analysis
🧠 How to Use the Product
-
💾 Open the Power BI Dashboard file
-
📥 Load or update your Excel source data
-
🧮 Use slicers to filter by Month or KPI Group
-
📊 Review key metrics and performance visuals
-
🔍 Drill through to explore KPI formulas and meanings
-
💡 Make smarter, faster campaign decisions
👥 Who Can Benefit from This Dashboard?
📢 Digital Marketers & Media Buyers – track ROI, CTR, CPA in real-time
📈 Performance Marketing Teams – monitor trends and improve cost efficiency
💼 Ad Agencies – impress clients with data-backed media insights
📊 Business Analysts – visualize campaign performance with clarity
🧠 Marketing Consultants – back strategies with solid metrics
🧰 In-house Marketing Teams – optimize media spend without needing to build reports from scratch
🔗 Click here to read the Detailed blog post
🎥 Visit our YouTube channel to learn step-by-step video tutorials

















Reviews
There are no reviews yet.