The Media and Entertainment Dashboard in Google Sheets is a powerful, ready-to-use performance tracking system designed specifically for studios, OTT platforms, broadcasters, and digital media companies.
This interactive dashboard centralizes revenue, production cost, marketing cost, profit, viewer ratings, total views, and regional performance into one structured reporting system.
No complex BI tools.
No heavy software installation.
Just intelligent, cloud-based analytics inside Google Sheets.
With dynamic filters for Year, Month, Content Type, Genre, Platform, Region, and Language, you can analyze performance in seconds.
Key Feature of Media and Entertainment Dashboard in Google Sheets
📊 Executive KPI Summary Cards – Instantly view Revenue, Cost, Profit, Average Rating, and Total Views.
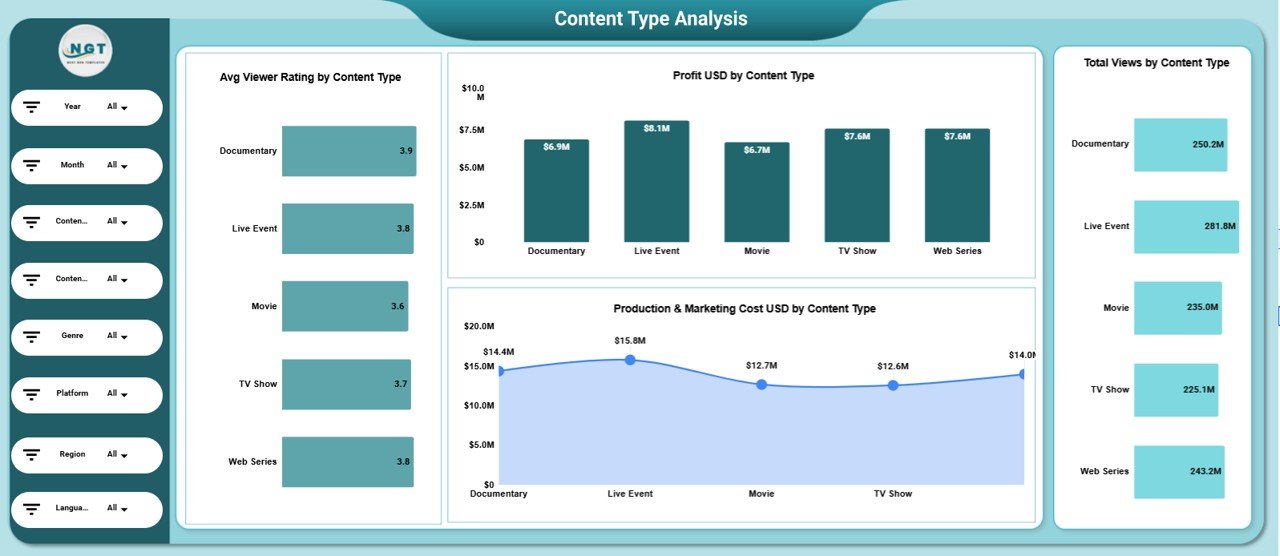
🎬 Content Type Analysis – Compare profit, ratings, views, and cost across Movies, Web Series, Live Events, and more.
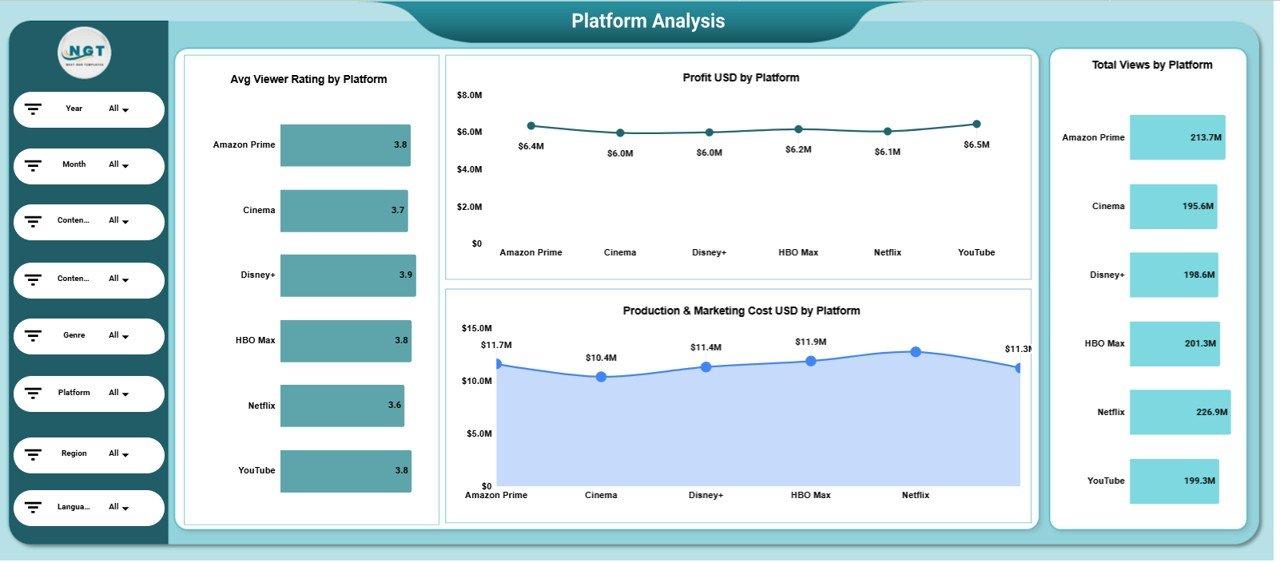
📺 Platform Performance Insights – Measure profitability and audience engagement by OTT platform.
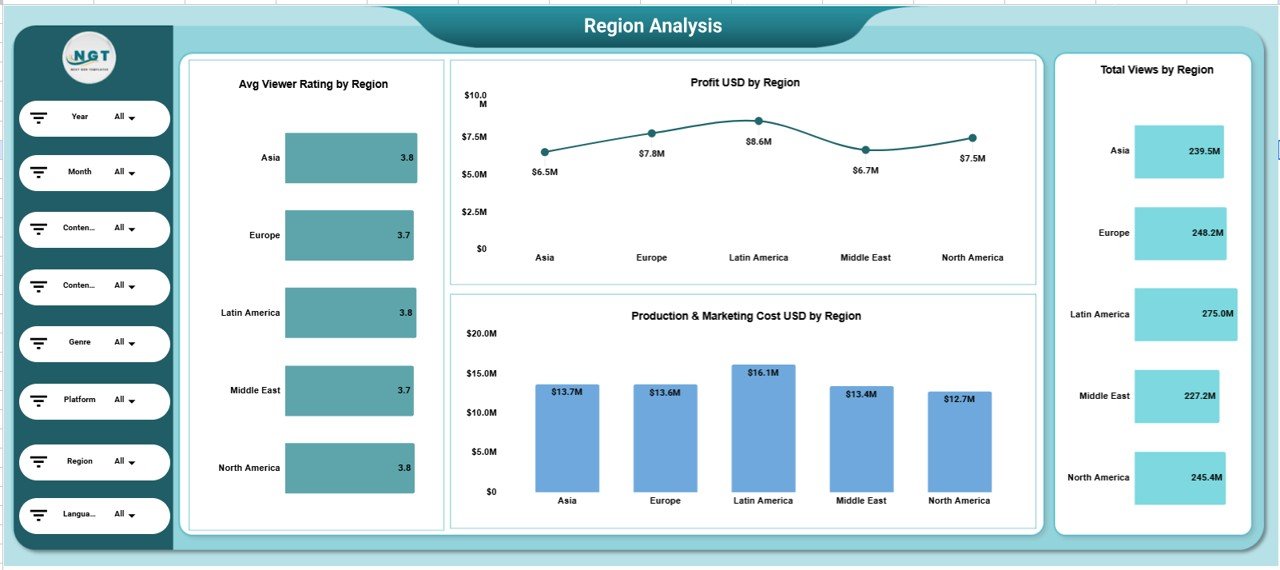
🌎 Regional Performance Tracking – Analyze revenue and views by region for strategic budget allocation.
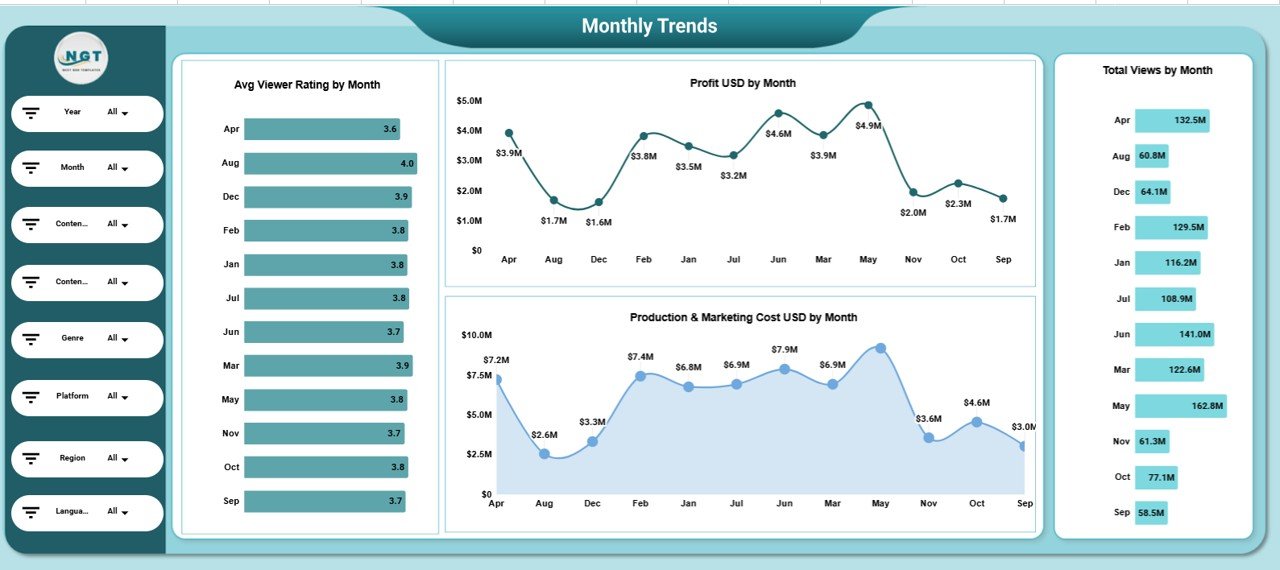
📈 Monthly Trend Analysis – Detect seasonal patterns in ratings, profit, and viewership.
🔍 Interactive Slicers & Filters – Filter data by Year, Month, Genre, Platform, Language, and Region.
☁️ Cloud Collaboration – Access and share insights in real time with your team.
What’s Inside the Media and Entertainment Dashboard in Google Sheets
This structured dashboard includes multiple analytical views:
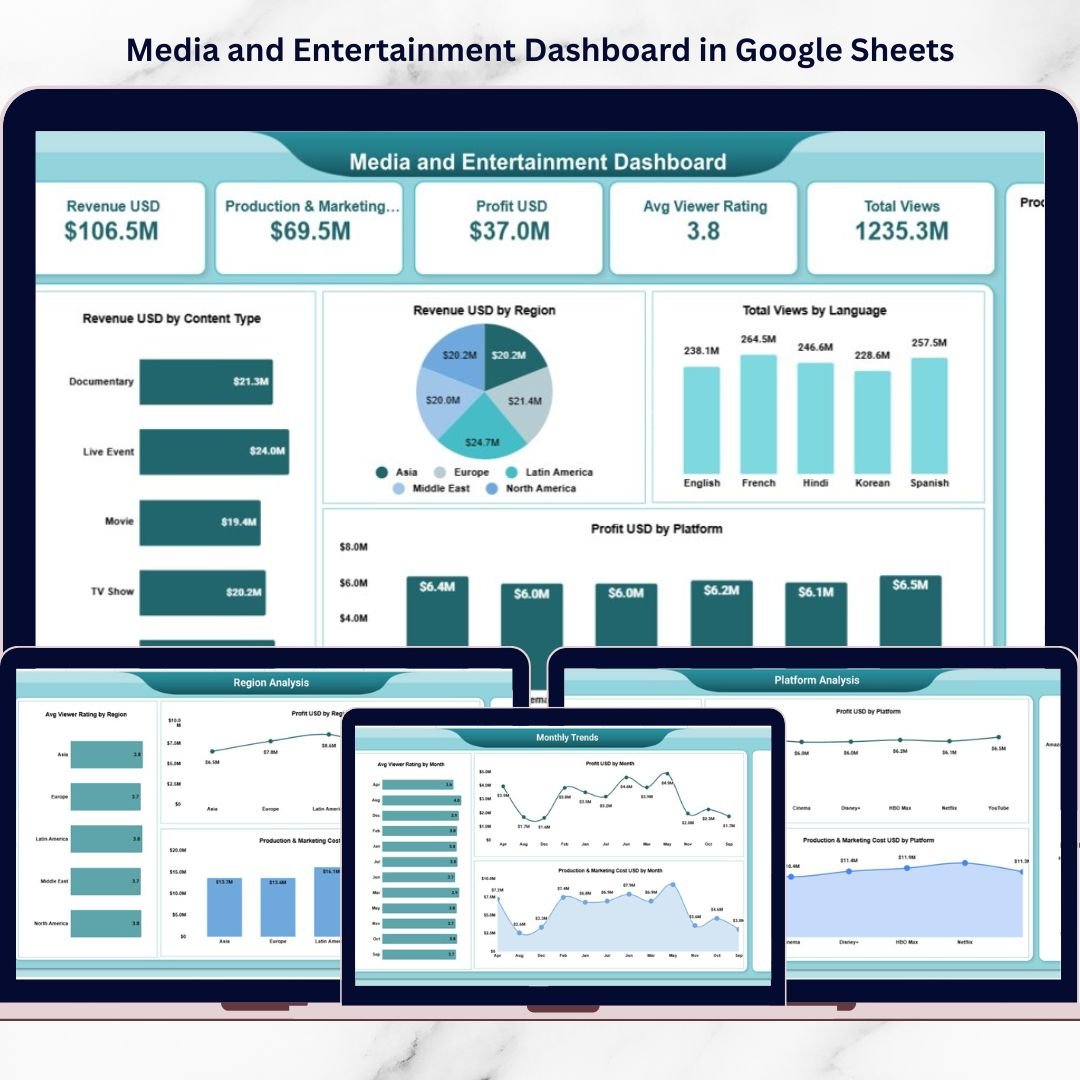
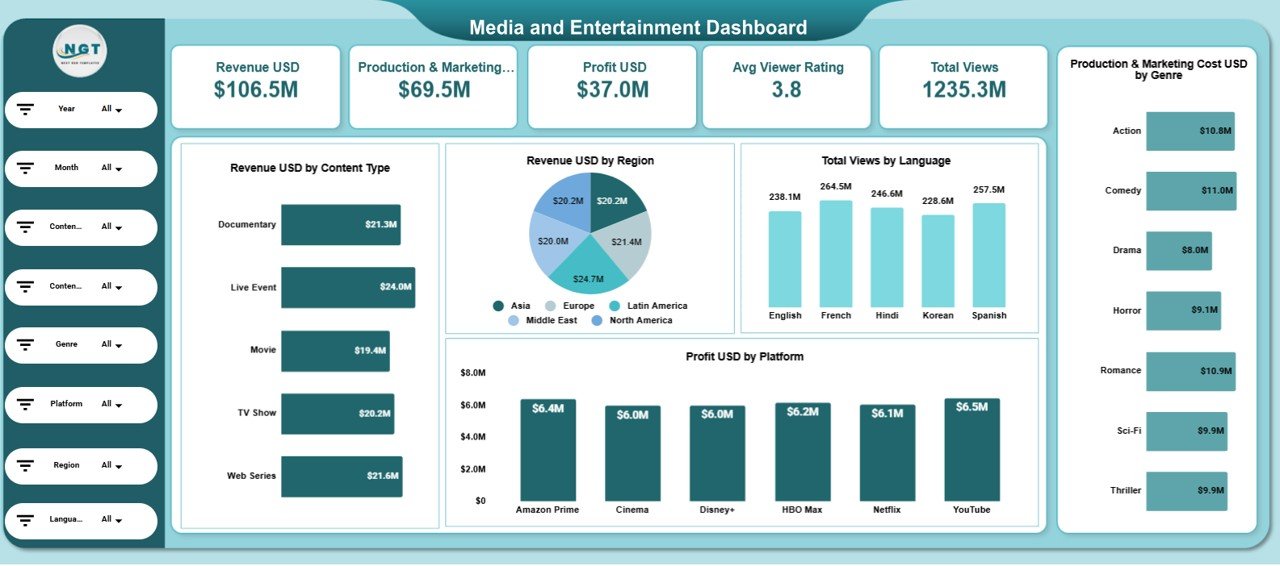
1️⃣ Main Dashboard Page – Executive Snapshot
Displays summary KPI cards such as:
-
Revenue: $106.5M
-
Production & Marketing Cost: $69.5M
-
Profit: $37.0M
-
Average Viewer Rating: 3.8
-
Total Views: 1235.3M
Also includes visual charts like:
-
Revenue by Content Type
-
Revenue by Region
-
Total Views by Language
-
Profit by Platform
2️⃣ Content Type Analysis Page
Break down performance by content format. Compare average rating, profit, cost, and total views by content type.
3️⃣ Platform Analysis Page
Measure ROI by OTT platforms and distributors. Analyze cost, revenue, rating, and audience engagement platform-wise.
4️⃣ Region Analysis Page
Track performance by geography. Identify high-performing regions and allocate marketing budgets accordingly.
5️⃣ Monthly Trends Page
Monitor monthly profit, cost, rating, and views to identify seasonal spikes and revenue patterns.
This organized layout ensures complete operational and financial visibility.
How to Use the Media and Entertainment Dashboard in Google Sheets
Using this dashboard is simple:
1️⃣ Input your revenue, cost, rating, and view data in the data sheet.
2️⃣ Use filters to select Year, Month, Platform, Genre, or Region.
3️⃣ Instantly analyze updated KPIs across all charts.
4️⃣ Compare profitability by content type and platform.
5️⃣ Monitor monthly trends to forecast future performance.
Because the dashboard updates automatically with filter selection, decision-making becomes fast and data-driven.
Who Can Benefit from This Media and Entertainment Dashboard in Google Sheets
This dashboard is ideal for:
🎬 Film Studios
📺 OTT Platforms
📡 Broadcasters
🎥 Content Production Houses
📊 Media Executives
📈 Marketing Teams
🌎 Digital Publishers
Whether you manage theatrical releases, streaming content, or regional programming, this dashboard adapts to your business model.
Why This Dashboard Drives Smarter Media Decisions
When you consistently track:
✔ Revenue by platform
✔ Production and marketing cost
✔ Profit margins
✔ Viewer ratings
✔ Total views
✔ Regional performance
You gain clarity.
You identify high-performing genres.
You control cost overruns.
You optimize marketing budgets.
You improve content strategy.
Instead of guessing which platform performs better, you see the data instantly.
Instead of reacting late to declining ratings, you detect patterns early.
This dashboard transforms raw media data into actionable insights.
It’s not just reporting — it’s strategic performance control for modern media businesses.
Click here to read the Detailed blog post
Watch the step-by-step video tutorial: