

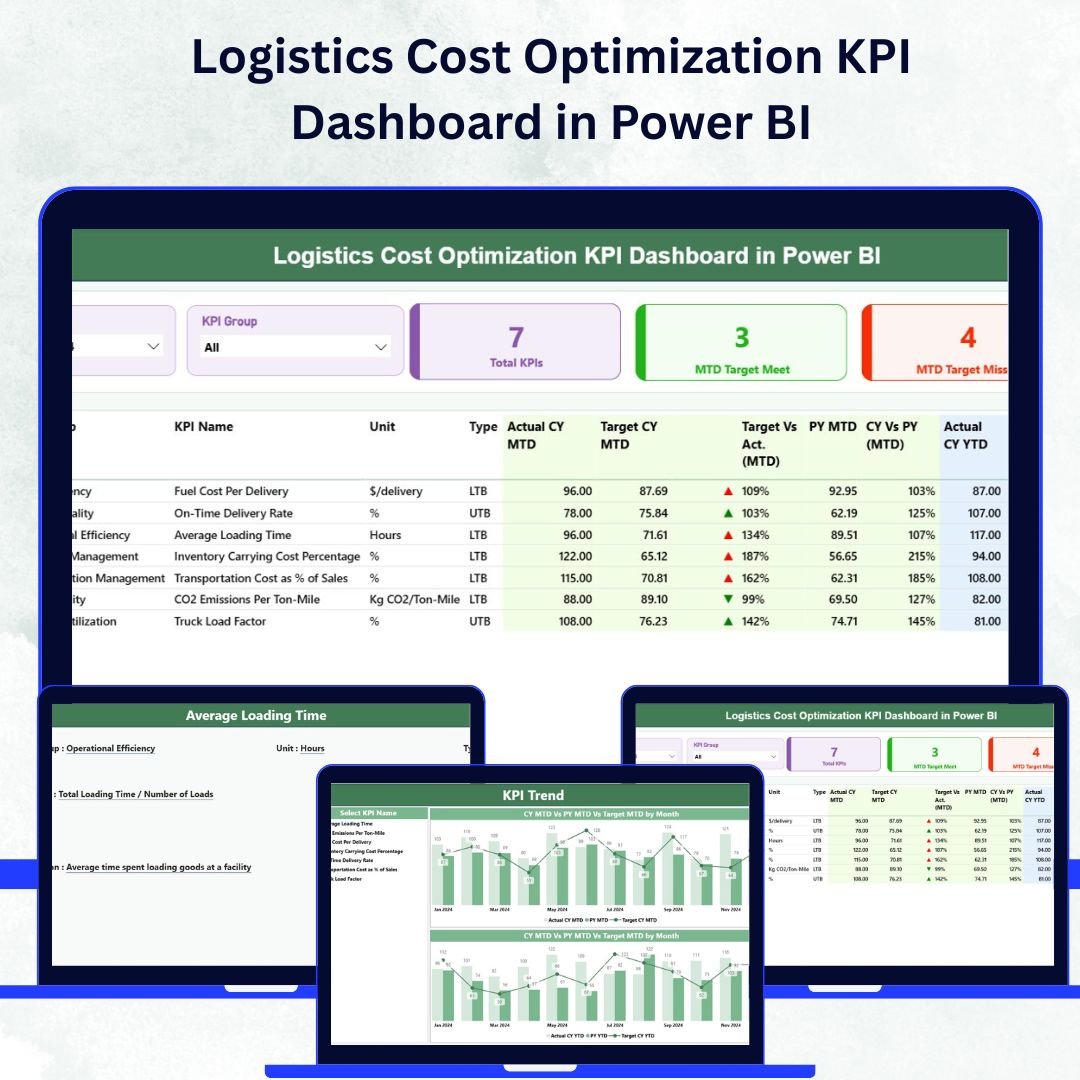

In the modern logistics landscape, cost control is not just about saving money — it’s about maximizing operational efficiency and ensuring every mile, shipment, and route contributes to profitability. The Logistics Cost Optimization KPI Dashboard in Power BI empowers logistics and supply chain professionals to monitor, analyze, and optimize transportation and warehouse expenses in real time.
Built using Microsoft Power BI, this interactive dashboard transforms raw logistics data from Excel or ERP systems into powerful, actionable insights. Whether you’re tracking freight costs, fuel efficiency, or warehouse utilization, this dashboard provides a 360° view of logistics performance — helping businesses cut costs, improve delivery performance, and make smarter, data-driven decisions.
⚙️ Key Features of the Logistics Cost Optimization KPI Dashboard in Power BI
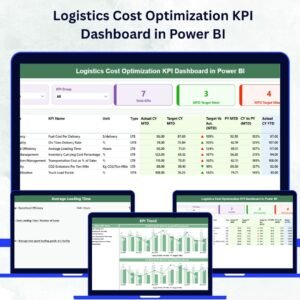
📊 Three Analytical Pages:
Includes Summary Page, KPI Trend Page, and KPI Definition Page — covering everything from high-level overviews to in-depth KPI analysis.
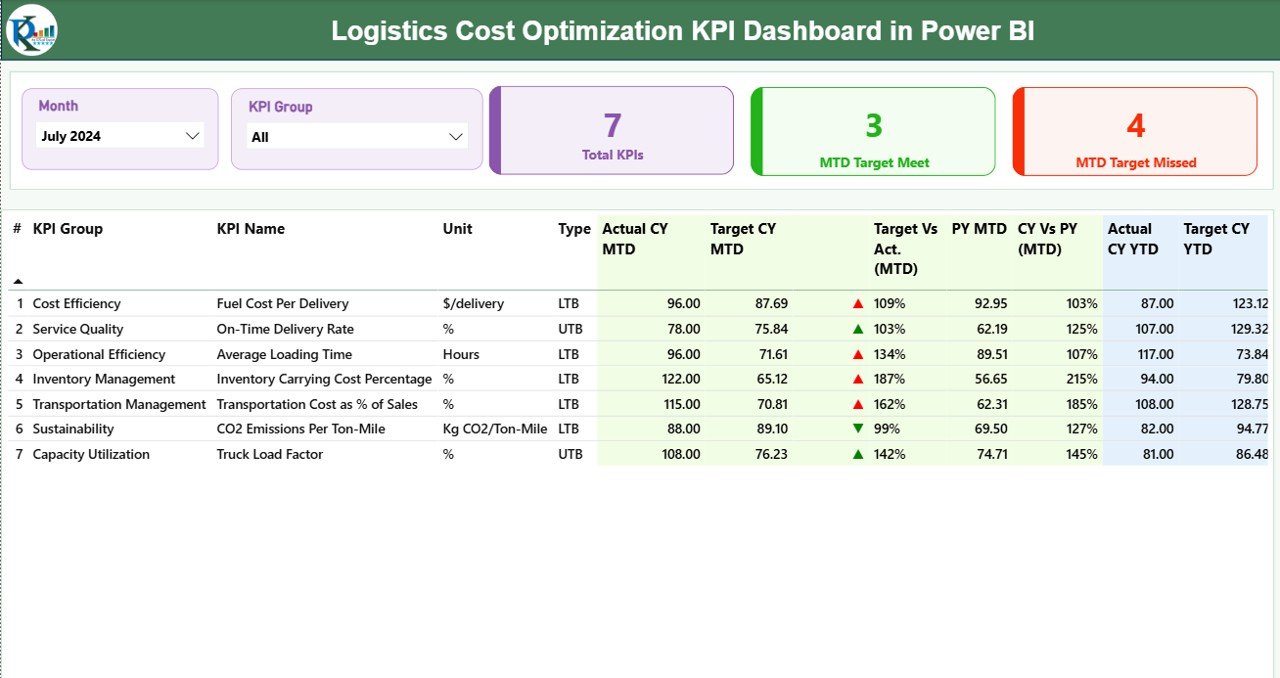
🎯 Performance Cards at a Glance:
Quickly evaluate performance with Total KPIs Count, MTD Target Met, and MTD Target Missed cards. Know instantly whether logistics operations are on track or falling short.
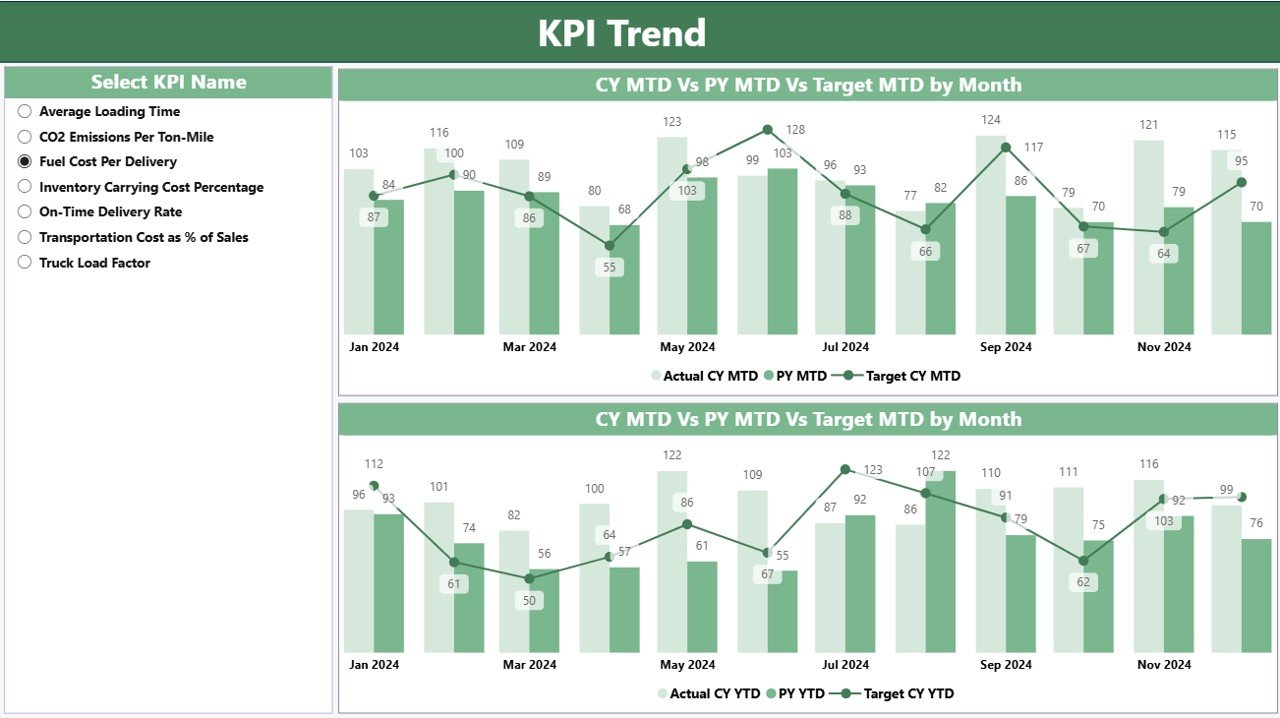
📈 KPI Trend Analysis:
Compare Actual, Target, and Previous Year (PY) values in combo charts to identify trends and evaluate performance improvements over time.
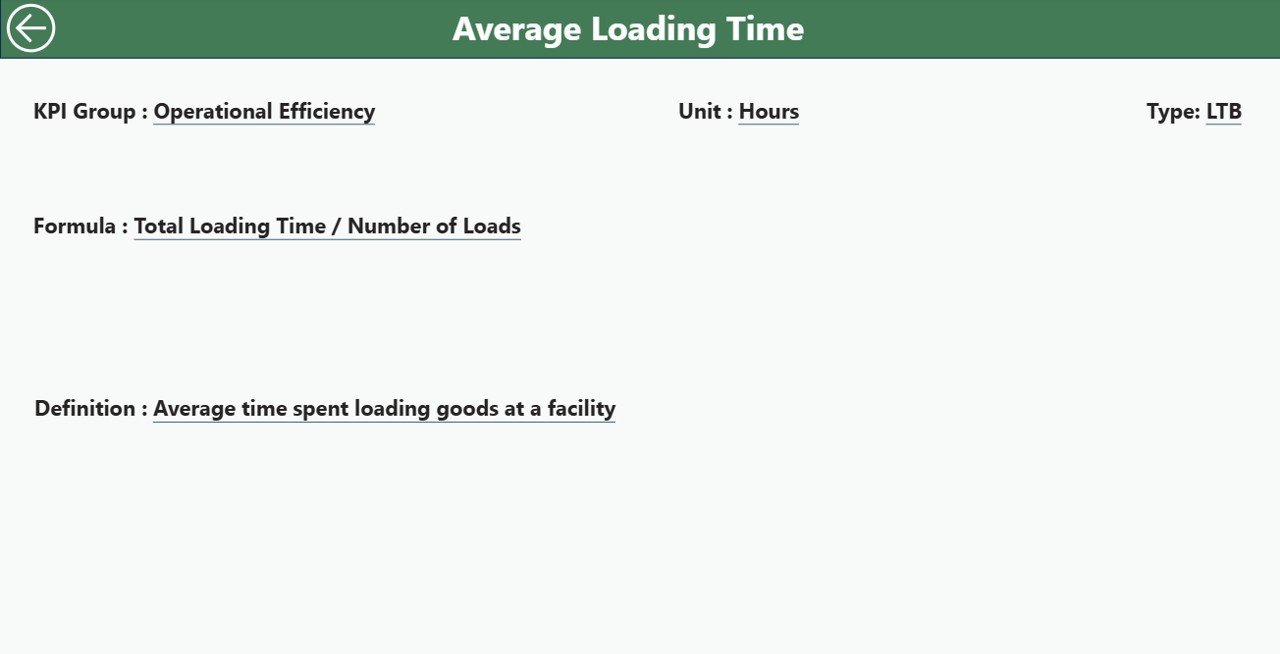
📘 KPI Definition Transparency:
Each KPI is fully documented with its Formula, Definition, Unit, and Type (LTB/UTB) to maintain clarity and ensure consistent performance tracking.
💡 Dynamic Slicers:
Filter data by Month or KPI Group to focus your analysis on specific time frames or performance categories.
🔗 Excel Integration:
The dashboard connects directly to Excel data sources — allowing effortless updates and automatic refreshes for the latest performance data.
📊 Interactive Visuals:
Drill through visuals to explore KPI-level insights and return easily to the main view using the built-in navigation buttons.
🔍 Real-Time Monitoring:
Instantly spot high-cost routes, underperforming KPIs, and inefficiencies using visual indicators and conditional formatting.
📉 Cost Optimization Insights:
Identify cost-per-shipment, cost-per-mile, or department-level spending to enhance financial control and reduce waste.
📊 What’s Inside the Logistics Cost Optimization KPI Dashboard
1️⃣ Summary Page:
The main control center featuring slicers, performance cards, and KPI summary visuals. Perfect for executives to assess Month-to-Date (MTD) performance at a glance.
2️⃣ KPI Trend Page:
Dive deeper into performance trends with interactive combo charts comparing Actual, Target, and Previous Year (PY) values for both MTD and YTD (Year-to-Date).
3️⃣ KPI Definition Page:
A detailed reference section displaying KPI details — Formula, Definition, Unit, and Type — accessible via drill-through from the Summary Page.
📂 Data Structure Includes:
Input_Actual Sheet: Holds real-time logistics performance data.
Input_Target Sheet: Contains target KPIs for variance analysis.
KPI Definition Sheet: Defines every KPI used across the dashboard.
This structure ensures data integrity, transparency, and smooth automatic refreshes in Power BI.
🧭 How to Use the Logistics Cost Optimization KPI Dashboard in Power BI
✅ Step 1: Connect your Excel data (Actual, Target, and Definition sheets) to Power BI.
✅ Step 2: Refresh the dashboard to load the latest logistics data.
✅ Step 3: Use slicers to filter by Month or KPI Group for focused analysis.
✅ Step 4: Explore KPI trends across MTD and YTD to detect inefficiencies.
✅ Step 5: Drill through to KPI details for formula and performance explanations.
In just a few clicks, you’ll transform logistics data into real-time insights that drive measurable cost savings and performance improvement.
👥 Who Can Benefit from This Dashboard
🚛 Logistics Managers: Monitor transportation cost efficiency and route performance.
🏭 Supply Chain Professionals: Optimize warehousing, inventory, and shipment processes.
💰 Finance Teams: Track logistics costs against revenue to ensure budget control.
📦 Operations Heads: Identify inefficiencies and make informed resource allocations.
📊 Business Analysts: Perform in-depth KPI analysis to support strategic planning.
🌟 Advantages of the Logistics Cost Optimization KPI Dashboard in Power BI
✅ Centralized Data: Combine logistics and cost data from multiple sources.
✅ Real-Time Analytics: Get up-to-date performance insights at a glance.
✅ Customizable Design: Modify visuals, colors, and KPIs to fit your needs.
✅ Cost Efficiency: Identify cost drivers and reduce overheads.
✅ Data Transparency: Every KPI definition is easily accessible.
✅ Decision Support: Visualize trends that lead to smarter budgeting and resource allocation.
✅ Scalable for All Industries: Works perfectly for manufacturing, retail, e-commerce, or logistics firms.
🔗 Click here to read the Detailed Blog Post
🎥 Visit our YouTube channel for step-by-step tutorials
🔗 YouTube.com/@PKAnExcelExpert

















Reviews
There are no reviews yet.