
Managing legal operations can quickly become overwhelming for law firms and corporate legal departments. Organizations often deal with hundreds of legal cases simultaneously, involving multiple clients, lawyers, departments, and case types. Without a structured monitoring system, tracking case progress, managing legal costs, and evaluating lawyer performance becomes extremely difficult.
This is where the Legal Dashboard in Google Sheets becomes a powerful solution.
The Legal Dashboard in Google Sheets is a professionally designed, ready-to-use analytics tool that helps legal teams monitor case performance, track legal costs, analyze lawyer workload, and evaluate client satisfaction in one centralized dashboard. Instead of reviewing scattered spreadsheets or disconnected reports, managers can view all important legal metrics in one place.
Because Google Sheets operates in the cloud, teams can collaborate easily and update data from anywhere. The dashboard transforms raw legal case data into interactive charts, KPI cards, and analytical reports, allowing decision-makers to quickly understand legal performance and operational trends.
Whether you run a law firm, manage corporate legal operations, or monitor legal compliance, this dashboard provides clear insights that help improve decision-making and operational efficiency.
⚖️ Key Feature of Legal Dashboard in Google Sheets
The Legal Dashboard in Google Sheets offers powerful analytical features designed to simplify legal performance monitoring.
📊 Interactive KPI Dashboard
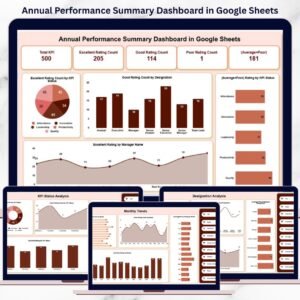
The overview page displays important legal KPIs such as Total Cases, Open Cases, Client Satisfaction Score, and Legal Costs, providing a quick snapshot of legal operations.
🔎 Dynamic Filters and Navigation
Users can analyze data using filters based on Client Name, Case Type, Department, Lawyer Assigned, and Case Status.
📈 Multiple Analytical Pages
The dashboard includes several analytical pages that provide deeper insights into legal performance.
📉 Visual Charts and Performance Indicators
Interactive charts help legal managers analyze case trends, lawyer workload distribution, and financial performance.
📅 Monthly Trend Monitoring
Track legal workload and cost trends across different months to identify seasonal patterns in legal operations.
⚡ Search Functionality for Quick Case Lookup
Users can quickly find case records using search fields such as Case ID, Client Name, Case Type, or Lawyer Assigned.
☁️ Cloud-Based Collaboration
Since the dashboard is built in Google Sheets, multiple team members can access and update the dashboard simultaneously.
📊 Data-Driven Legal Decision Making
Managers can analyze workload distribution, department performance, and legal costs to improve operational efficiency.
📦 What’s Inside the Legal Dashboard in Google Sheets
This ready-to-use template contains five powerful analytical pages designed to monitor legal operations effectively.
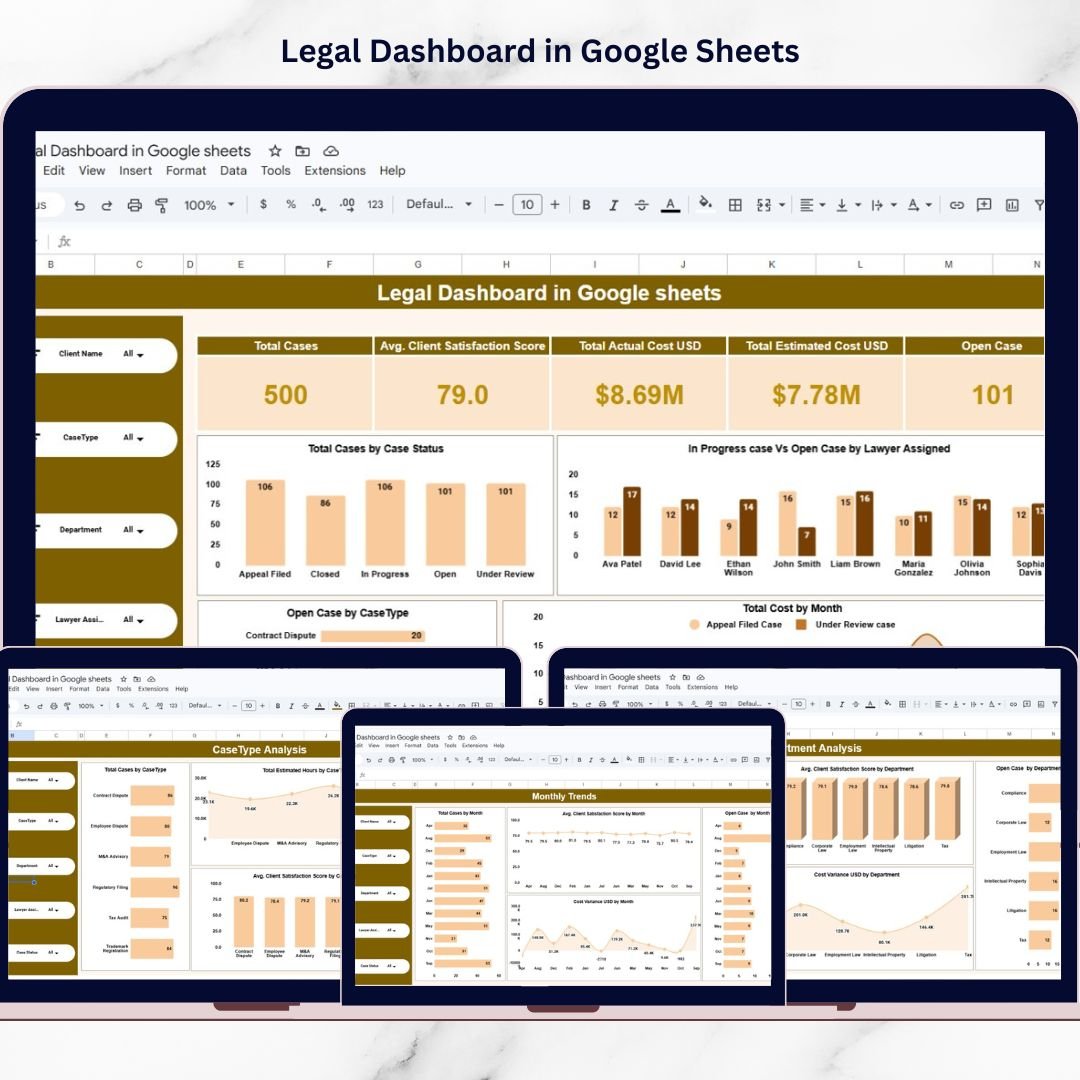
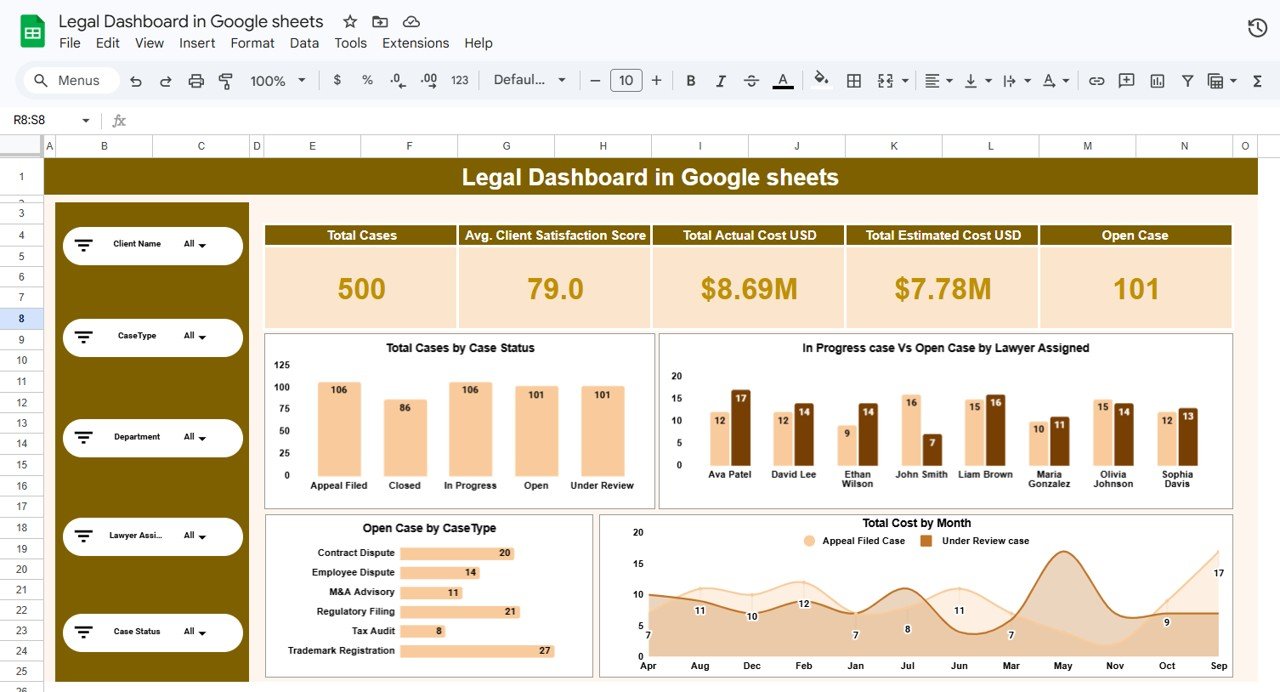
📊 Overview Page – Main Legal Dashboard
Displays high-level KPIs including Total Cases, Open Cases, Client Satisfaction Score, Estimated Cost, and Actual Cost. It also includes charts showing case status distribution and monthly legal costs.
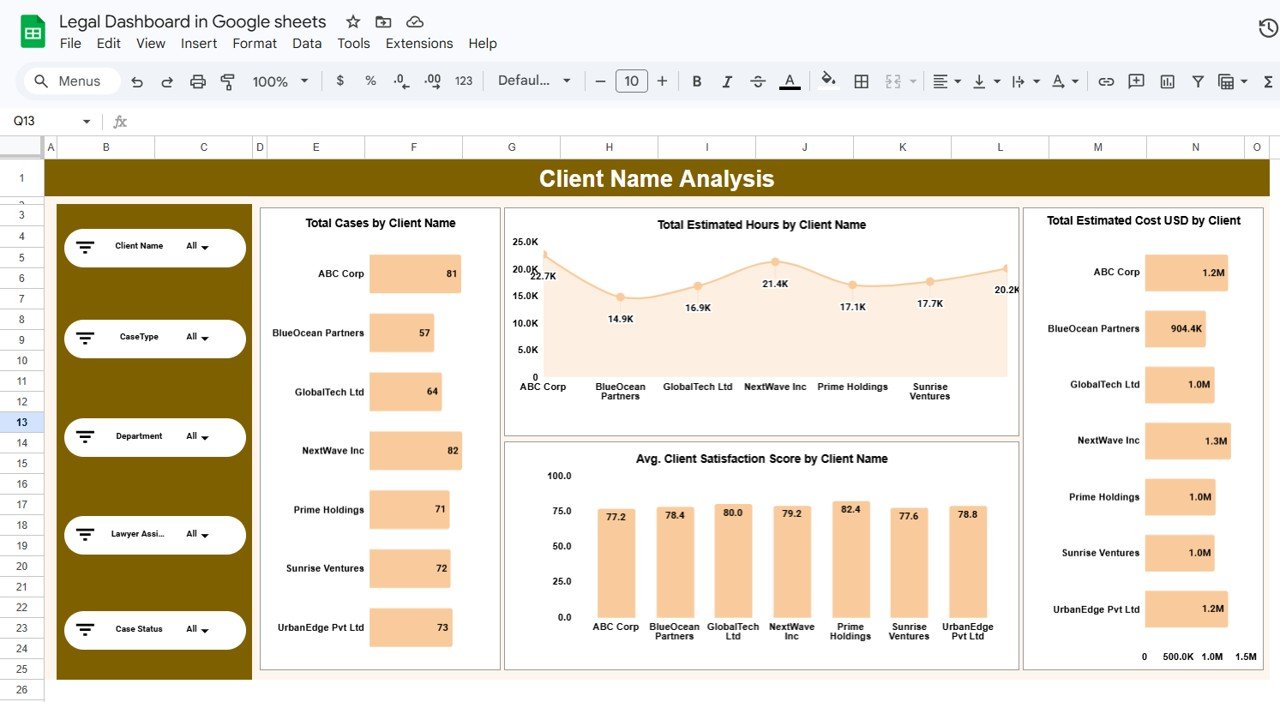
👥 Client Name Analysis Page
Analyzes legal workload generated by different clients with charts such as Total Cases by Client, Estimated Hours by Client, Estimated Cost by Client, and Client Satisfaction Score by Client.
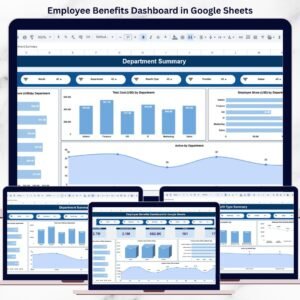
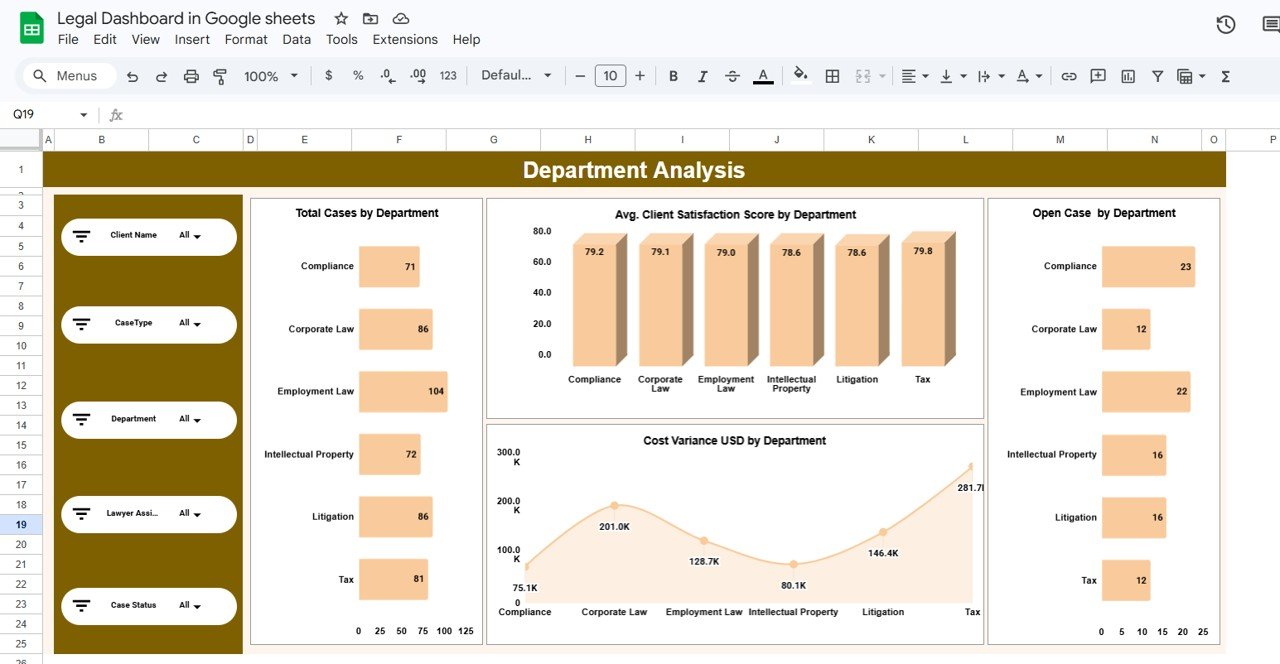
🏢 Department Analysis Page
Provides insights into department performance with charts such as Total Cases by Department, Open Cases by Department, Cost Variance by Department, and Client Satisfaction Score by Department.
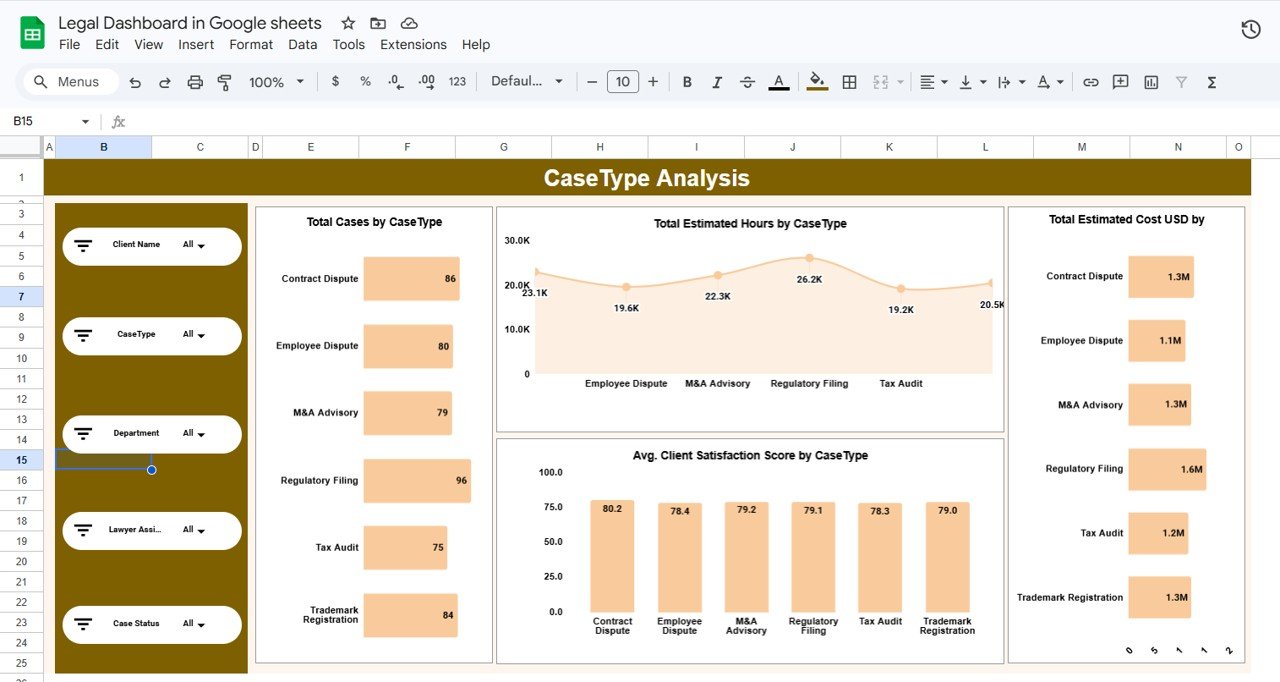
⚖️ Case Type Analysis Page
Helps firms understand which legal services generate the most workload using charts such as Total Cases by Case Type, Estimated Hours by Case Type, Estimated Cost by Case Type, and Satisfaction Score by Case Type.
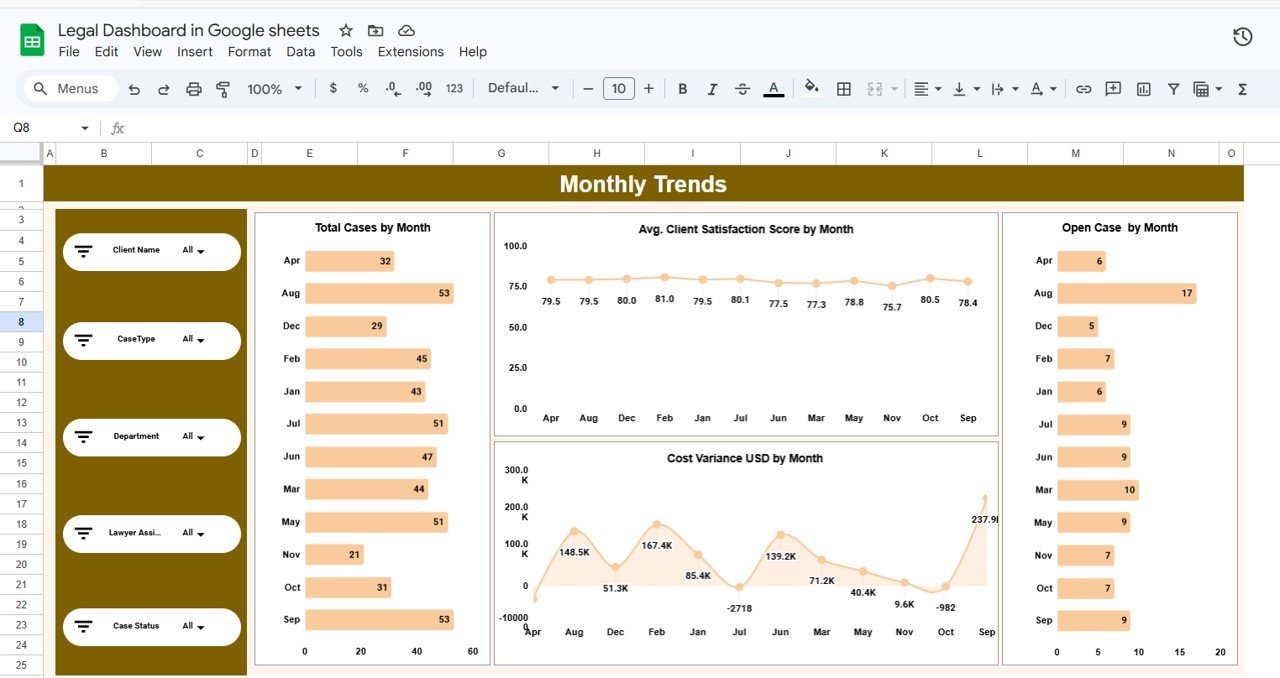
📅 Monthly Trends Page
Tracks time-based legal performance trends including Total Cases by Month, Open Cases by Month, Client Satisfaction Score by Month, and Cost Variance by Month.
📂 Structured Data Sheet
The dashboard includes a structured dataset with important fields such as Case ID, Client Name, Department, Case Type, Lawyer Assigned, Case Status, Estimated Hours, Actual Hours, Estimated Cost, Actual Cost, and Client Satisfaction Score.
⚙️ How to Use the Legal Dashboard in Google Sheets
Using the Legal Dashboard in Google Sheets is simple and requires no advanced technical skills.
Step 1 – Enter Case Data
Record legal case information in the data sheet including client name, department, case type, costs, and lawyer assignment.
Step 2 – Update Case Status
Update case progress regularly to keep the dashboard accurate.
Step 3 – Use Filters to Analyze Data
Apply filters to analyze data based on client, lawyer, department, or case type.
Step 4 – Monitor Key KPIs
Review important performance indicators such as total cases, open cases, legal costs, and satisfaction scores.
Step 5 – Analyze Trends
Use monthly trend charts to understand workload patterns and plan legal resources effectively.
By following these steps, legal teams can build a centralized monitoring system for legal operations.
👥 Who Can Benefit from This Legal Dashboard in Google Sheets
This dashboard is useful for many professionals working in legal operations.
⚖️ Law Firms – Track case progress, client satisfaction, and legal workload efficiently.
🏢 Corporate Legal Departments – Monitor legal cases, compliance activities, and legal expenses.
📊 Legal Operations Managers – Analyze department performance and lawyer productivity.
💼 Legal Consultants – Track client engagements and project performance.
📈 Business Owners & Executives – Gain clear insights into legal costs and operational risks.
🎓 Law Students & Researchers – Analyze legal operations using structured datasets.
Organizations that adopt a structured legal analytics system can significantly improve case management, cost control, and client satisfaction.
### Click hare to read the Detailed blog post
Watch the step-by-step video tutorial: