


In today’s digital workplace, IT support plays a vital role in ensuring seamless business operations and employee productivity. Managing support tickets effectively can be challenging without a centralized system to track resolution times, technician workloads, and issue trends. The IT Support Ticket Dashboard in Power BI is a ready-to-use, interactive solution designed to help IT managers and support teams streamline operations, monitor performance, and enhance service quality.
This dashboard consolidates all ticket data into visually engaging reports and interactive charts, enabling data-driven decisions that reduce downtime, improve technician efficiency, and increase user satisfaction.
✨ Key Features of the IT Support Ticket Dashboard
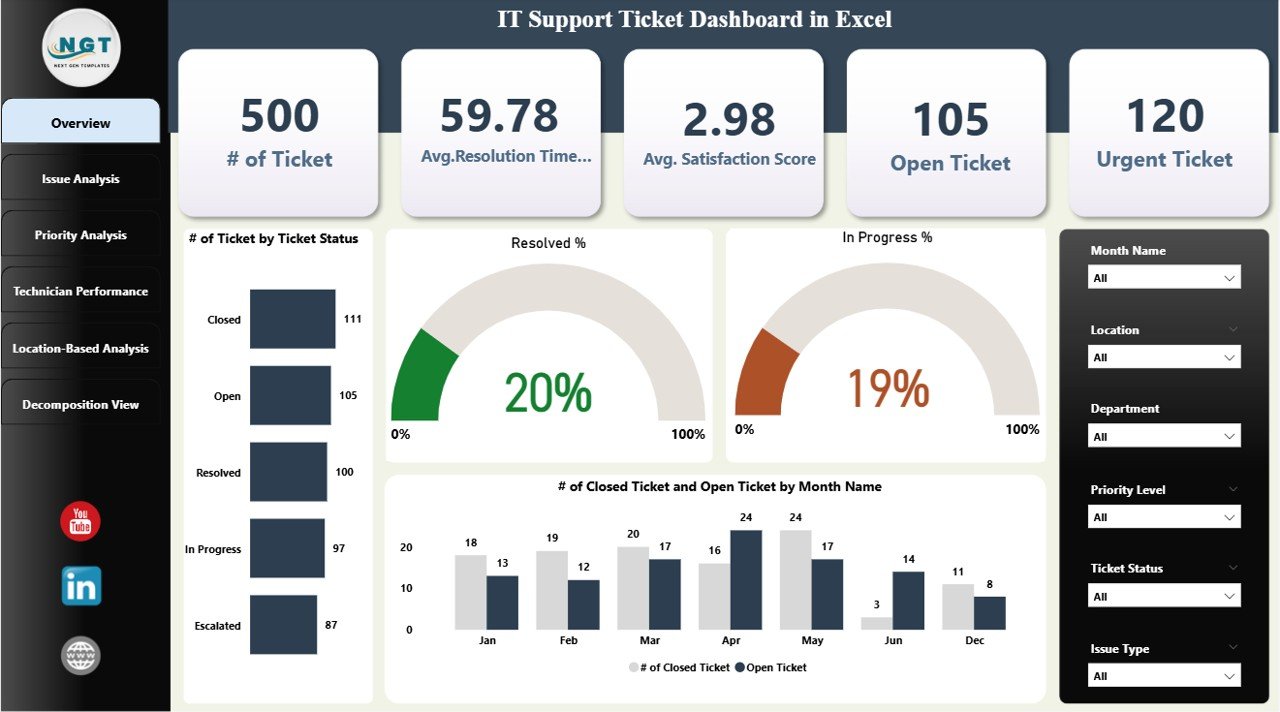
1. Overview Page
Gain a high-level summary of IT support activities.
-
Cards: Number of Tickets, Avg. Resolution Time, Avg. Satisfaction Score, Open Tickets, Urgent Tickets.
-
Charts: Tickets by Status (Open, In Progress, Closed), Resolved %, In Progress %, and Monthly Ticket Trends.
This page helps IT leaders quickly identify system health and potential bottlenecks.
2. Issue Analysis Page
Understand the types of issues being reported.
-
Satisfaction scores by issue type
-
Resolution rate (%) by issue type
-
Open and urgent tickets by category
This ensures recurring or critical issues are addressed effectively.
3. Priority Analysis Page
Track tickets based on urgency.
-
Ticket count by priority level (High, Medium, Low)
-
Avg. Satisfaction Score by priority
-
In-progress vs closed tickets by priority
Helps IT teams prioritize urgent issues for faster resolution.
4. Technician Performance Page
Monitor workload and efficiency of IT staff.
-
Resolution rates by technician
-
Ticket volume assigned to each technician
-
In-progress tickets by staff
This allows managers to recognize high performers and balance workloads.
5. Location-Based Analysis Page
Evaluate IT support performance across offices or departments.
-
Ticket volume by location
-
Avg. Satisfaction Score by location
-
Open and urgent tickets by site
This ensures consistent IT support across multiple locations.
6. Decomposition View Page
Drill down into tickets for root-cause analysis.
-
Interactive decomposition tree to analyze tickets by Issue Type, Priority, Technician, or Location
Helps uncover hidden trends and systemic issues.
📦 What’s Included
-
A fully functional Power BI .pbix dashboard file
-
Pre-built Overview, Analysis, and Performance pages
-
Sample dataset for quick demo testing
-
Structured data model ready for integration with your ITSM system
⚙️ How to Use
-
Open in Power BI Desktop and load the .pbix file.
-
Input your IT ticket data or connect to your ITSM tool (e.g., Jira, ServiceNow).
-
Explore insights using interactive filters and drill-downs.
-
Share with stakeholders via Power BI Service.
-
Customize metrics and visuals as per organizational goals.
👥 Who Can Benefit
-
IT Managers – Monitor performance and SLA compliance.
-
Support Teams – Track workload and prioritize urgent issues.
-
Business Leaders – Gain insights into IT’s contribution to operational efficiency.
-
Multi-location Enterprises – Compare support performance across offices.
✅ Advantages
-
Centralized, real-time ticket analysis
-
Tracks resolution time, satisfaction, and workloads
-
Improves prioritization of urgent issues
-
Helps balance technician workloads
-
Supports proactive decision-making
🚀 Opportunities for Improvement
-
Integrate with Jira, ServiceNow, or Zendesk for real-time ticket syncing
-
Add SLA compliance metrics for performance benchmarking
-
Use forecasting to predict peak ticket volumes
-
Incorporate AI sentiment analysis for richer feedback insights
🏆 Best Practices
-
Update ticket data regularly
-
Monitor technician workload weekly
-
Review issue and priority trends monthly
-
Use decomposition view for root-cause analysis
📌 Conclusion
The IT Support Ticket Dashboard in Power BI is a powerful tool for organizations seeking to optimize IT support operations. By providing real-time insights into ticket trends, technician performance, and resolution efficiency, it empowers managers to make smarter decisions, enhance user satisfaction, and ensure smoother business continuity.
📌 Click here to read the detailed blog post
Watch the step-by-step video Demo:


Reviews
There are no reviews yet.