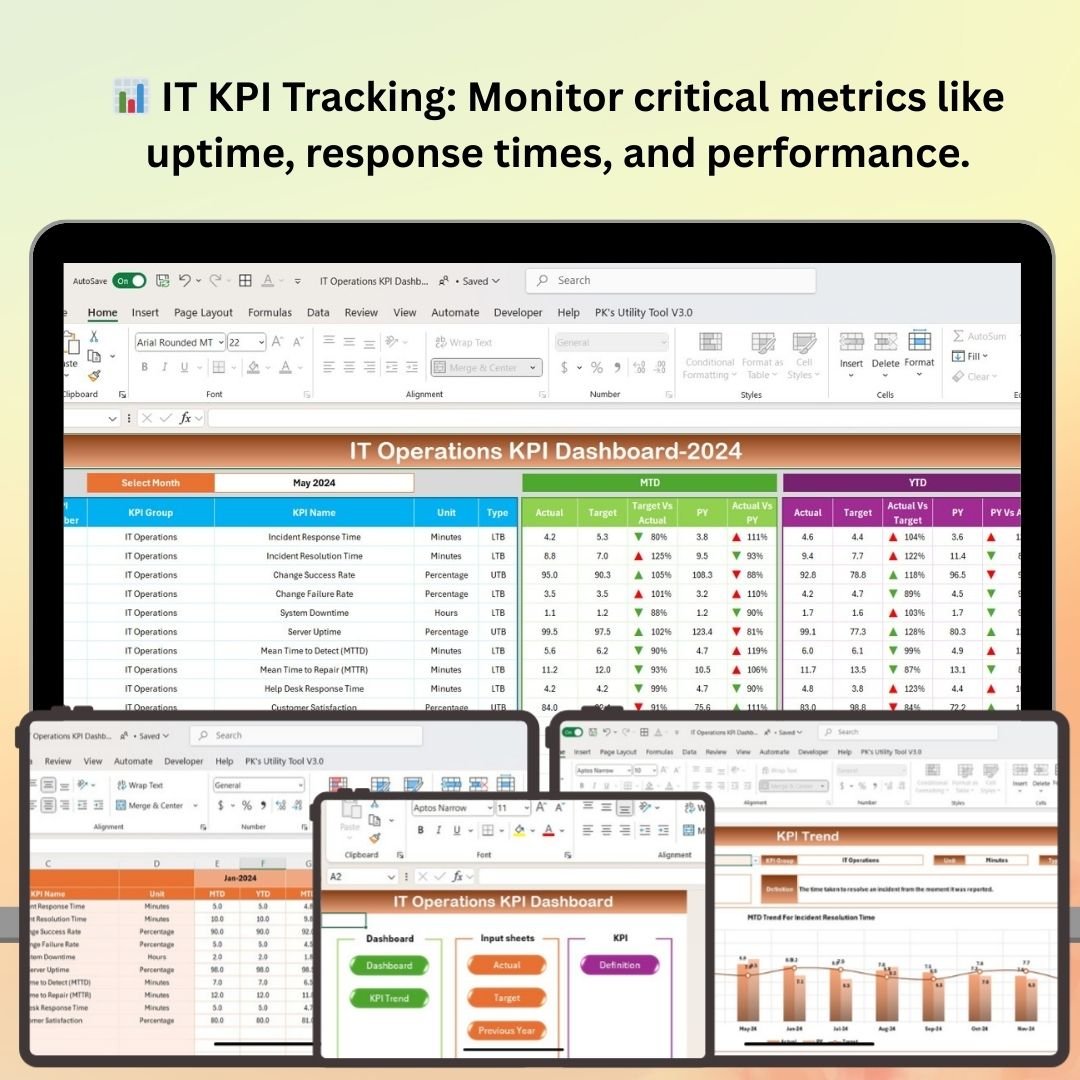
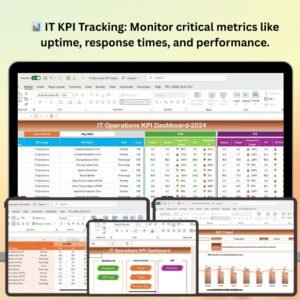
The IT Operations KPI Dashboard in Excel is an essential tool for IT managers, operations teams, and business owners looking to efficiently track and optimize their IT operations. This Excel-based dashboard helps you monitor key performance indicators (KPIs) related to IT infrastructure, network performance, service uptime, incident resolution, and more. By consolidating all essential IT metrics in one place, it provides a comprehensive overview of your IT environment, helping you ensure smooth operations and prevent costly downtime.
This KPI dashboard simplifies the monitoring of critical IT functions, allowing you to track system health, performance trends, and service disruptions in real-time. The user-friendly interface ensures that all team members can easily access and interpret data, making it a valuable resource for managing day-to-day IT operations.
Key Features of the IT Operations KPI Dashboard in Excel
📊 Comprehensive IT KPI Tracking
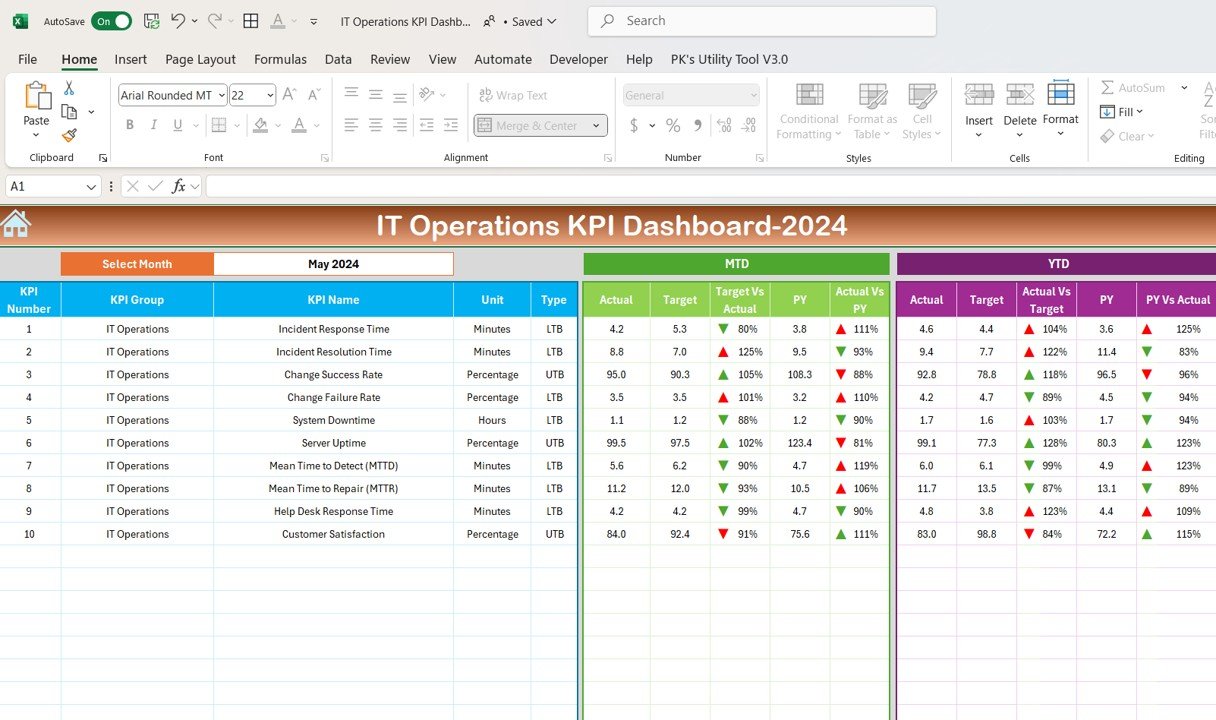
Monitor key IT metrics such as system uptime, response times, incident resolution rates, and network performance. Ensure that all critical IT functions are performing as expected.
⏱ Incident Response Time Tracking
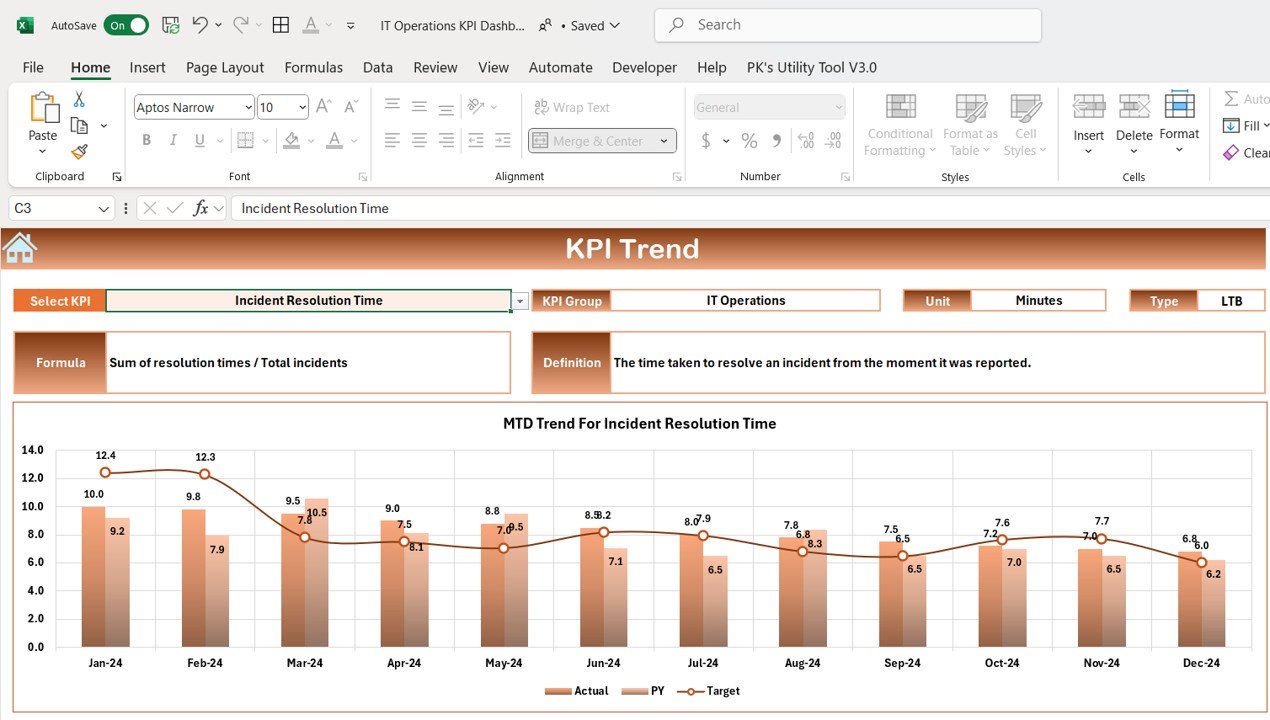
Track the time it takes to respond to and resolve incidents. Analyze performance against set response time targets to identify areas for improvement in your IT operations.
📈 Network Performance Monitoring
Monitor network performance metrics such as bandwidth usage, packet loss, and latency to ensure optimal network health and performance.
📅 System Uptime & Downtime Monitoring
Track system uptime and downtime to ensure your IT infrastructure remains available and responsive. Visualize trends and take action to minimize downtime.
⚙️ Service Availability Tracking
Monitor the availability of critical IT services, ensuring that key systems are accessible and functioning as expected. Track service disruptions and plan for improvements.
🔑 Real-Time Data Integration
Integrate data from various IT monitoring tools and systems to get real-time insights into your IT operations. Use this data to make proactive decisions and prevent issues before they arise.
Why You’ll Love the IT Operations KPI Dashboard in Excel
✅ Centralized Monitoring of IT Metrics
Track all IT operations in one easy-to-use dashboard. From network performance to incident response, monitor your entire IT environment with a few clicks.
✅ Improve IT Efficiency
Analyze incident response times, network performance, and system uptime to identify bottlenecks and optimize IT processes. Minimize downtime and improve efficiency across the board.
✅ Proactive Issue Resolution
By tracking real-time data and performance trends, you can identify potential issues before they disrupt operations. This helps your team stay ahead of potential IT challenges.
✅ Data-Driven IT Decisions
Leverage the insights from the dashboard to make informed decisions that improve your IT infrastructure, reduce downtime, and enhance service delivery.
✅ Customizable & Scalable
The dashboard is fully customizable to suit your organization’s unique IT monitoring needs. Whether you’re tracking performance for a small IT environment or a large-scale enterprise, this dashboard can scale accordingly.
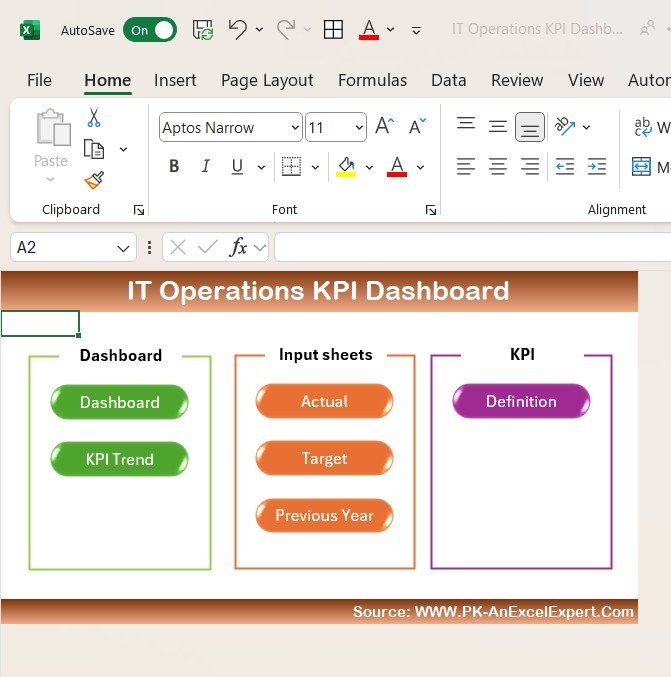
What’s Inside the IT Operations KPI Dashboard in Excel?
-
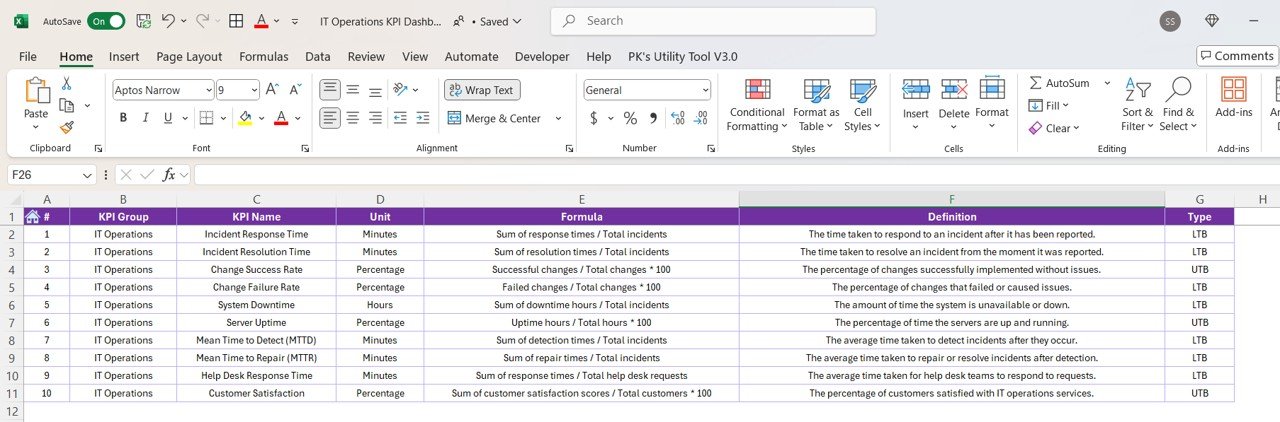
Comprehensive IT KPI Tracking: Monitor system uptime, network performance, incident resolution, and more.
-
Incident Response Time Tracking: Track the time taken to respond to and resolve incidents.
-
Network Performance Monitoring: Measure key network metrics such as latency, bandwidth, and packet loss.
-
System Uptime & Downtime Monitoring: Track availability and performance of IT systems.
-
Service Availability: Monitor critical service uptime and identify disruptions.
-
Real-Time Data Integration: Integrate data from IT monitoring tools for up-to-date analysis.
How to Use the IT Operations KPI Dashboard in Excel
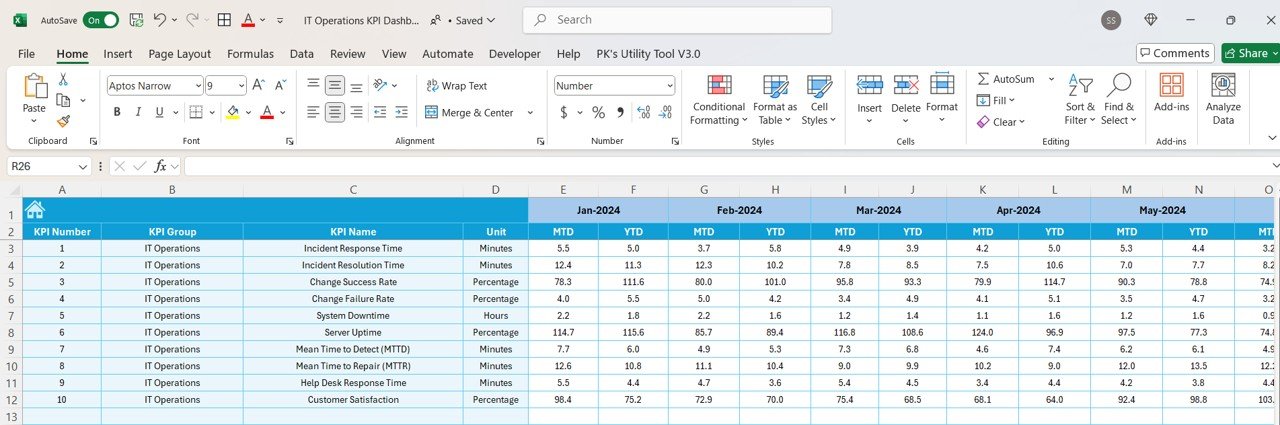
1️⃣ Download the Template: Instantly access the IT Operations KPI Dashboard in Excel.
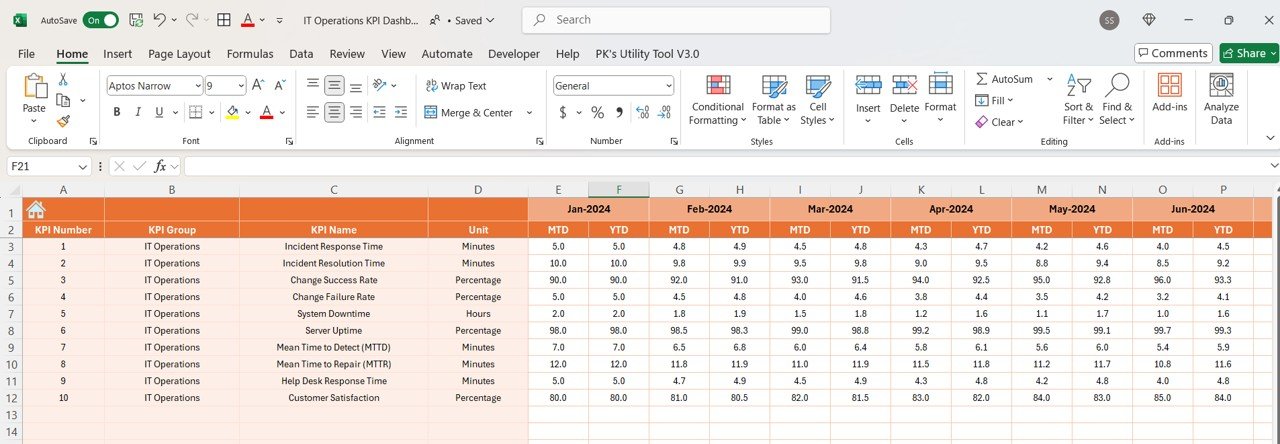
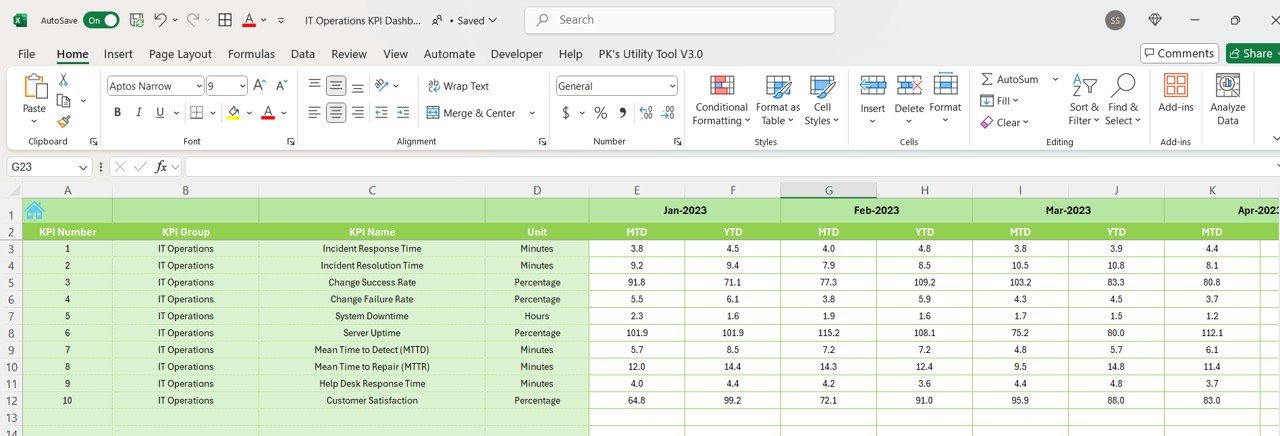
2️⃣ Input IT Performance Data: Add system uptime, network performance, and incident response data.
3️⃣ Monitor KPIs & Performance: Track key metrics such as response times, system uptime, and network health.
4️⃣ Analyze Trends & Data: Use time-based analysis to identify trends in your IT performance.
5️⃣ Make Data-Driven Decisions: Use the insights from the dashboard to optimize your IT operations and reduce downtime.
Who Can Benefit from the IT Operations KPI Dashboard in Excel?
🔹 IT Managers & Operations Teams
🔹 Network Administrators
🔹 System Administrators
🔹 IT Support & Helpdesk Teams
🔹 Business Owners & IT Executives
🔹 Large Enterprises & SMBs with IT Infrastructure
🔹 Technology & Data-Driven Companies
Ensure your IT operations run smoothly with the IT Operations KPI Dashboard in Excel. Monitor performance, identify issues, and optimize processes to enhance your organization’s IT infrastructure.
Click here to read the Detailed blog post
Visit our YouTube channel to learn step-by-step video tutorials
Youtube.com/@PKAnExcelExpert


Reviews
There are no reviews yet.