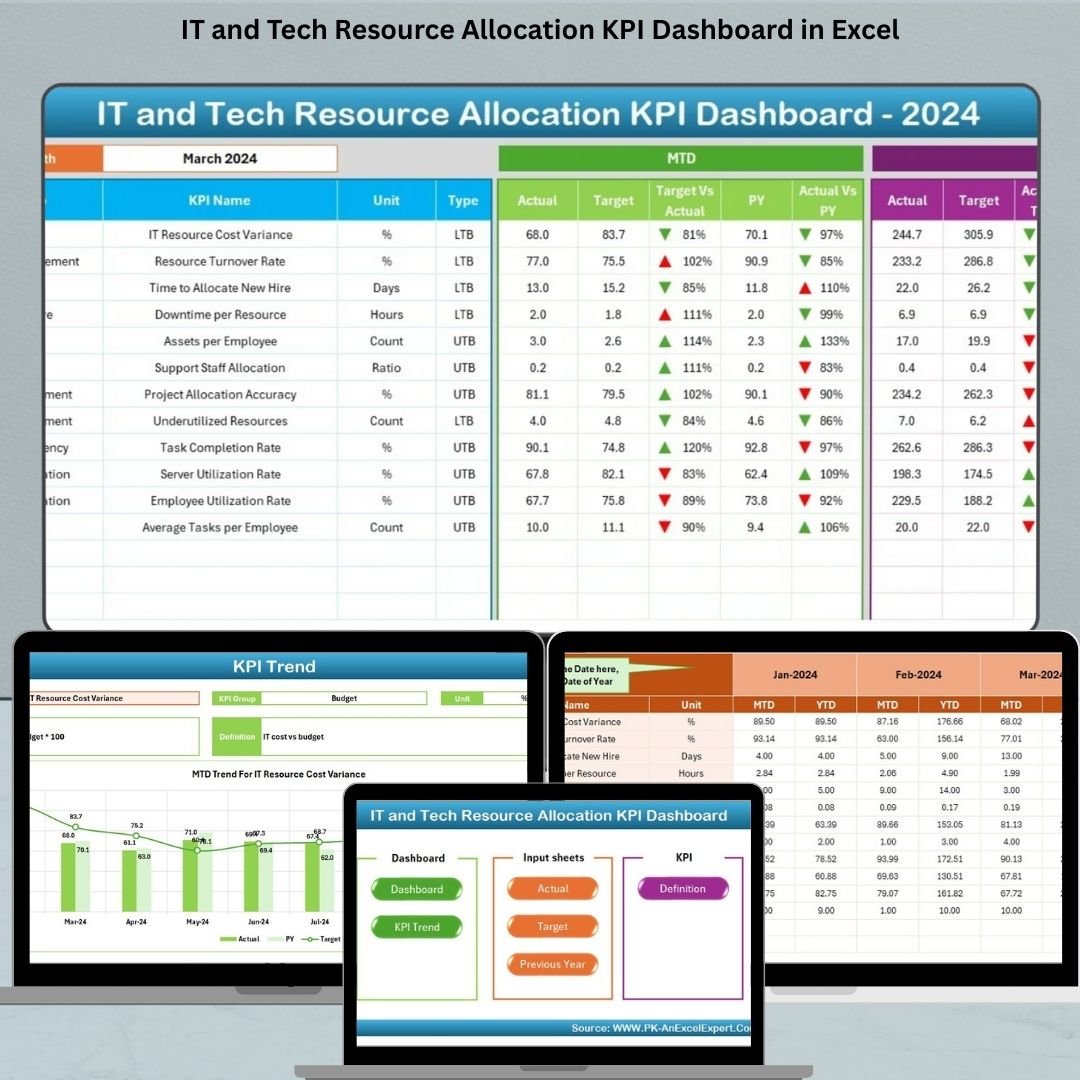


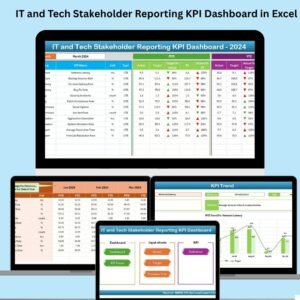
Efficient resource allocation is key to successful IT operations. From tracking project utilization to system uptime and bug resolution, IT leaders need a centralized tool that offers actionable insights. That’s where the IT and Tech Resource Allocation KPI Dashboard in Excel makes all the difference.
This interactive and fully automated Excel dashboard helps IT managers, project leads, and resource planners monitor their KPIs in real-time. With Month-To-Date (MTD), Year-To-Date (YTD), and Previous Year comparisons, you’ll gain instant clarity on performance and productivity—without needing Power BI or complex tools.
✨ Key Features of IT and Tech Resource Allocation KPI Dashboard
🏠 Home Sheet – One-Click Navigation

Easily access all sheets via 6 smart buttons that jump to:
-
Dashboard
-
KPI Trends
-
Actuals Input
-
Targets
-
Previous Year Data
-
KPI Definitions
No manual scrolling—navigate like a pro!
📊 Dashboard Sheet – Complete KPI Snapshot
Track every KPI in one visual interface:
-
Dropdown to select the month
-
Auto-updating KPI cards for MTD, YTD, and PY
-
✅ Up/down arrows show performance trends via conditional formatting
-
Target vs. Actual & YoY variance for each metric
Perfect for real-time updates and monthly reviews.
📈 KPI Trend Sheet – Dive Into Data Behavior
Select any KPI to analyze:
-
Group, Unit, Formula, and Type (UTB or LTB)
-
Two combo charts showing MTD and YTD comparisons across Actual, Target, and Previous Year
Great for strategic planning and identifying growth opportunities.
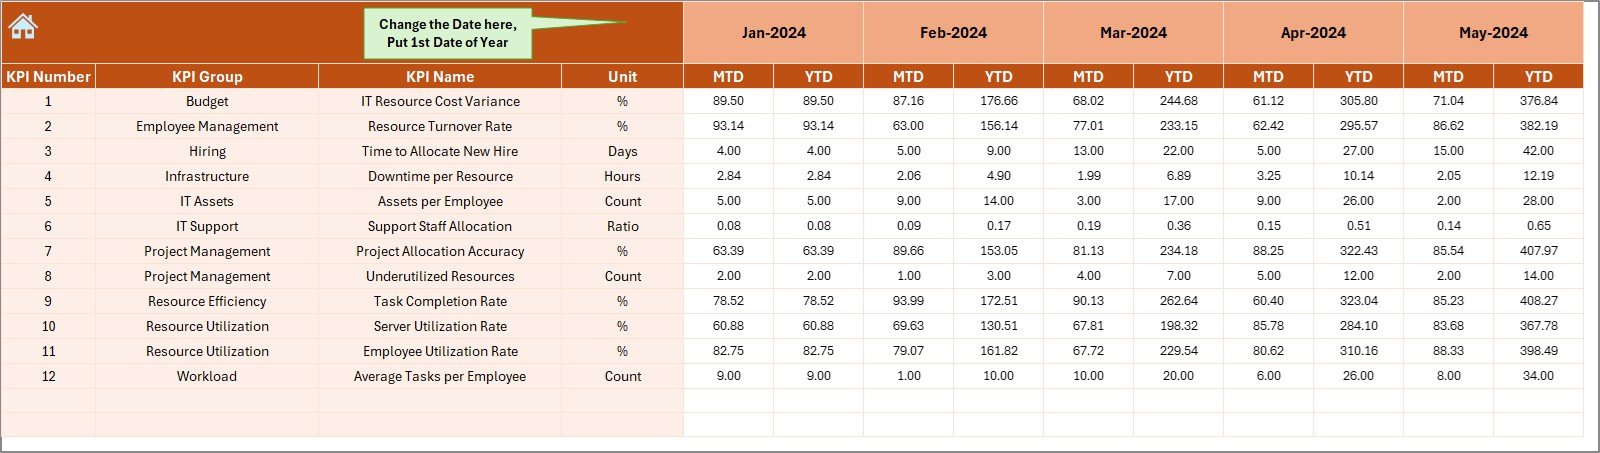
📥 Actual Numbers Input Sheet
Enter monthly actual data with ease:
-
MTD and YTD fields
-
Change the fiscal start month via cell E1
-
Built-in validations to ensure clean data
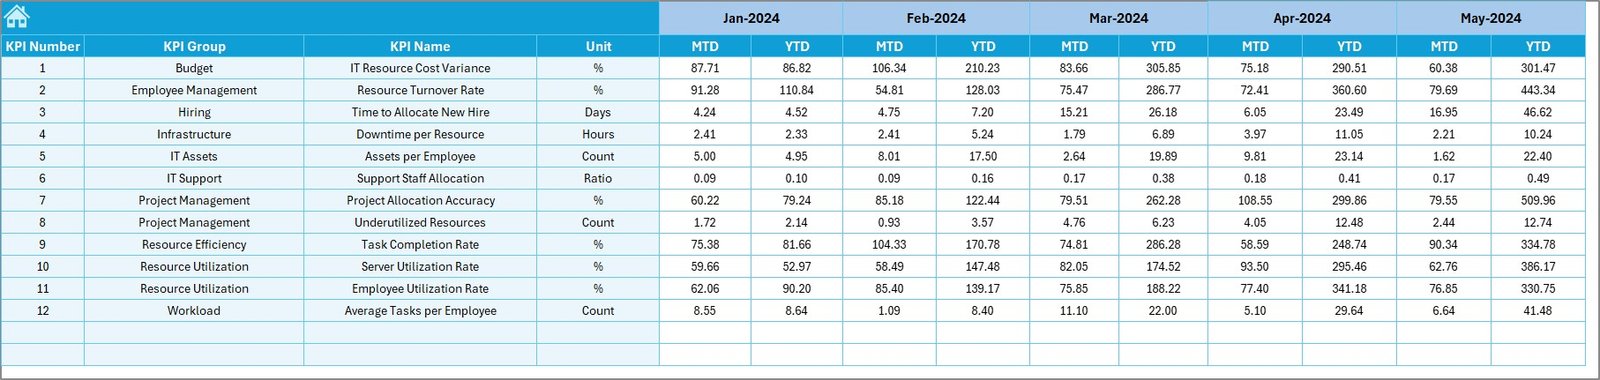
🎯 Target Sheet
Input monthly and cumulative targets for each KPI:
-
Used in visual and tabular comparisons
-
Helps evaluate gaps in resource performance
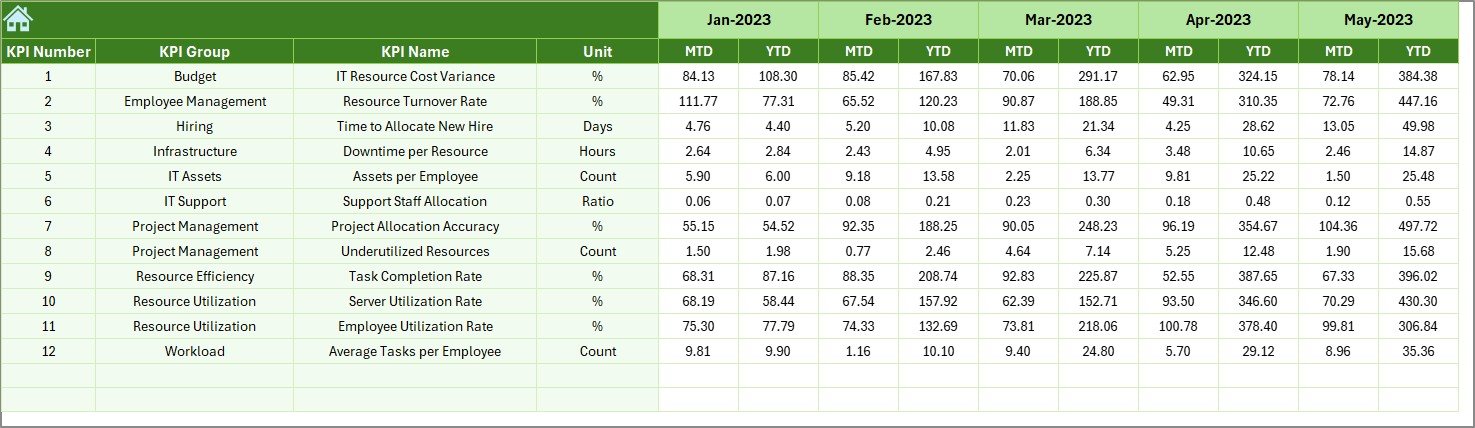
📘 Previous Year Numbers
Track last year’s performance for benchmarking:
-
MTD and YTD values
-
Enables meaningful year-over-year comparisons
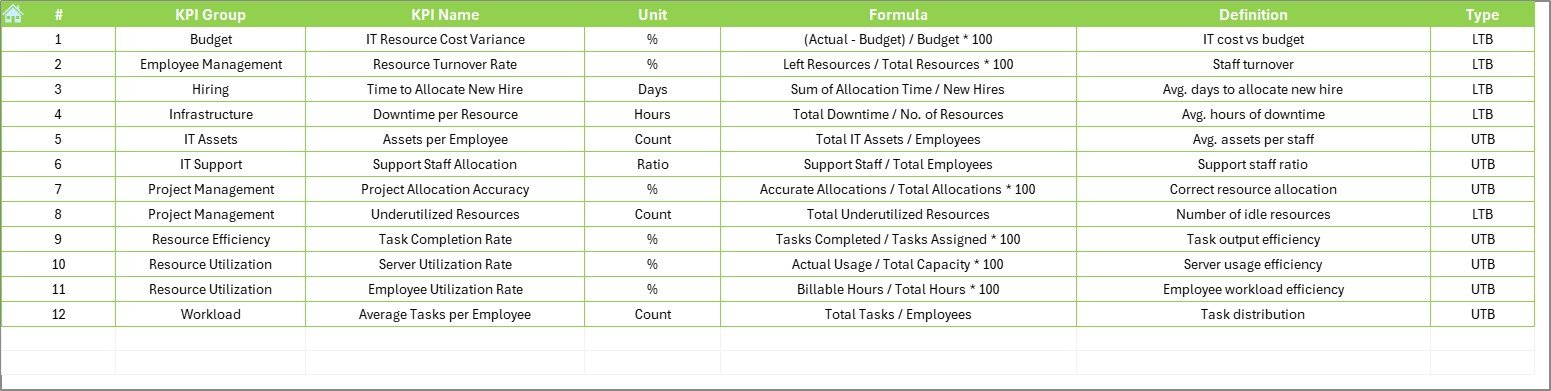
🗂️ KPI Definition Sheet
Clarifies every metric:
-
KPI Name, Group, Formula, Unit, and Description
-
Keeps the team aligned on KPI meaning and tracking logic
📦 What’s Inside the Excel Dashboard?
-
7 Linked Worksheets: Home, Dashboard, Trends, Actuals, Targets, PY Data, Definitions
-
MTD and YTD logic built-in
-
Up/down trend icons via conditional formatting
-
Drop-down selectors for filtering
-
Easy customization—no advanced Excel skills required
-
Full compatibility with Excel 2013 and newer
🛠 How to Use the Dashboard
-
Define Your KPIs
Use the KPI Definition Sheet to list your metrics, formulas, and classifications (UTB/LTB). -
Enter Actual & Target Data
Add monthly figures in the Input and Target Sheets. Change the fiscal year start in one click. -
Analyze the Dashboard
Head to the Dashboard tab and select your month. Instantly view gaps and wins. -
Explore KPI Trends
Use the Trends sheet to analyze historical patterns and growth areas. -
Update Monthly
Refresh with each reporting cycle for ongoing performance management.
👥 Who Should Use This Dashboard?
✅ IT Managers – Track team utilization, downtime, and service metrics
✅ Project Leads – Monitor delivery timelines and efficiency
✅ Resource Planners – Align resources with business demand
✅ Tech Directors – Share meaningful reports with stakeholders
Also great for startups, SMBs, and large enterprises looking to cut costs and boost productivity.
📘 Click here to read the Detailed blog post
🎥 Visit our YouTube channel to learn step-by-step video tutorials


Reviews
There are no reviews yet.