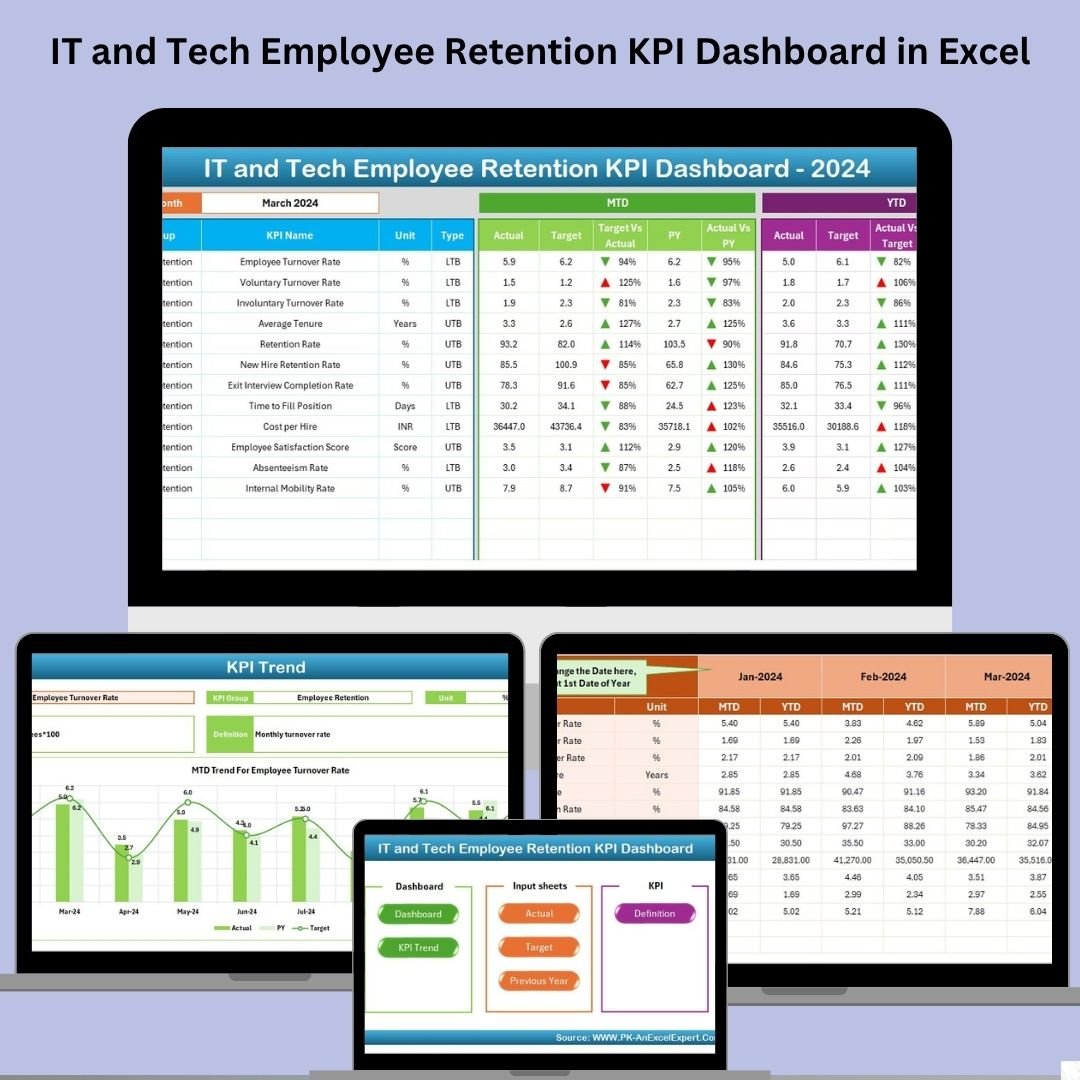


Retaining top tech talent is no longer just an HR function—it’s a business imperative. In today’s hyper-competitive IT environment, high turnover leads to missed project deadlines, inflated hiring costs, and a massive drain on team morale. That’s exactly why we created the IT and Tech Employee Retention KPI Dashboard in Excel—a smart, ready-to-use template designed to help you track and improve employee retention like never before. 💡📉
Whether you’re a startup, IT consultancy, or an enterprise tech firm, this dashboard gives you data-driven insights to prevent employee churn and build a stable workforce—all without the need for expensive HR software.
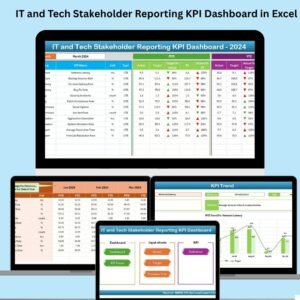
🔑 Key Features of the IT and Tech Employee Retention KPI Dashboard in Excel
🧭 Home Sheet Navigation
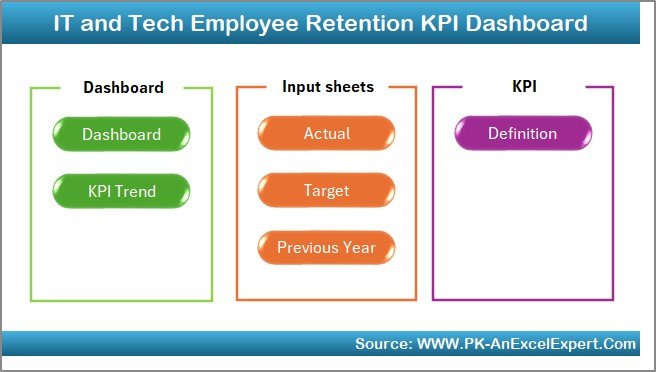
Acts as your command center with clickable buttons that instantly take you to key sheets like the Dashboard, Actual Data, Targets, Trends, and more. Even non-technical users can use it like a pro!
📈 Interactive Dashboard Page
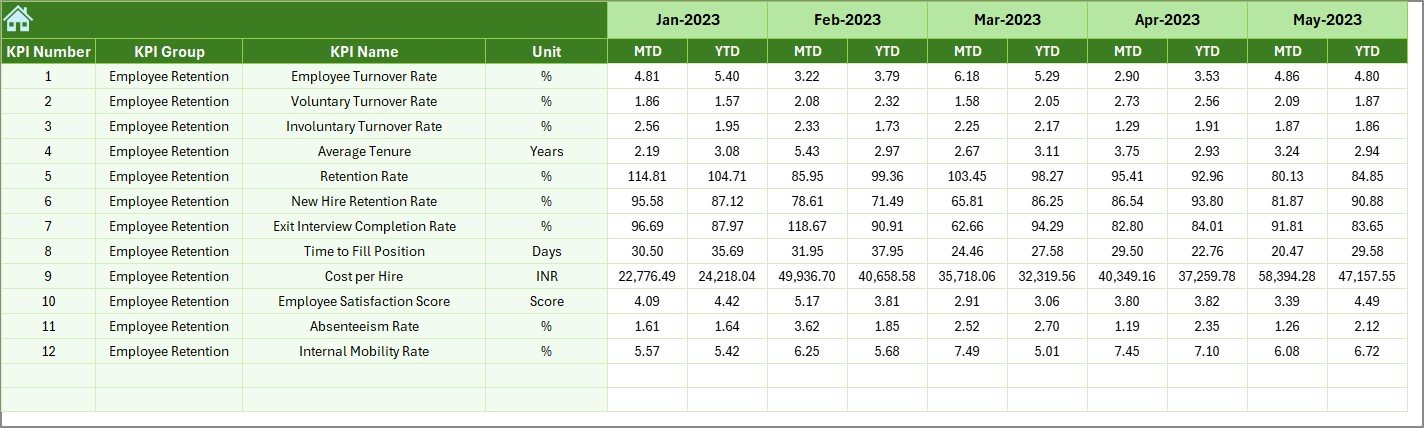
Monitor all your key metrics at a glance. With the Month Selector, you can view real-time MTD (Month-to-Date) and YTD (Year-to-Date) comparisons against targets and previous years.
✅ Arrows indicate whether you’re trending upward or need improvement.
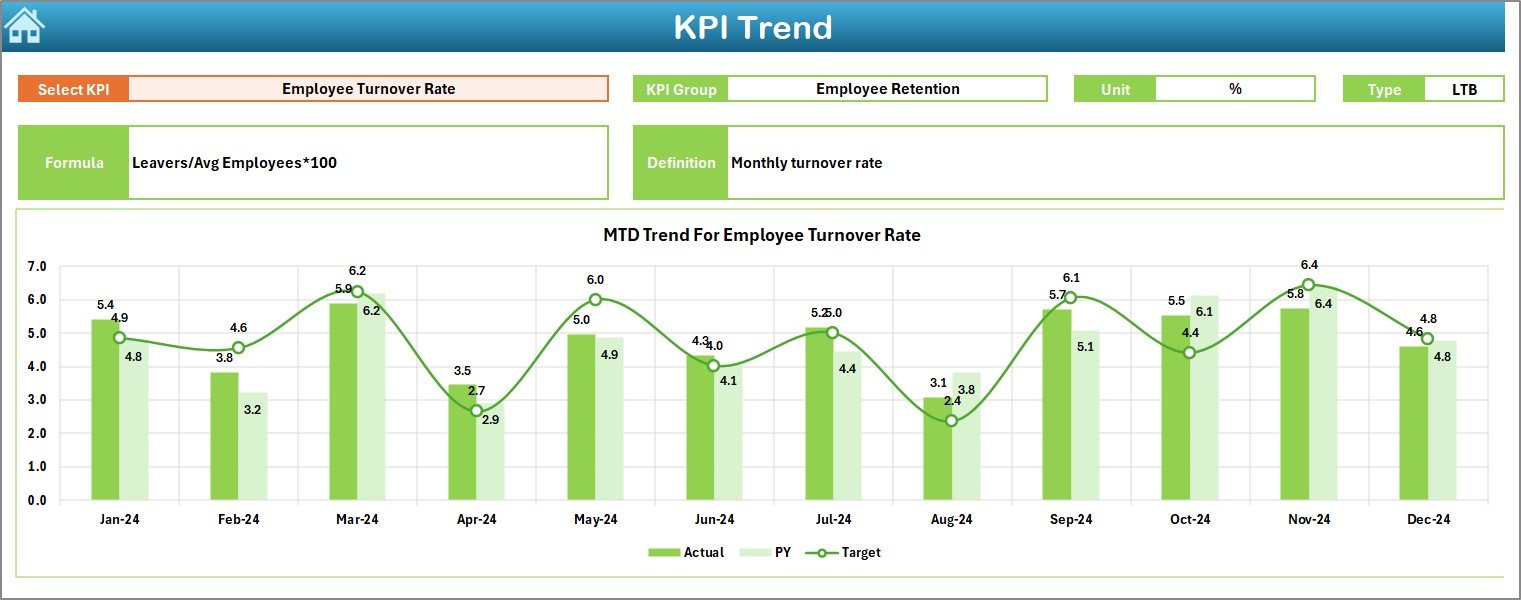
📊 KPI Trend Page
Pick any KPI from a drop-down menu and see dynamic charts for MTD, YTD, and historical data—all in one place. Plus, understand the KPI group, unit, and performance type (LTB or UTB).
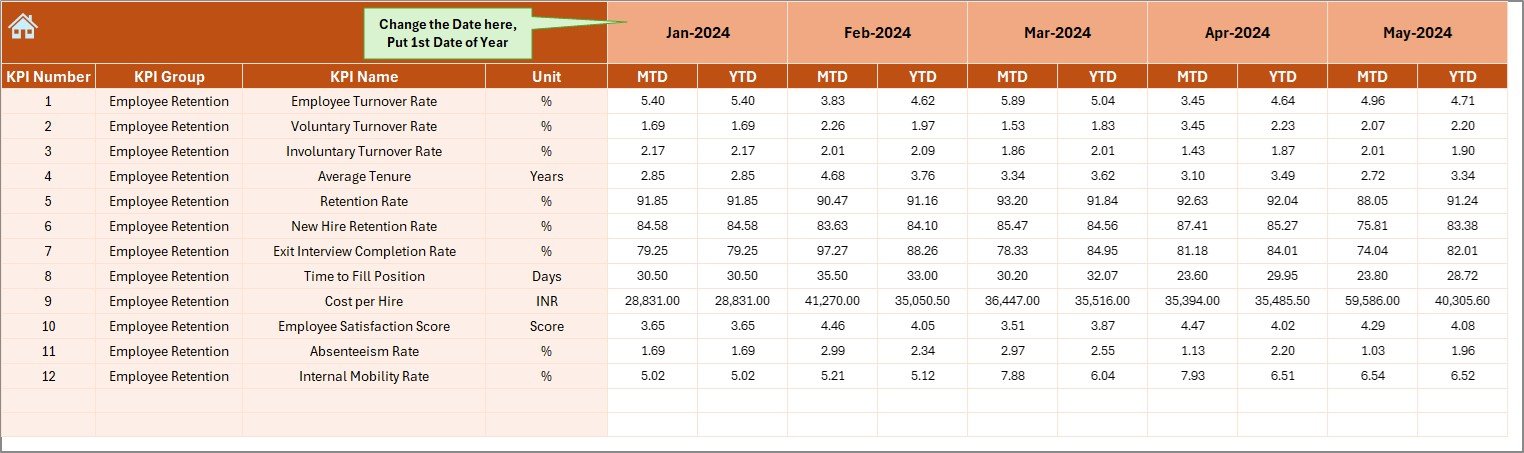
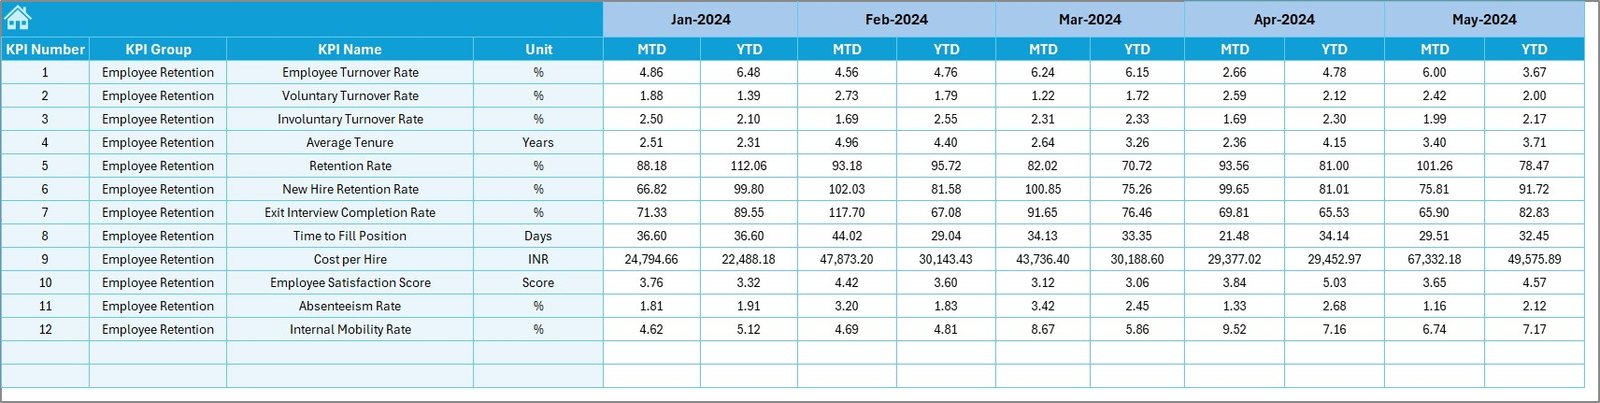
🗂 Actuals, Targets, and Historical Data
Three separate sheets to manage actuals, targets, and past-year numbers. Easily editable and built to support custom start months for any fiscal year.
📘 KPI Definition Sheet
Everything you need to understand your KPIs—definitions, formulas, measurement units, and classification (LTB or UTB)—ensuring full transparency and consistency across your organization.
📦 What’s Inside the Product
-
✅ Excel Dashboard File (.xlsx)
-
📊 7 Expertly Designed Worksheets
-
📅 Month Selector for dynamic performance views
-
📈 Conditional Formatting and Arrow Indicators
-
🔄 MTD/YTD Comparison with Previous Year Data
-
📘 KPI Library with Formula and Definitions
-
🧩 100% Customizable – Add new KPIs, visuals, branding
-
🔐 Easy to protect and share with stakeholders
-
📥 Download-and-go setup – No software or add-ins required
📌 How to Use the Product
-
✅ Open the Excel Dashboard file
-
🧾 Enter Actual KPIs in the ‘Actual Numbers’ sheet
-
🎯 Input monthly targets in the ‘Target’ sheet
-
🕰 Add Previous Year data in the respective tab
-
📅 Use the Month Selector to update visuals
-
📊 Track trends using the dynamic KPI Trend sheet
-
🧠 Refer to the KPI Definition tab for full understanding
👥 Who Can Benefit from This Dashboard?
🧑💼 HR Managers – Identify and fix retention gaps before they grow
📊 Business Analysts – Monitor turnover trends and visualize risks
👨💻 IT Team Leads – Keep track of role-specific attrition
🏢 Tech Startups – Manage retention without investing in HRMS software
🏗 Mid-Size & Enterprise IT Firms – Align workforce stability with project continuity
📣 Consultants – Deliver data-backed insights to clients
🎯 C-suite Executives – Make strategic, talent-focused decisions
🔗 Click here to read the Detailed blog post
🎥 Visit our YouTube channel to learn step-by-step video tutorials


Reviews
There are no reviews yet.