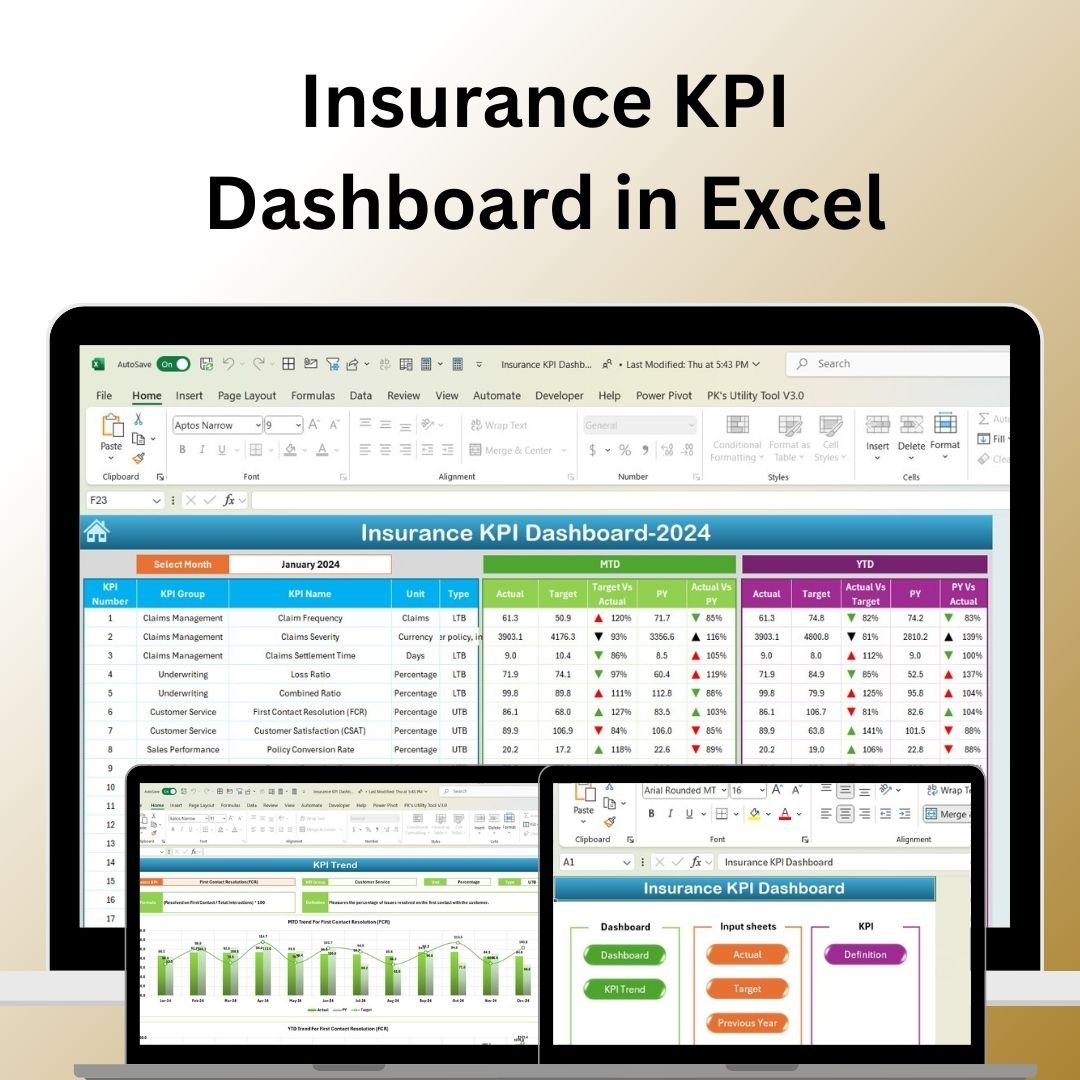


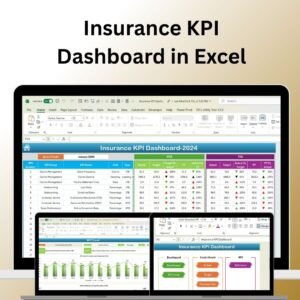
The Insurance KPI Dashboard in Excel is a powerful tool designed specifically for insurance companies, agencies, and agents to track, monitor, and optimize key performance indicators (KPIs). Whether you’re managing sales, underwriting, claims, or customer satisfaction, this dashboard provides a centralized view of your business’s performance.
With dynamic charts, real-time data updates, and customizable inputs, this Excel dashboard helps insurance professionals make informed, data-driven decisions to optimize operations, reduce risks, and enhance profitability. This tool is ideal for executives, managers, and agents looking to enhance their reporting, manage portfolios, and improve customer service and retention.
Key Features of the Insurance KPI Dashboard in Excel:
📊 Comprehensive KPI Tracking
Track essential KPIs such as policy sales, claim ratios, customer retention, profit margins, and underwriting efficiency—all in one dashboard.
📈 Real-Time Performance Monitoring
Monitor your insurance portfolio’s performance in real time, including sales, claims, customer satisfaction, and profitability metrics, ensuring that you stay on top of your operations.
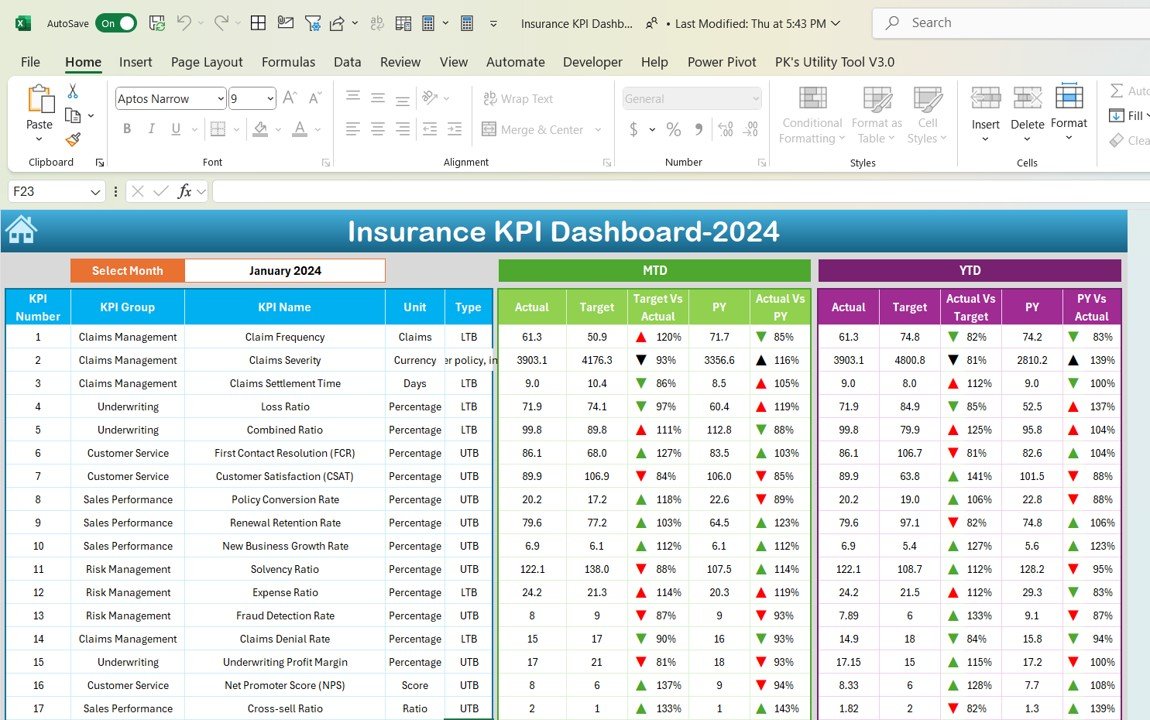
📅 Month-to-Date (MTD) and Year-to-Date (YTD) Analysis
Track and compare performance over time to identify trends, gaps, and opportunities for improvement.
🎯 Goal Setting and Performance Comparison
Set specific targets for each KPI and compare actual performance against these goals, ensuring that your insurance operations are aligned with your business objectives.
🛠 Customizable Inputs
Easily input data such as premiums, claims, and policy renewals, while customizing the dashboard to suit your company’s specific KPIs and needs.
🔔 Conditional Formatting Alerts
Get real-time alerts with color-coded indicators to quickly identify underperforming areas, such as low sales, high claim ratios, or missed retention goals.
💼 Client and Portfolio Insights
Gain insights into the performance of your clients and policies, helping you identify trends and make informed decisions about risk management, client retention, and portfolio growth.
🚀 Why You’ll Love the Insurance KPI Dashboard in Excel:
✅ Optimize Sales Performance – Track policy sales, conversion rates, and premium growth to ensure your sales team is meeting targets and driving revenue.
✅ Manage Claims Efficiently – Track claims ratios, adjuster performance, and claims processing times to improve claims management and reduce costs.
✅ Improve Customer Retention – Monitor customer retention rates, policy renewals, and satisfaction scores to reduce churn and increase lifetime value.
✅ Enhance Risk Management – Analyze underwriting efficiency and risk metrics to ensure that your insurance business is balanced and profitable.
✅ User-Friendly Interface – The dashboard is designed for ease of use, allowing insurance professionals to input data and track performance without technical expertise.
✅ Fully Customizable – Tailor the dashboard to your specific insurance needs, whether you’re focusing on individual policies, portfolios, or overall business operations.
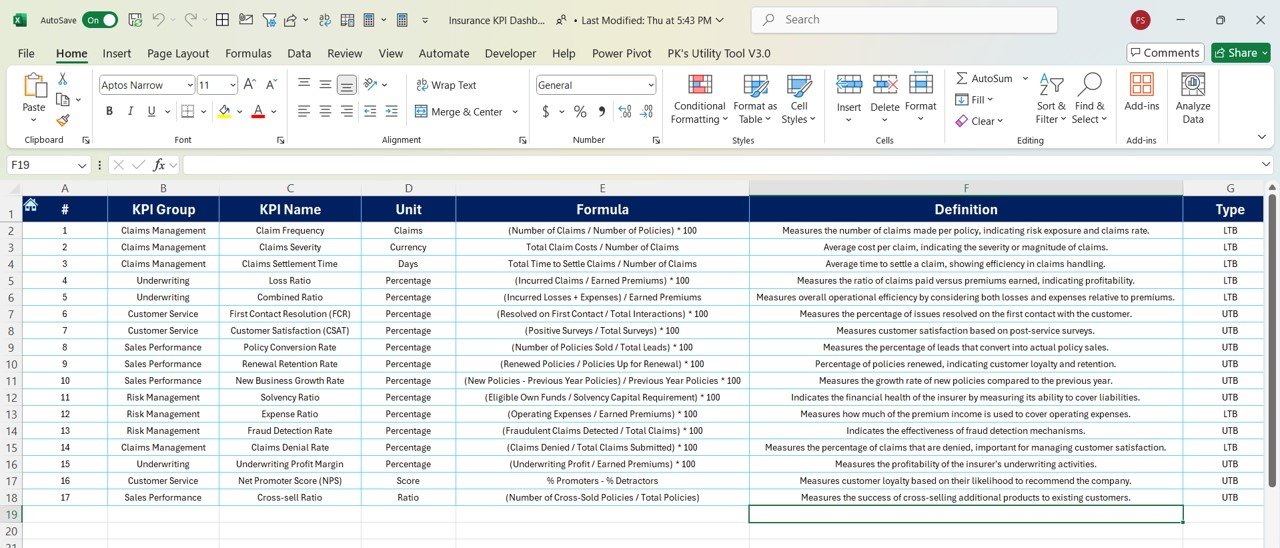
What’s Inside the Insurance KPI Dashboard in Excel:
- Policy Sales KPI: Track the number of new policies sold, total premiums, and sales by product type.
- Claim Ratio KPI: Monitor the ratio of claims to premiums to assess the profitability of your insurance portfolio.
- Customer Retention KPI: Measure the percentage of customers who renew their policies each year.
- Profitability KPI: Track net profit margins and underwriting profit to ensure that your insurance business is financially healthy.
- Sales Team Performance KPI: Monitor individual or team sales performance and compare against targets.
- Loss Ratio KPI: Track the ratio of claims paid out versus the premiums collected, helping to manage risk and profitability.
How to Use the Insurance KPI Dashboard in Excel:
1️⃣ Download the Template – Instantly access your Excel file upon purchase.
2️⃣ Input Your Data – Enter data such as sales, claims, renewals, and premiums into the provided fields.
3️⃣ Set Targets – Define specific KPIs for policy sales, claims, and customer retention to guide your team’s performance.
4️⃣ Track Performance – Monitor real-time performance across all KPIs and make informed decisions to improve your business.
5️⃣ Generate Reports – Use the dashboard to create performance reports for board meetings, client presentations, or internal reviews.
Who Can Benefit from the Insurance KPI Dashboard in Excel:
- Insurance Companies
- Insurance Agents and Brokers
- Sales Managers
- Underwriting Managers
- Claims Managers
- Risk Management Teams
- Business Owners
- Financial Analysts
The Insurance KPI Dashboard in Excel is the perfect solution for any insurance professional looking to streamline operations, track performance, and drive profitability.
Click here to read the Detailed blog post
https://www.pk-anexcelexpert.com/insurance-kpi-dashboard-in-excel/
Visit our YouTube channel to learn step-by-step video tutorials
Youtube.com/@PKAnExcelExpert


Reviews
There are no reviews yet.