
Insurance success depends on precision—and this dashboard delivers it. The Insurance Dashboard in Power BI is a ready-to-use, interactive analytics tool built to help insurers visualize KPIs like policy performance, claims status, premium collection, and sales agent productivity.
With real-time insights and dynamic visuals, this dashboard empowers teams to make faster, smarter decisions, reduce claim processing time, and enhance operational efficiency across regions, policy types, and customer segments.
📊 Key Features of the Insurance Dashboard in Power BI
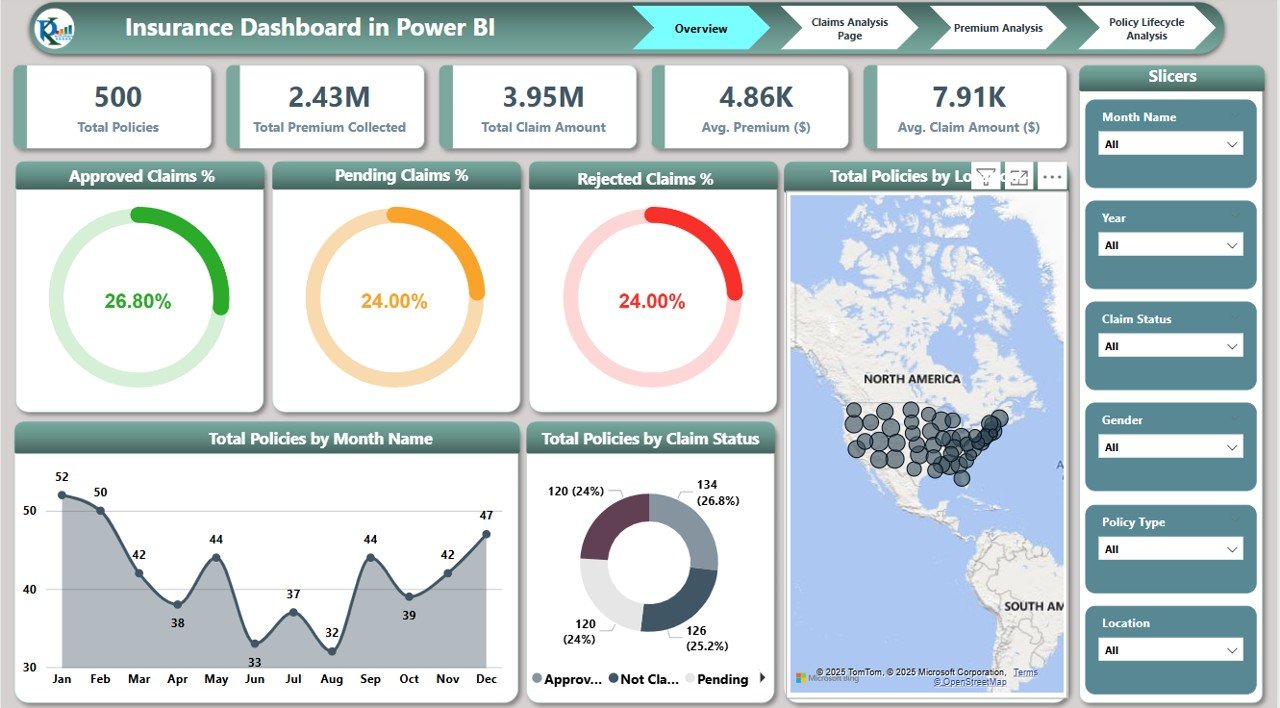
💡 Overview Page – One-Glance Insights
Get a snapshot of the business with dynamic cards and charts:
-
Total Policies
-
Total Premium Collected
-
Total Claim Amount
-
Avg. Premium ($)
-
Avg. Claim Amount ($)
Interactive charts include:
-
Approved, Pending & Rejected Claims %
-
Policies by Month
-
Policies by Claim Status
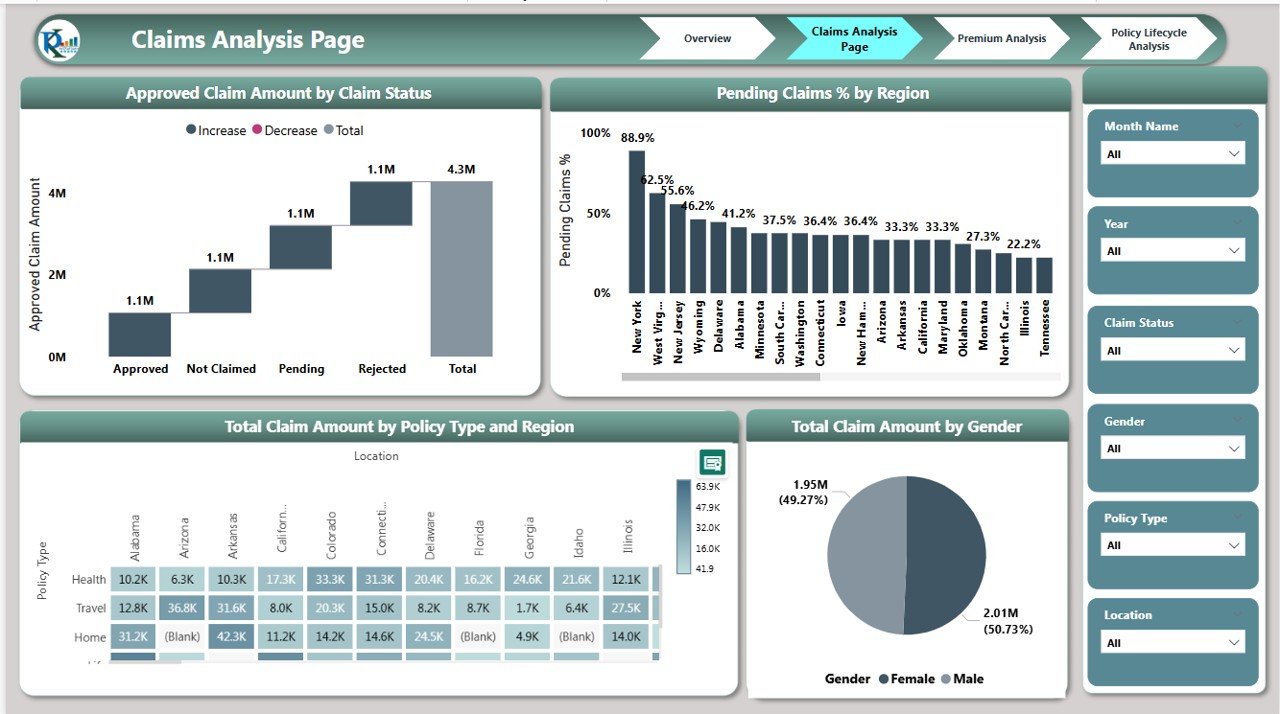
🔍 Claims Analysis Page
Drill into claim details:
-
Approved Claim Amount by Status
-
Pending Claims % by Region
-
Total Claims by Policy Type & Gender
-
Regional Breakdown of Claim Amounts
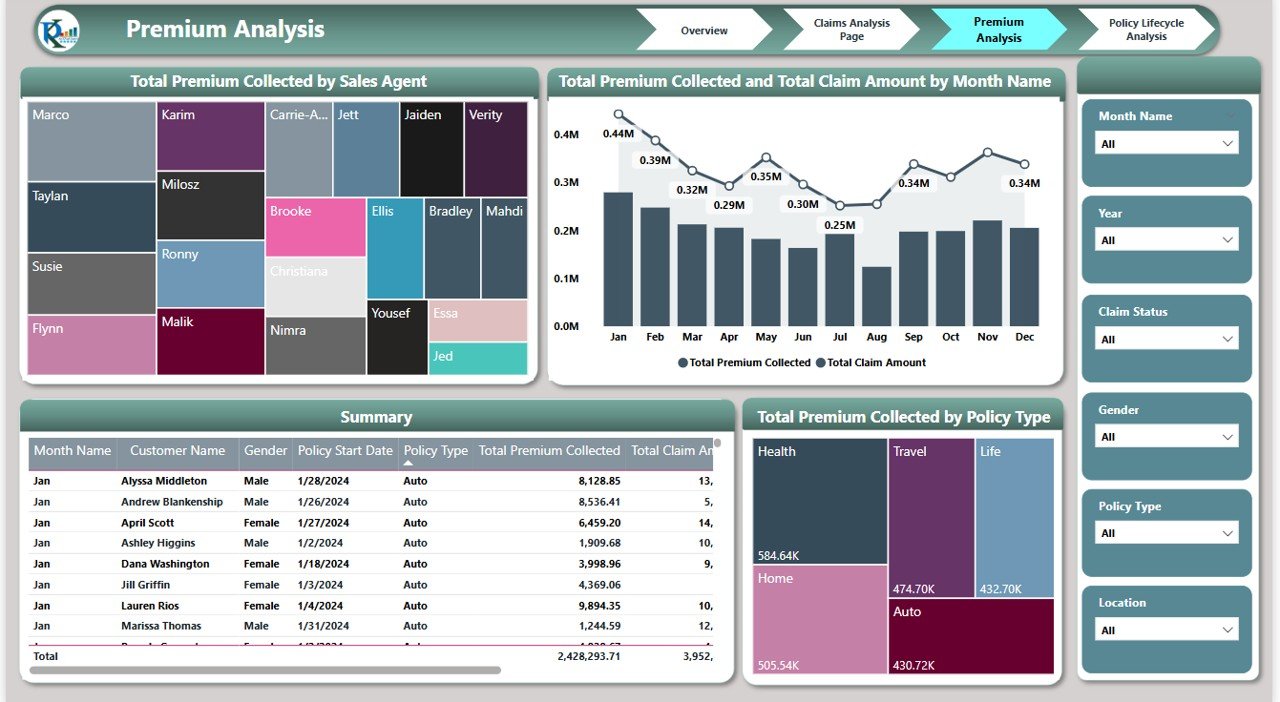
💰 Premium Analysis Page
Track financial flows:
-
Premium Collected by Agent
-
Premium vs Claims by Month
-
Premium Collection by Policy Type
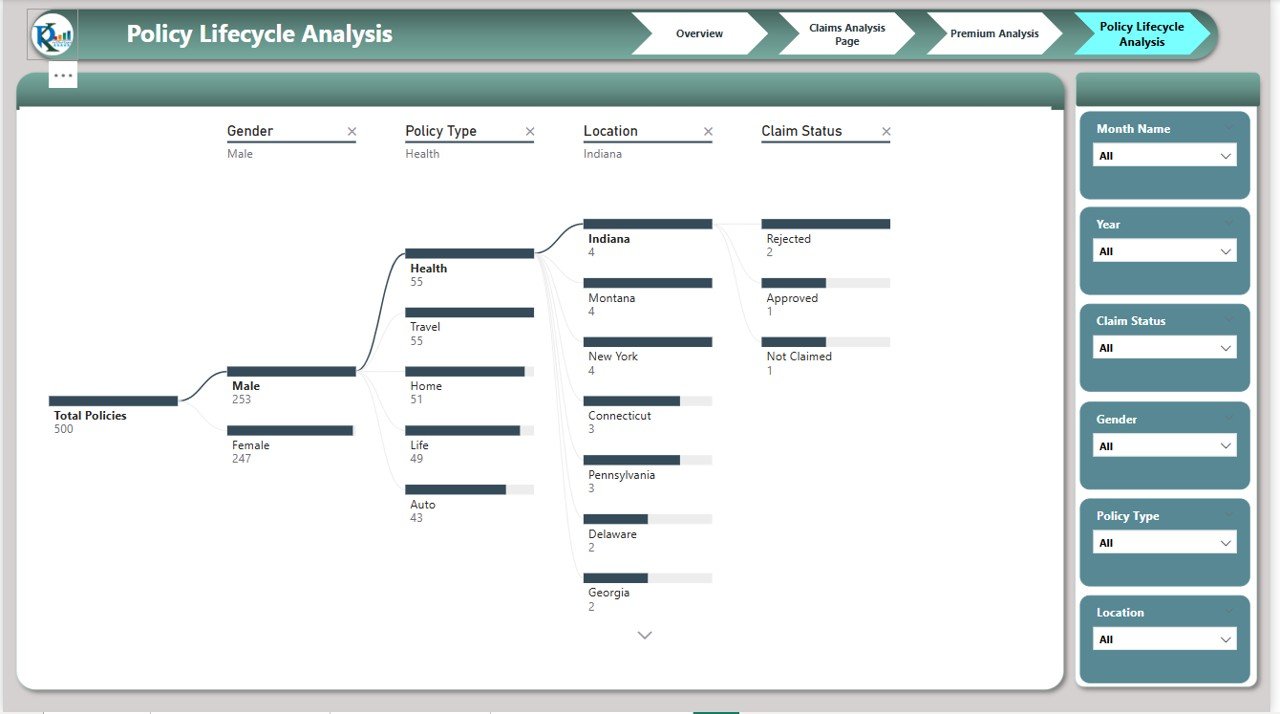
🌐 Policy Lifecycle Analysis Page
Visualize the entire policy journey with a Decomposition Tree:
-
Monitor active, expired, and canceled policies
-
Detect drop-offs and optimize lifecycle stages
📦 What’s Inside the Dashboard?
You get four powerful, fully interactive pages:
-
Overview – Cards & KPIs for instant performance insight
-
Claims Analysis – Status, type, region & gender visualizations
-
Premium Analysis – Financial flow trends and agent tracking
-
Policy Lifecycle – Decomposition tree for status breakdown
🎛️ All pages are equipped with slicers for dynamic filtering by:
-
Policy Type
-
Claim Status
-
Gender
-
Region
-
Month
-
Agent
📌 How to Use the Insurance Dashboard in Power BI
🗂️ Step 1: Connect your insurance dataset (Excel, SQL, CSV, etc.)
📊 Step 2: Explore overview metrics and policy trends
🔍 Step 3: Use slicers to analyze claims, premiums, and agents
📈 Step 4: Track policy lifecycles via decomposition tree
⚙️ Step 5: Customize charts and pages as needed for business KPIs
No code. No fuss. Just drag, filter, and explore.
👥 Who Should Use This Dashboard?
🏢 Insurance Managers – Monitor premium collection and policy growth
🧾 Claims Processing Teams – Identify delays, analyze outcomes
📈 Finance & Actuarial Analysts – Assess risk, payouts, and revenue
👨💼 Sales Directors & Team Leads – Track agent performance
🧑💻 Business Analysts – Provide real-time reporting and forecasting
✅ Why This Power BI Dashboard is a Game-Changer
✔ Real-Time Data Refresh
✔ Slicers for Multi-Dimensional Filtering
✔ Fully Customizable Layout & KPIs
✔ Clean Visuals for Stakeholder Reporting
✔ Designed for Business Users—No Tech Needed
✔ Actionable Insights for Decision-Making
From claim processing delays to regional premium performance—this dashboard helps you spot the issues, track the wins, and steer growth.
🔁 Click here to read the Detailed blog post
Click here to read the Detailed blog post


Reviews
There are no reviews yet.