

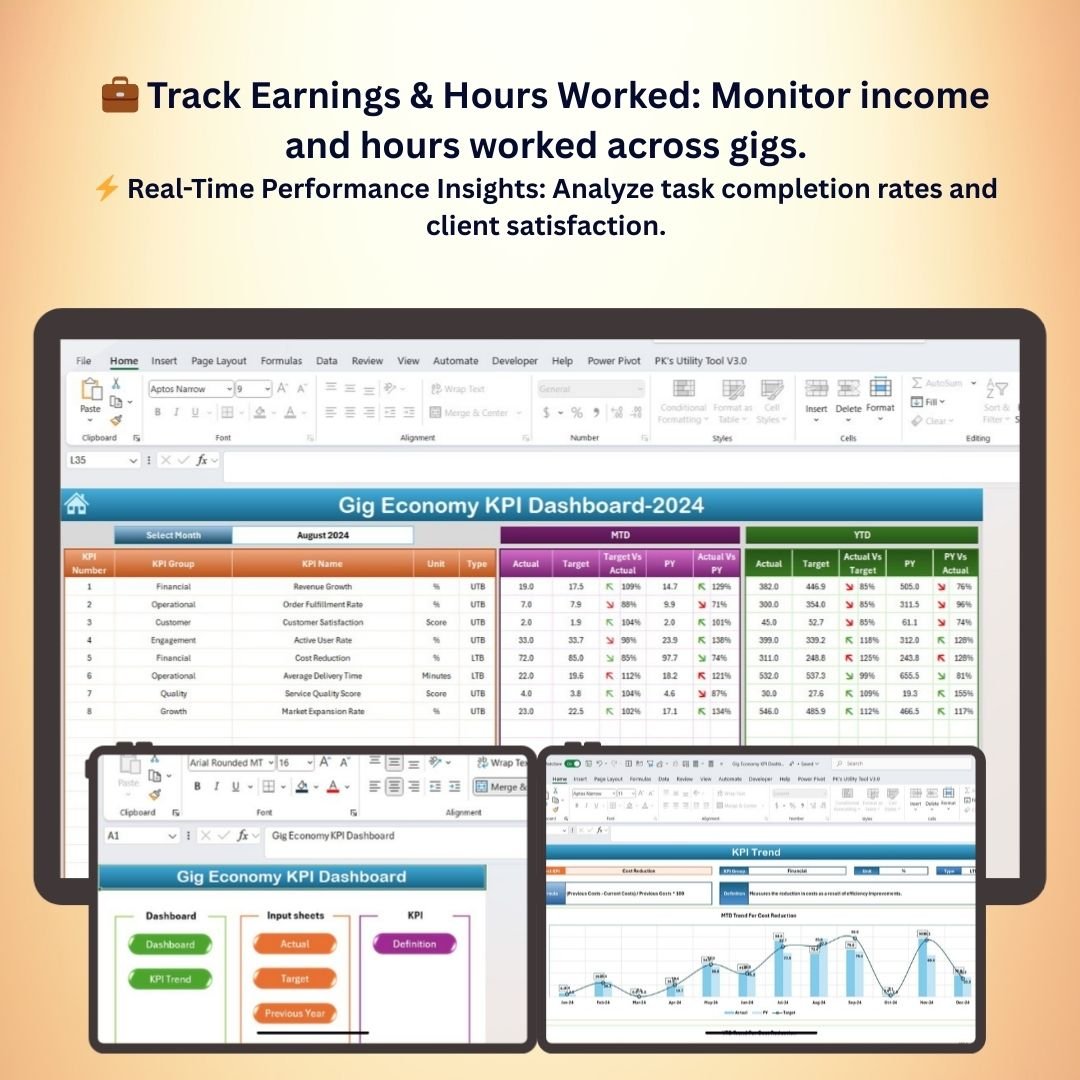
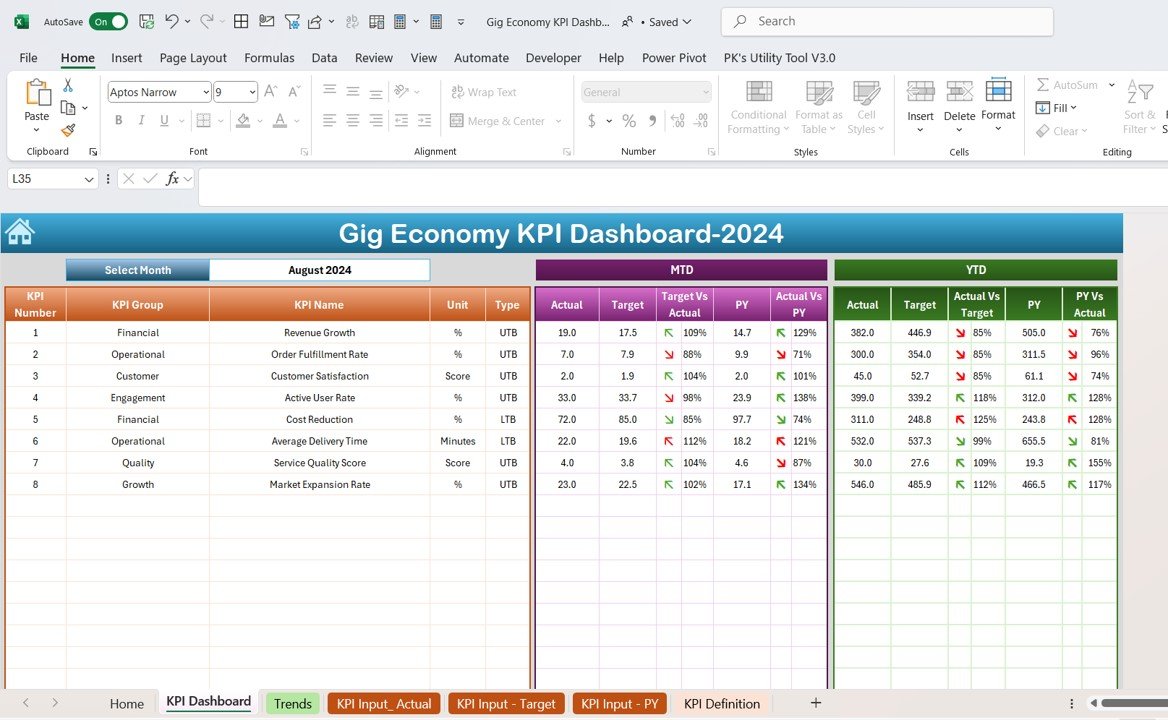


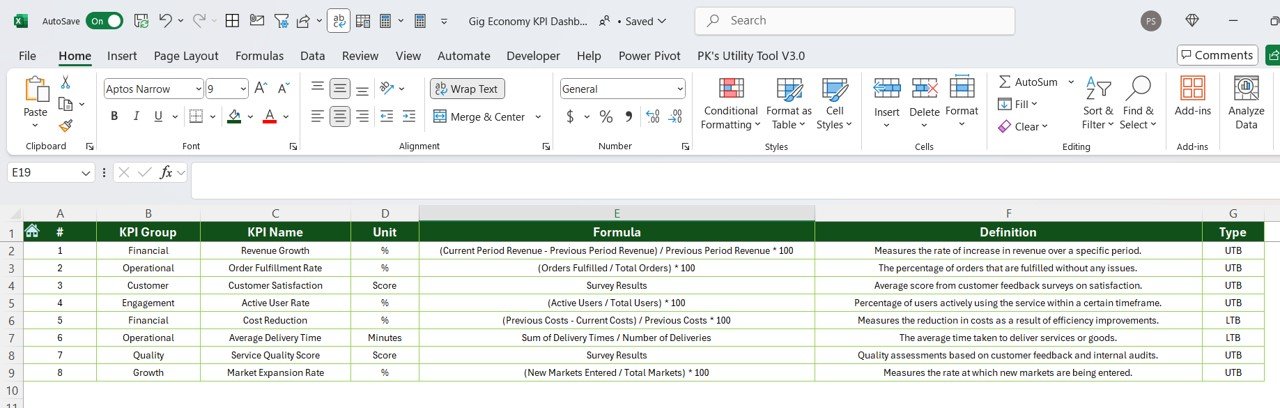

The Gig Economy KPI Dashboard in Excel is an essential tool designed for freelancers, gig workers, and businesses operating in the gig economy. This customizable dashboard allows you to track and analyze key performance indicators (KPIs) such as income, hours worked, task completion rates, client satisfaction, and payment status. With real-time data tracking and comprehensive reporting, this Excel-based dashboard helps you manage your gig work efficiently and make data-driven decisions to maximize your earnings and improve your overall productivity.
Whether you’re a freelancer juggling multiple projects, a gig economy platform managing contractors, or a business utilizing gig workers, the Gig Economy KPI Dashboard in Excel enables you to streamline operations and optimize your income, ensuring that you stay organized and focused on achieving your goals.
Key Features of the Gig Economy KPI Dashboard in Excel
💼 Comprehensive Gig Tracking
Track critical KPIs including earnings, hours worked, task completion rates, client feedback, and payment status. Get a complete view of your gig work and identify areas for improvement.
⚡ Real-Time Performance Monitoring
Monitor real-time performance metrics such as total income, hours worked, and client satisfaction. Stay on top of your gig work and optimize your workload to ensure maximum efficiency.
📈 Income & Task Performance Insights
Analyze earnings per task, total income per week or month, and task completion rates to identify which gigs are the most profitable and where you can improve your performance.
📅 Client & Feedback Monitoring
Track client ratings, feedback, and satisfaction scores to ensure high-quality service delivery. Understand which clients provide the best opportunities for repeat work and referrals.
🖥️ Interactive & User-Friendly Interface
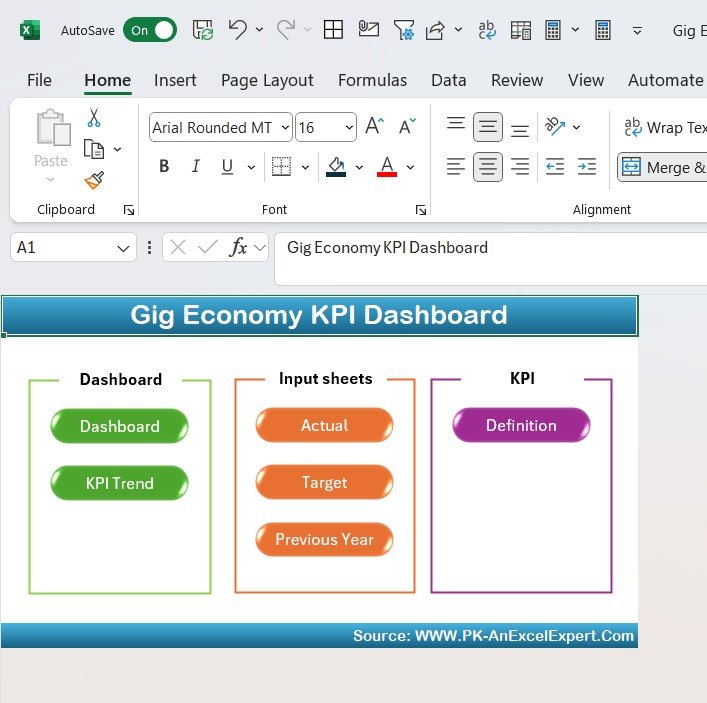
The Excel dashboard is easy to use, with interactive charts, filters, and slicers that allow you to explore gig performance data and identify trends for better decision-making.
Why You’ll Love the Gig Economy KPI Dashboard in Excel
✅ Track Earnings & Workload Efficiently
Monitor how much you’re earning from each gig, track your hours worked, and identify how much time you’re spending on different tasks. Keep everything organized in one place.
✅ Improve Task & Client Performance
Analyze which tasks are most profitable, track completion rates, and evaluate client satisfaction to improve your performance and optimize income.
✅ Optimize Work Schedule & Resource Allocation
Make data-driven decisions about how to allocate your time and energy to the most profitable gigs, improving your productivity and maximizing your earnings.
✅ Enhance Client Relationships
Track client feedback, ratings, and repeat business opportunities to maintain long-term relationships with clients who provide consistent work.
✅ Simplify Gig Economy Management
With all your gig performance metrics in one place, easily track your progress, set goals, and stay on top of payments, making gig work easier to manage and more profitable.
What’s Inside the Gig Economy KPI Dashboard Template?
- Earnings Tracking: Monitor income from each gig, total earnings per week or month, and income trends.
- Task Completion Monitoring: Track task completion rates and identify areas to improve efficiency.
- Client Feedback & Ratings: Track client satisfaction scores, reviews, and ratings to identify repeat business opportunities.
- Hours Worked & Performance: Monitor hours worked and optimize your time allocation for maximum efficiency.
- Customizable KPIs: Adjust the dashboard to track specific gig-related metrics, such as payment status or gig type.
- Interactive Reports: Use dynamic charts and filters to explore gig data and make informed decisions.
How to Use the Gig Economy KPI Dashboard in Excel
1️⃣ Download the Template: Instantly access your Gig Economy KPI Dashboard in Excel.
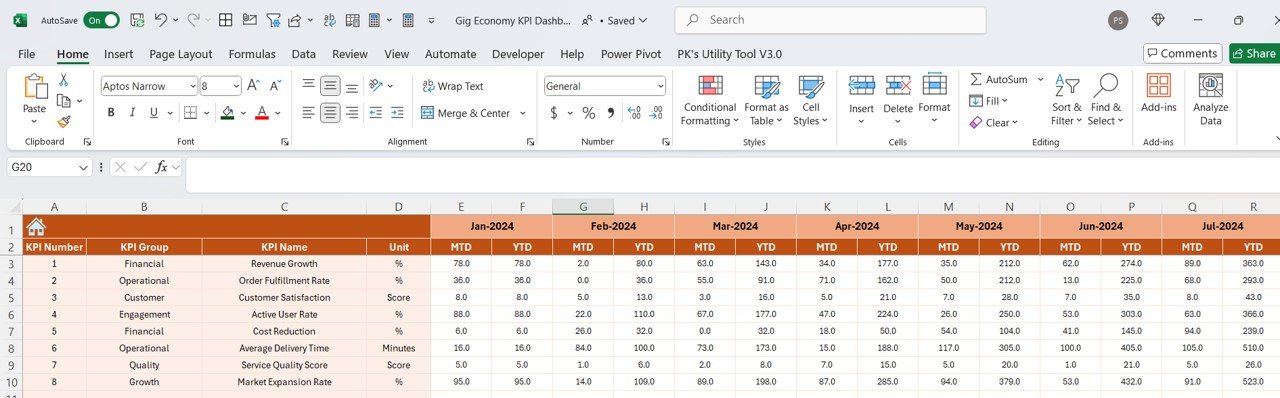
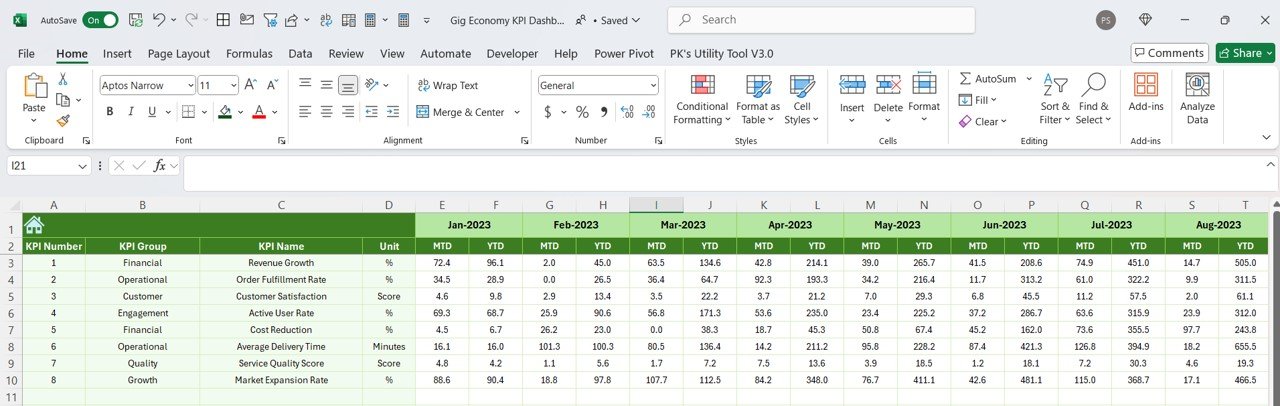
2️⃣ Input Gig Data: Enter data such as hours worked, task completion, client feedback, and earnings.
3️⃣ Track & Monitor KPIs: Use the dashboard to monitor performance, earnings, and client satisfaction in real-time.
4️⃣ Analyze & Optimize: Leverage insights from the dashboard to improve your work schedule, performance, and client relationships.
Who Can Benefit from the Gig Economy KPI Dashboard in Excel?
🔹 Freelancers & Gig Workers
🔹 Gig Economy Platforms & Contractors
🔹 Business Owners & Entrepreneurs Using Gig Workers
🔹 Project Managers & Team Leaders in the Gig Economy
🔹 Data Analysts in the Gig Economy
🔹 Anyone Looking to Optimize Gig Work & Earnings
Track, analyze, and optimize your gig economy performance with the Gig Economy KPI Dashboard in Excel. Monitor earnings, performance, client feedback, and more to ensure success in your gig work and business.
Click here to read the Detailed blog post
Visit our YouTube channel to learn step-by-step video tutorials
Youtube.com/@PKAnExcelExpert






















Reviews
There are no reviews yet.