


In today’s data-driven fitness industry, understanding performance across memberships, revenue, attendance, and engagement isn’t optional—it’s essential. That’s why we’ve built the Fitness Studio KPI Dashboard in Power BI, a ready-to-use, intelligent visual analytics tool that turns your operational data into instant business insights. 📊💪
Designed for gym owners, studio managers, and fitness entrepreneurs, this dashboard integrates your Excel data and provides dynamic views for Month-to-Date (MTD) and Year-to-Date (YTD) comparisons, making performance tracking effortless and powerful.
💡 Key Features of the Dashboard
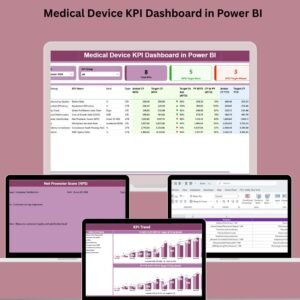
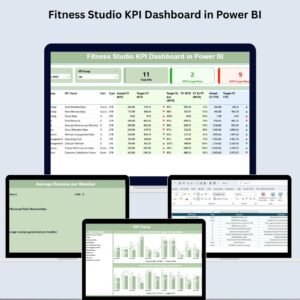
🧾 Summary Page – Your Performance Command Center

-
Use month and KPI group slicers to drill down
-
Instantly view:
✅ Total KPIs
✅ MTD Target Met
✅ MTD Target Missed -
Highlighted table showing:
🔹 KPI Name, Group, Unit, Type (LTB/UTB)
🔹 Actual vs Target (MTD and YTD)
🔹 Current vs Previous Year comparisons
🔹 Performance icons (✅/❌) with % deltas
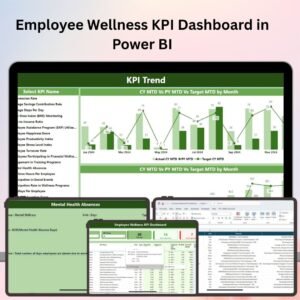
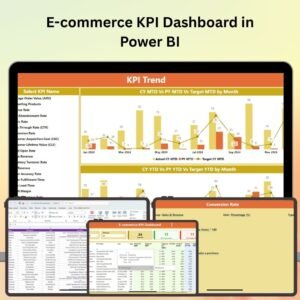
📈 KPI Trend Page – Visualize the Journey
-
Two combo charts: MTD and YTD performance across CY and PY
-
Dynamic slicer to analyze trends for any KPI
-
Understand seasonality, growth, and patterns at a glance
🔍 KPI Definition Page – Drill Down for Clarity
-
Built-in drill-through feature
-
Get KPI definitions, units, formulas, and classification (UTB or LTB)
-
Perfect for onboarding new team members or presenting to stakeholders
🧘♂️ Track KPIs That Matter Most in Fitness Studios
📌 Membership Growth Rate
📌 Class Attendance Rate
📌 Monthly Recurring Revenue (MRR)
📌 Revenue per Member
📌 Churn Rate
📌 Member Satisfaction Score
📌 Personal Training Revenue
📌 Average Attendance per Class
📌 Operational Cost per Location
📌 Profit Margin %
Each KPI is customizable to reflect your unique goals and studio model.
🚀 Why This Dashboard Will Transform Your Studio
✅ Real-Time Decision-Making
Thanks to Power BI’s integration with Excel, data updates instantly reflect on your dashboard—no delays, no fuss.
✅ All-in-One Performance View
Say goodbye to scattered spreadsheets. This tool combines financial, engagement, and attendance metrics into one clean, dynamic interface.
✅ Visual Storytelling for Stakeholders
Leverage bar charts, combo visuals, icons, and slicers to present powerful data stories to investors, managers, or trainers.
✅ Smart Alerts with Icons
Instantly see which KPIs are off-track using green/red icons—no manual analysis required.
✅ Customizable and Scalable
Whether you manage one studio or a national chain, you can expand KPI groups or adjust formulas to meet evolving needs.
🛠️ How to Use the Dashboard
1️⃣ Update your Excel data files:
• Input_Actual – Actual MTD and YTD performance
• Input_Target – Monthly/Yearly KPI targets
• KPI_Definition – Define or edit KPI names, groups, formulas, and types
2️⃣ Open the Power BI file. The dashboard auto-syncs with the updated data.
3️⃣ Navigate using slicers for months or KPI groups. Drill through from Summary to view definitions.
4️⃣ Explore trends and get insights to make impactful decisions faster.
🎯 Who Should Use This Dashboard?
-
Fitness Studio Owners
-
Gym Franchise Managers
-
Boutique Wellness Center Operators
-
Personal Training Program Leads
-
Financial Analysts in Fitness Chains
🎁 What You’ll Receive
📦 Power BI File (.PBIX)
📊 Excel Data Templates (Input_Actual, Input_Target, KPI_Definition)
📘 Setup Guide with Usage Instructions
📺 YouTube Tutorial: youtube.com/@PKAnExcelExpert


Reviews
There are no reviews yet.