


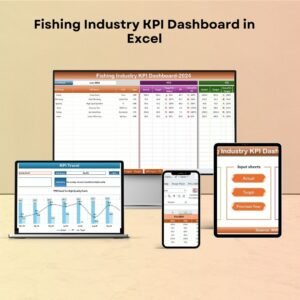
The Fishing Industry KPI Dashboard in Excel is a comprehensive and user-friendly tool designed to help businesses in the fishing industry monitor key performance indicators (KPIs) such as catch volume, revenue, operational costs, and sustainability metrics. This Excel-based dashboard enables fishing companies, managers, and analysts to track their performance in real-time, allowing them to optimize their operations, manage resources effectively, and improve decision-making.
Whether you’re managing a fishing fleet, aquaculture farm, or seafood distribution business, this dashboard provides you with valuable insights into your operations, enabling you to make data-driven decisions that enhance profitability and sustainability.

Key Features of the Fishing Industry KPI Dashboard in Excel
📊 Catch Volume Monitoring
Track the total volume of catch by various categories, such as species, region, and fishing vessel. Monitor production levels and identify trends to optimize fishing operations.
💰 Revenue & Profitability Tracking
Monitor your business’s financial health by tracking revenue generated from sales of various fish species, as well as calculating profit margins. Identify high-performing sectors and areas for improvement.
🛠 Operational Cost Management
Track operational costs, including fuel, maintenance, labor, and other expenses. Ensure profitability by identifying inefficiencies and reducing unnecessary expenses in the fishing process.
🌱 Sustainability Metrics
Monitor environmental sustainability by tracking metrics like fish stock levels, bycatch rates, and adherence to sustainable fishing practices. Promote responsible fishing operations and compliance with regulations.
📈 Real-Time Data & Visual Analysis
Visualize KPIs in real time through interactive charts and graphs, helping you make immediate, informed decisions based on the latest data available. Use this feature to monitor trends and compare past performance.
⚙️ Customizable & Scalable Dashboard
The dashboard is fully customizable, allowing you to tailor it to suit the specific needs of your fishing business. Modify KPIs, add new categories, and adjust the data layout to match your operations.
Why You’ll Love the Fishing Industry KPI Dashboard in Excel
✅ Monitor Key Metrics Efficiently
Track essential performance metrics such as catch volume, revenue, expenses, and sustainability indicators to ensure smooth operations.
✅ Improve Profitability
By closely monitoring revenue and costs, identify areas for optimization and enhance profitability in your fishing business.
✅ Promote Sustainability
Monitor sustainable fishing practices and ensure compliance with environmental regulations. Track fish stock levels and bycatch rates to promote responsible fishing.
✅ Real-Time Decision Making
With up-to-date data and visual analytics, make real-time decisions that can immediately improve operational efficiency and profitability.
✅ Customizable for Your Business Needs
The dashboard is flexible and scalable, making it suitable for small businesses, large fishing fleets, or aquaculture farms. Adapt it to reflect your specific KPIs and goals.
What’s Inside the Fishing Industry KPI Dashboard in Excel?
-
Catch Volume Monitoring: Track the total catch by species and region.
-
Revenue & Profitability Tracking: Monitor financial performance and profitability.
-
Operational Cost Management: Track costs and identify areas to reduce expenses.
-
Sustainability Metrics: Ensure compliance with sustainable fishing practices.
-
Real-Time Data Integration: Get real-time insights into business performance.
-
Customizable Features: Adapt the dashboard to fit your specific business requirements.
How to Use the Fishing Industry KPI Dashboard in Excel
1️⃣ Download the Template: Get instant access to the Fishing Industry KPI Dashboard in Excel.
2️⃣ Integrate Your Data: Input your catch data, revenue, and cost information into the dashboard.
3️⃣ Track Key KPIs: Monitor important metrics such as catch volume, revenue, and operational costs.
4️⃣ Analyze Trends: Use time-based analysis to track the progress of your business and identify areas for improvement.
5️⃣ Make Data-Driven Decisions: Use insights from the dashboard to optimize your fishing operations and increase profitability.
Who Can Benefit from the Fishing Industry KPI Dashboard in Excel?
🔹 Fishing Fleet Owners & Operators
🔹 Aquaculture Farms & Seafood Producers
🔹 Fisheries Management Teams
🔹 Seafood Retailers & Distributors
🔹 Environmental & Sustainability Analysts
🔹 Government Agencies Monitoring Fisheries
🔹 Small & Medium Enterprises (SMBs) in the Fishing Industry
Ensure sustainable, profitable, and efficient operations in your fishing business with the Fishing Industry KPI Dashboard in Excel. Track performance, monitor sustainability, and make data-driven decisions to improve your business.
Click here to read the Detailed blog post
Visit our YouTube channel to learn step-by-step video tutorials
Youtube.com/@PKAnExcelExpert


Reviews
There are no reviews yet.