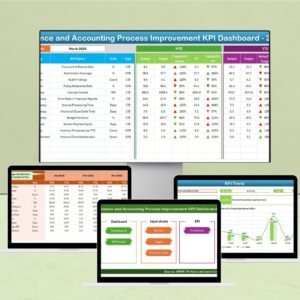
The Finance and Accounting Process Improvement KPI Dashboard in Excel is a powerful tool designed to help finance teams, accountants, and business leaders optimize their financial processes. This Excel-based dashboard provides an organized and structured way to track key performance indicators (KPIs) related to finance and accounting operations, such as accounts payable, accounts receivable, transaction processing time, and overall financial efficiency.
With real-time data integration and comprehensive reporting capabilities, this dashboard helps businesses monitor and improve their financial processes, reduce inefficiencies, and ensure timely financial reporting. The tool is highly customizable, allowing you to adjust KPIs and metrics to suit your specific finance and accounting goals.
Key Features of the Finance and Accounting Process Improvement KPI Dashboard in Excel
📊 Comprehensive KPI Tracking
Track a wide range of KPIs, including transaction processing times, accounts payable/receivable aging, and monthly financial reports. This feature ensures you have a holistic view of your finance processes and performance.
📈 Accounts Payable & Receivable Analysis
Monitor the status of accounts payable and receivable, including outstanding balances and overdue invoices. Identify bottlenecks in your payment cycles and optimize your cash flow management.
💡 Transaction Processing Time Monitoring
Track the time taken to process each financial transaction, whether it’s a payment, invoice, or journal entry. Identify delays in processing and implement strategies to speed up the cycle.
📅 Monthly/Quarterly Financial Reporting
Generate real-time financial reports for monthly, quarterly, or annual periods. Track your financial performance against targets and historical data to ensure you stay on track with your budget and goals.
⚙️ Customizable KPIs & Metrics
Tailor the dashboard to reflect the KPIs that matter most to your organization. Whether you’re focusing on cost management, cash flow optimization, or financial reporting, the dashboard can be customized to meet your unique needs.
🔑 Real-Time Data Updates & Integration
Integrate real-time financial data into the dashboard to monitor KPIs continuously. Make timely decisions based on up-to-date financial performance, ensuring operational efficiency.
Why You’ll Love the Finance and Accounting Process Improvement KPI Dashboard in Excel
✅ Optimize Financial Processes
Track key performance metrics and identify areas for improvement in your finance and accounting operations. Streamline workflows and reduce inefficiencies.
✅ Improve Accounts Payable & Receivable Management
Monitor outstanding invoices and overdue payments. Improve cash flow management and reduce the risk of financial disruptions.
✅ Enhance Reporting & Financial Analysis
Generate insightful reports and track financial performance over time. Use this data to make informed decisions and keep your financial goals on track.
✅ Customizable for Your Finance Needs
Adapt the dashboard to your company’s specific finance and accounting processes. Whether you’re managing small-scale operations or large corporate finances, this tool can be scaled to fit your needs.
✅ Data-Driven Decision Making
Make strategic decisions based on real-time data. Identify trends, optimize processes, and ensure that your financial operations are running smoothly.
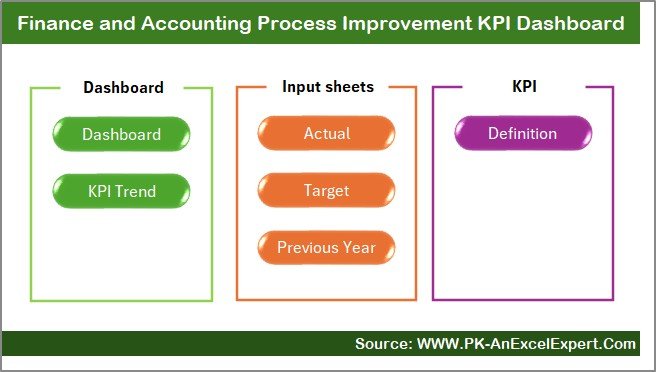
What’s Inside the Finance and Accounting Process Improvement KPI Dashboard in Excel?
-
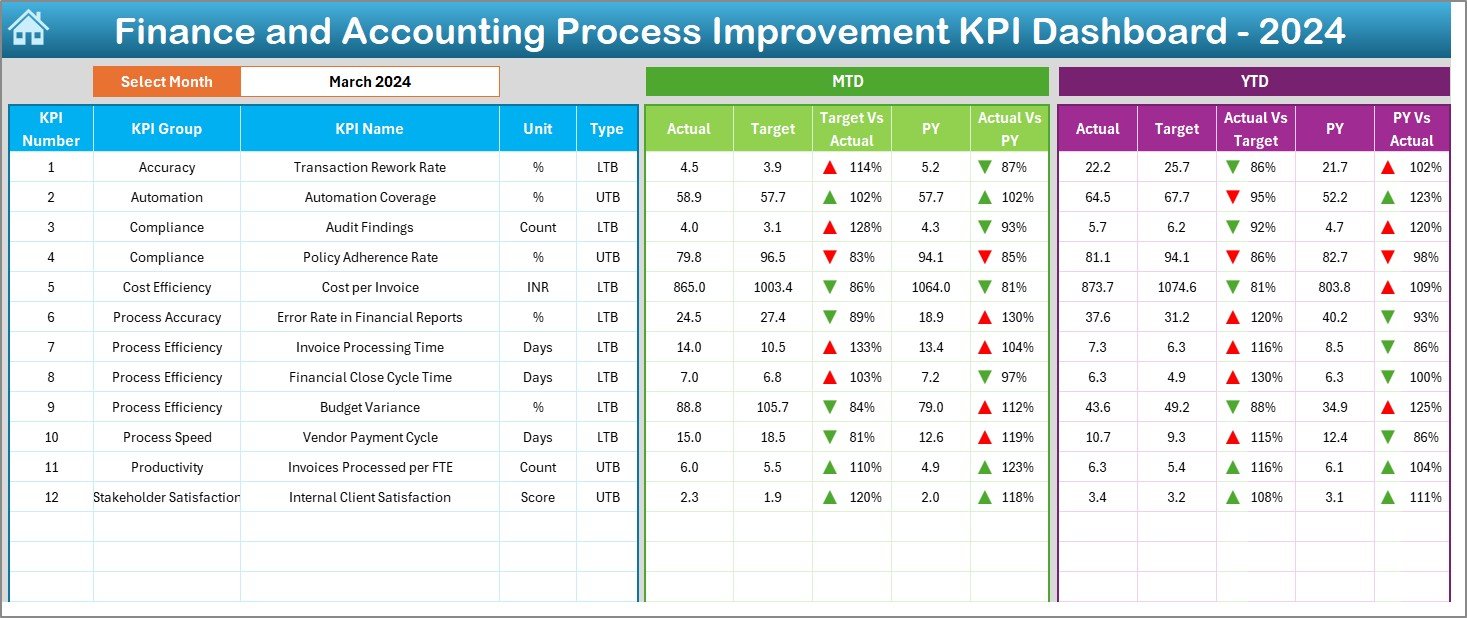
Comprehensive KPI Tracking: Track critical finance and accounting KPIs like accounts payable, receivable, and transaction times.
-
Accounts Payable & Receivable Monitoring: Track outstanding balances and overdue invoices.
-
Transaction Processing Time Monitoring: Monitor the time taken to process transactions.
-
Monthly/Quarterly Financial Reporting: Generate real-time financial reports for different time periods.
-
Customizable KPIs & Metrics: Adjust the dashboard to meet your company’s specific financial goals.
-
Real-Time Data Updates: Integrate financial data into the dashboard for up-to-date performance tracking.
How to Use the Finance and Accounting Process Improvement KPI Dashboard in Excel
1️⃣ Download the Template: Access the Finance and Accounting Process Improvement KPI Dashboard in Excel instantly.
2️⃣ Input Financial Data: Enter your financial data, including accounts payable, receivable, and transaction times.
3️⃣ Monitor KPIs & Performance: Track key financial metrics, such as overdue payments, processing times, and financial reporting.
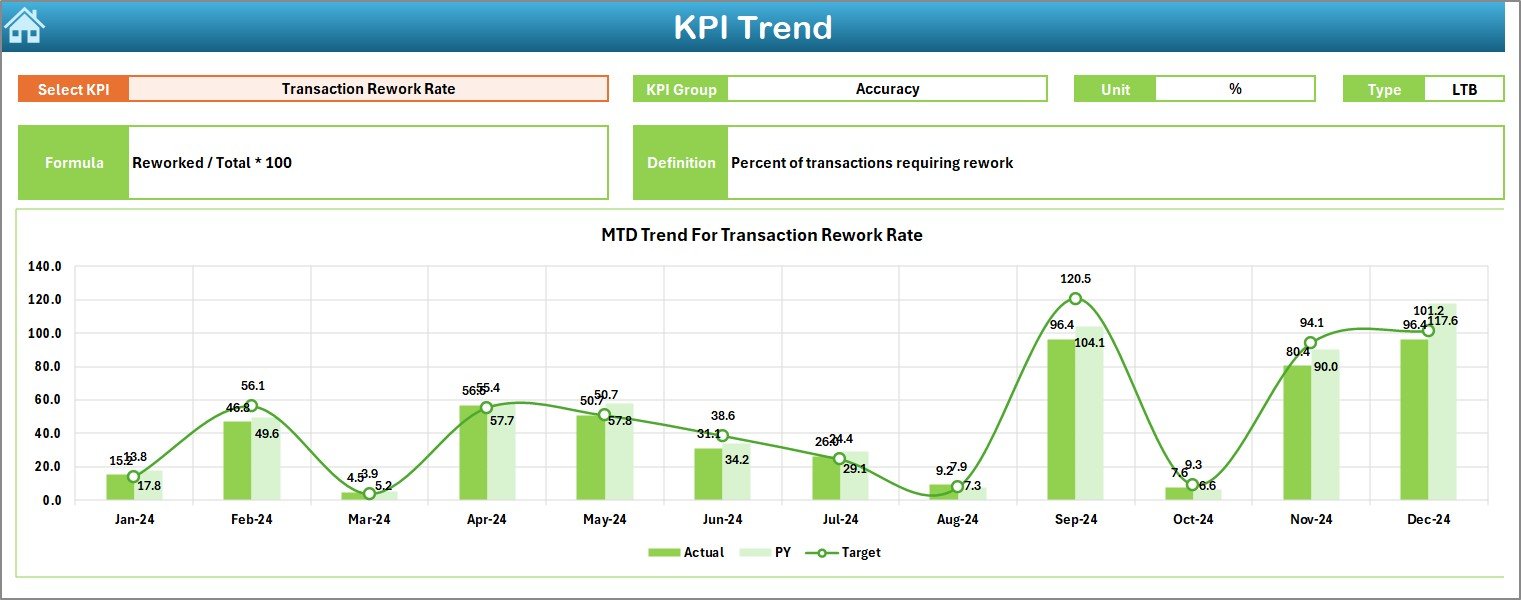
4️⃣ Analyze Data & Trends: Use the data analysis tools to identify trends and monitor your financial progress.
5️⃣ Optimize Financial Operations: Use insights to optimize processes, improve cash flow, and streamline reporting.
Who Can Benefit from the Finance and Accounting Process Improvement KPI Dashboard in Excel?
🔹 Finance Teams & Accountants
🔹 Chief Financial Officers (CFOs)
🔹 Business Owners & Executives
🔹 Accounts Payable/Receivable Teams
🔹 Data Analysts & Financial Consultants
🔹 Small & Medium Enterprises (SMBs)
🔹 Large Corporations with Complex Financial Operations
Optimize your finance and accounting processes with the Finance and Accounting Process Improvement KPI Dashboard in Excel. Monitor financial performance, improve cash flow, and streamline reporting to drive business success.
Click here to read the Detailed blog post
Visit our YouTube channel to learn step-by-step video tutorials
Youtube.com/@PKAnExcelExpert
















Reviews
There are no reviews yet.