
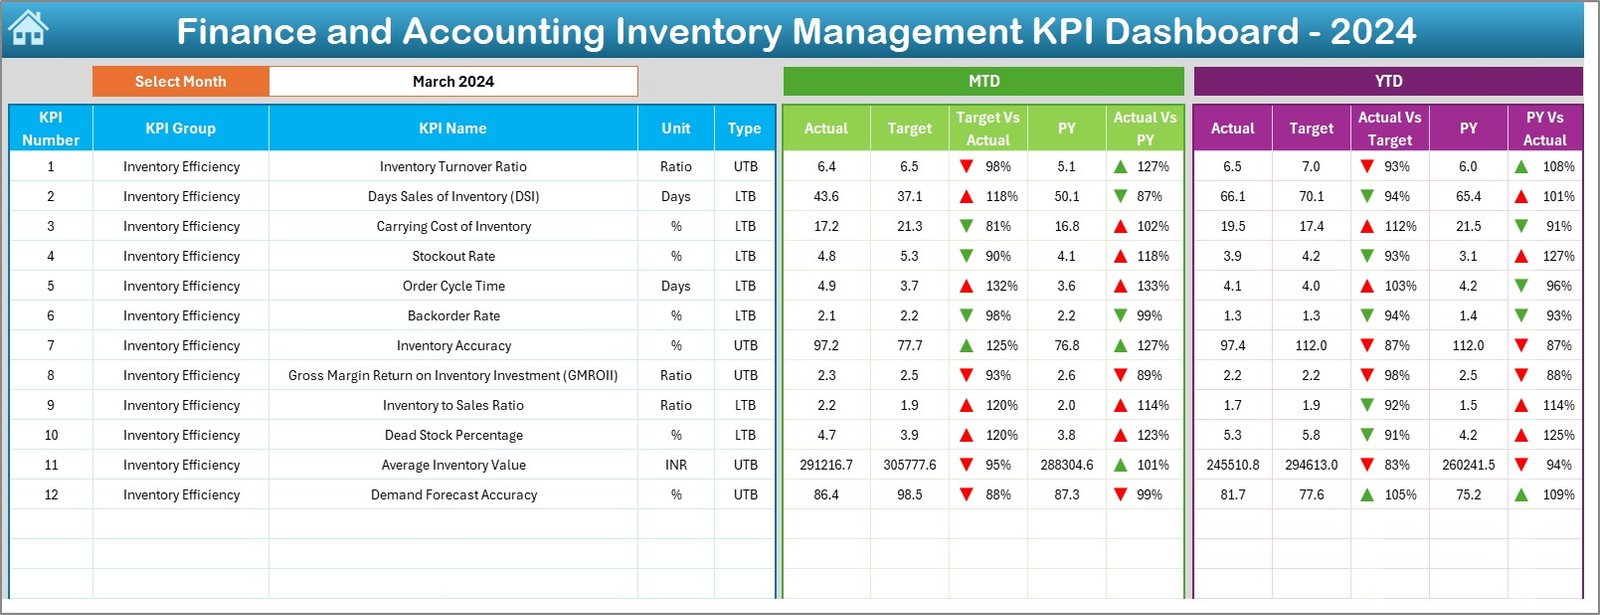
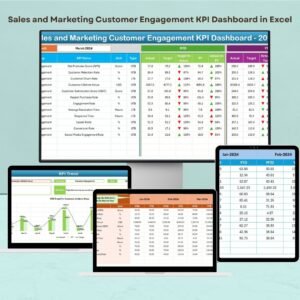
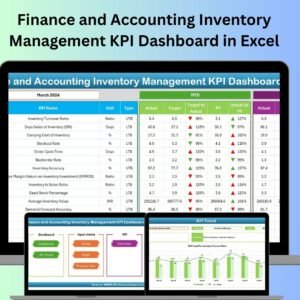
The Finance and Accounting Inventory Management KPI Dashboard in Excel is a powerful tool designed to help finance and accounting teams track and manage inventory performance effectively. This Excel-based dashboard provides a clear overview of key performance indicators (KPIs) related to inventory management, such as stock levels, turnover rates, inventory costs, and sales performance. It helps businesses streamline their inventory control processes, reduce holding costs, and improve the accuracy of financial reporting.
By using this dashboard, you can easily monitor inventory health, assess the impact of inventory on cash flow, and ensure that your business can meet demand while minimizing excess stock. The dashboard integrates financial and inventory data, offering real-time insights that allow for better decision-making, cost control, and overall financial optimization.
Key Features of the Finance and Accounting Inventory Management KPI Dashboard in Excel
📊 Stock Level Tracking
Monitor current stock levels across different product categories. The dashboard provides a visual representation of inventory, helping you quickly identify understocked or overstocked items.
💸 Inventory Cost Management
Track the costs associated with holding inventory, including storage costs and cost of goods sold (COGS). This helps you optimize inventory to minimize unnecessary expenses and improve profitability.
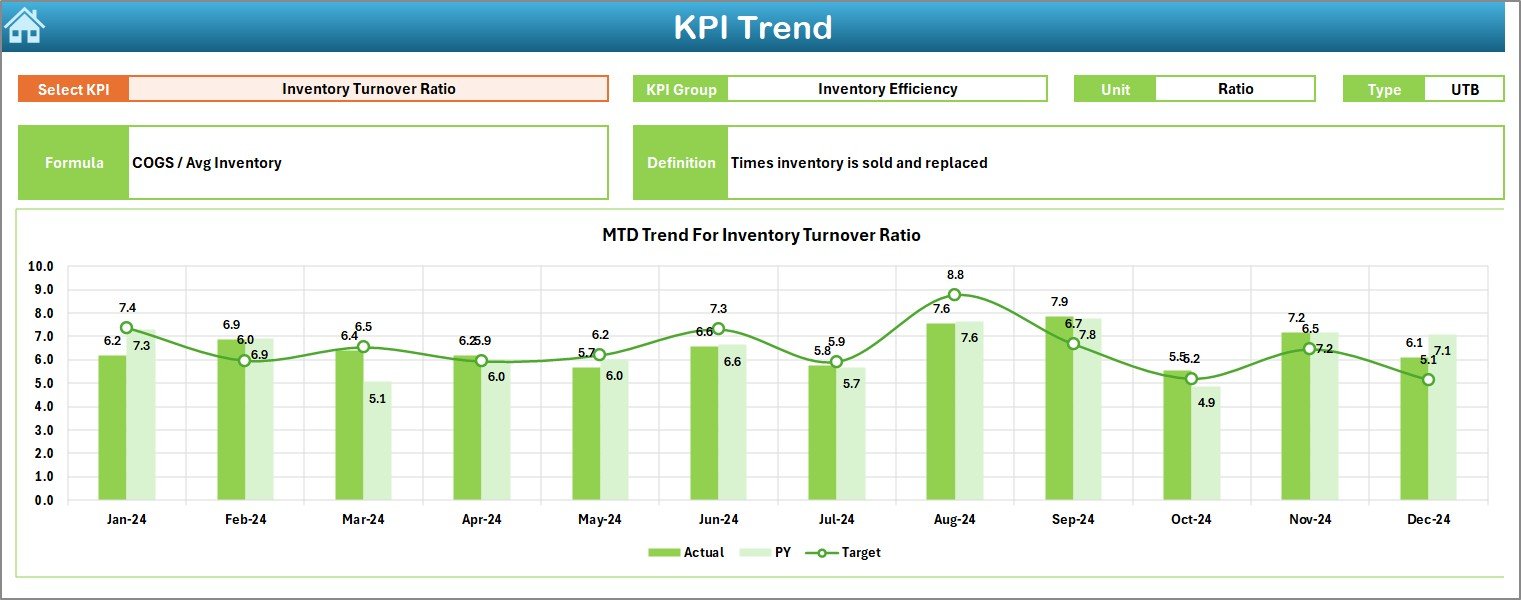
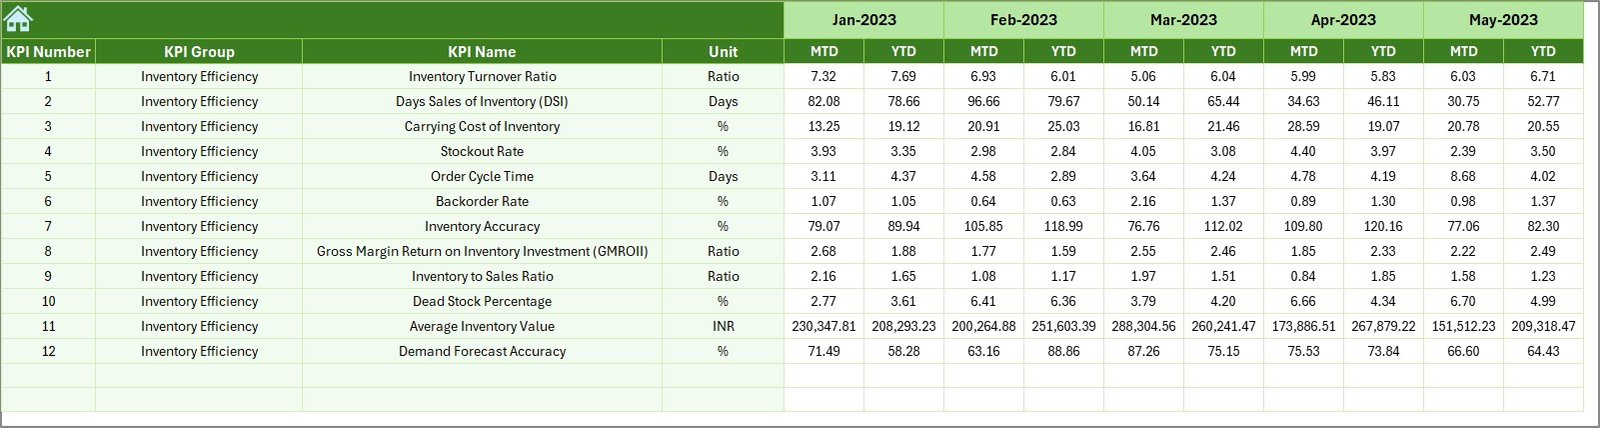
📈 Inventory Turnover Rate
Calculate the inventory turnover rate to measure how efficiently inventory is being sold and replenished. A high turnover rate indicates efficient inventory management and a healthy sales cycle.
⚙️ Sales & Demand Forecasting
Track sales performance against inventory levels to better understand demand. Use this data to forecast future sales and adjust inventory purchasing decisions accordingly.
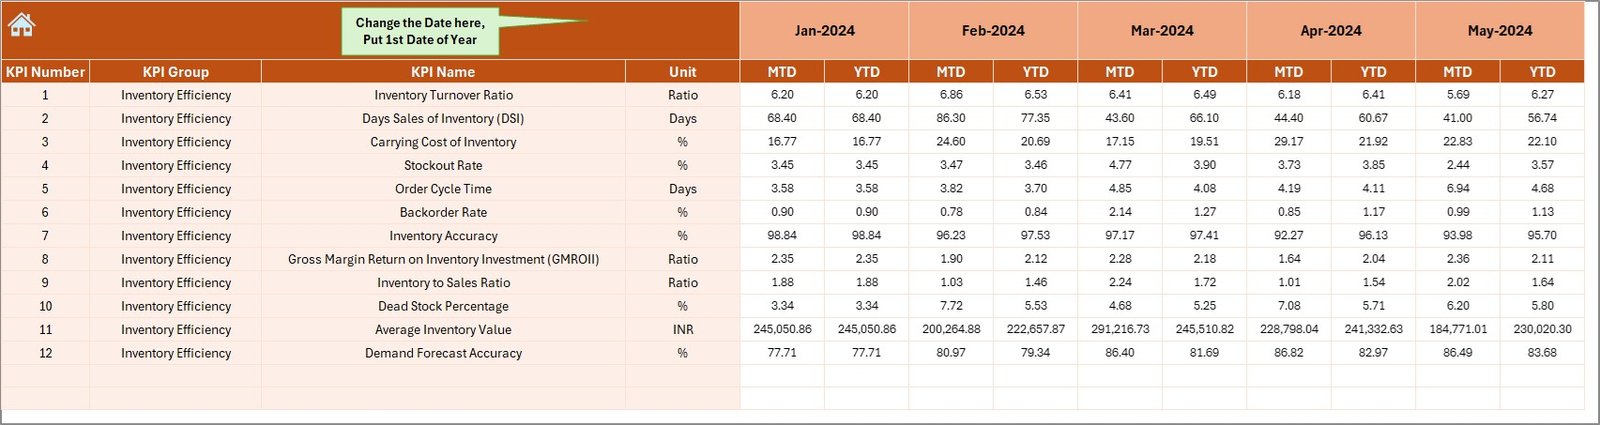
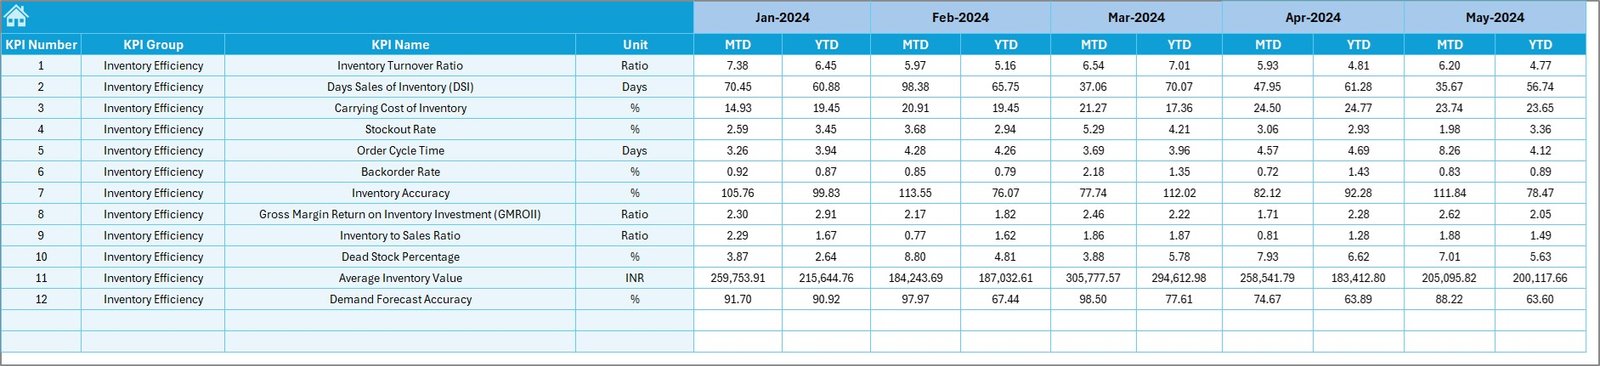
📅 Time-Based Performance Analysis
Monitor inventory performance over different time periods (monthly, quarterly, yearly) to assess trends, make forecasts, and identify areas for improvement in your inventory management practices.
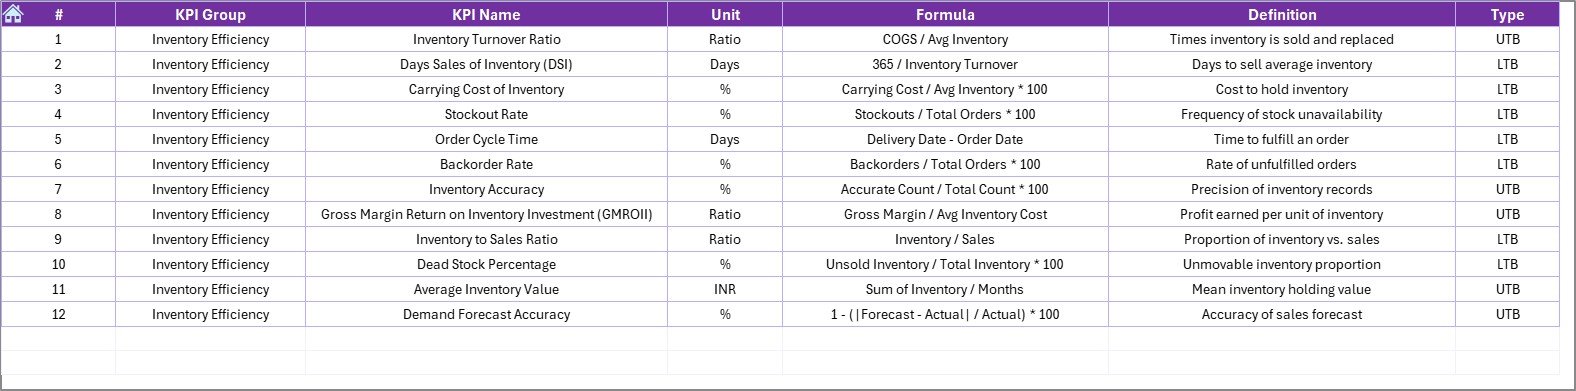
🔑 Customizable KPIs & Metrics
Customize the dashboard to reflect the most important KPIs for your business. You can track specific items, add additional financial metrics, or modify the inventory metrics to meet your operational needs.
Why You’ll Love the Finance and Accounting Inventory Management KPI Dashboard in Excel

✅ Streamline Inventory Management
Easily track inventory levels, costs, and turnover to optimize your inventory process. Ensure that your business is meeting demand without holding excessive stock.
✅ Data-Driven Decision Making
Leverage real-time data to make better decisions about purchasing, stocking, and selling inventory. This improves cash flow management and overall financial health.
✅ Optimize Cash Flow
Monitor inventory costs and minimize excess stock to free up cash flow. A well-managed inventory leads to better financial stability and improved operational efficiency.
✅ Customizable & Scalable
Adapt the dashboard to suit your specific financial and inventory needs. Whether you’re managing a small inventory or a large-scale operation, this dashboard is scalable and customizable.
✅ Easy-to-Use Interface
The Excel dashboard is designed to be user-friendly. Even if you don’t have advanced Excel skills, you can easily input data and track inventory metrics in an organized, visual format.
What’s Inside the Finance and Accounting Inventory Management KPI Dashboard in Excel?
-
Stock Level Tracking: Monitor current stock levels and ensure balanced inventory.
-
Inventory Cost Management: Track the costs of holding inventory and optimize expenses.
-
Inventory Turnover Rate: Calculate the rate at which inventory is sold and replenished.
-
Sales & Demand Forecasting: Track sales and predict future demand for better inventory control.
-
Time-Based Performance Monitoring: Assess inventory performance over different periods.
-
Customizable Metrics: Tailor the dashboard to include KPIs that suit your inventory management needs.
How to Use the Finance and Accounting Inventory Management KPI Dashboard in Excel
1️⃣ Download the Template: Instantly access the Finance and Accounting Inventory Management KPI Dashboard in Excel.
2️⃣ Input Your Inventory Data: Enter stock levels, costs, sales data, and other relevant information into the dashboard.
3️⃣ Track KPIs & Performance: Monitor KPIs such as inventory turnover, stock levels, and COGS.
4️⃣ Analyze Trends & Insights: Use time-based analysis to assess inventory performance over different periods.
5️⃣ Optimize Inventory & Financial Management: Use the insights to make better decisions about inventory purchasing, cost management, and financial forecasting.
Who Can Benefit from the Finance and Accounting Inventory Management KPI Dashboard in Excel?
🔹 Finance & Accounting Teams
🔹 Supply Chain & Inventory Managers
🔹 Business Owners & Entrepreneurs
🔹 E-commerce & Retail Companies
🔹 Small & Medium Enterprises (SMBs)
🔹 Large Corporations with Complex Inventory Systems
🔹 Procurement & Logistics Teams
Optimize your inventory management and financial performance with the Finance and Accounting Inventory Management KPI Dashboard in Excel. Track stock levels, costs, turnover rates, and sales to improve decision-making and enhance operational efficiency.
Click here to read the Detailed blog post
Visit our YouTube channel to learn step-by-step video tutorials
Youtube.com/@PKAnExcelExpert


Reviews
There are no reviews yet.