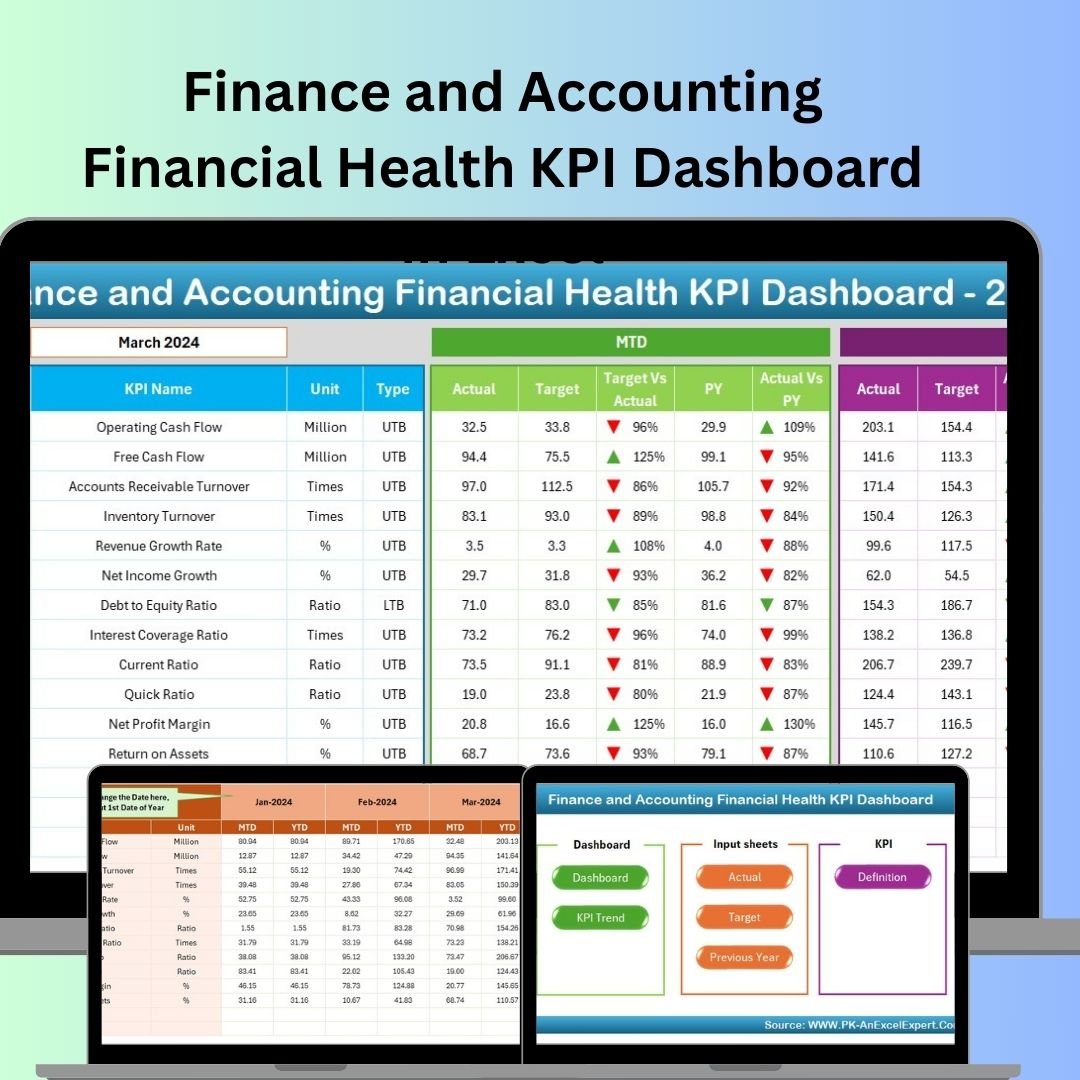
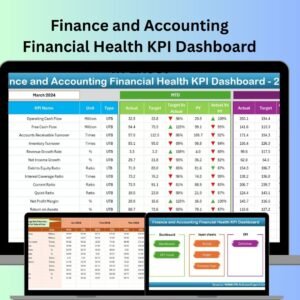
The Finance and Accounting Financial Health KPI Dashboard in Excel is a powerful tool designed for finance professionals, accountants, and business managers to track the financial health of an organization. This Excel-based dashboard provides real-time insights into key performance indicators (KPIs) such as liquidity ratios, profitability metrics, debt levels, and overall financial stability, helping you make informed decisions to improve financial performance.
By monitoring your company’s financial health using this dashboard, you can easily identify areas of concern, assess risk levels, and take proactive steps to strengthen your organization’s financial standing. The dashboard is designed to be user-friendly and customizable, making it easy to track, analyze, and visualize your financial data.
Key Features of the Finance and Accounting Financial Health KPI Dashboard in Excel
📊 Comprehensive KPI Tracking
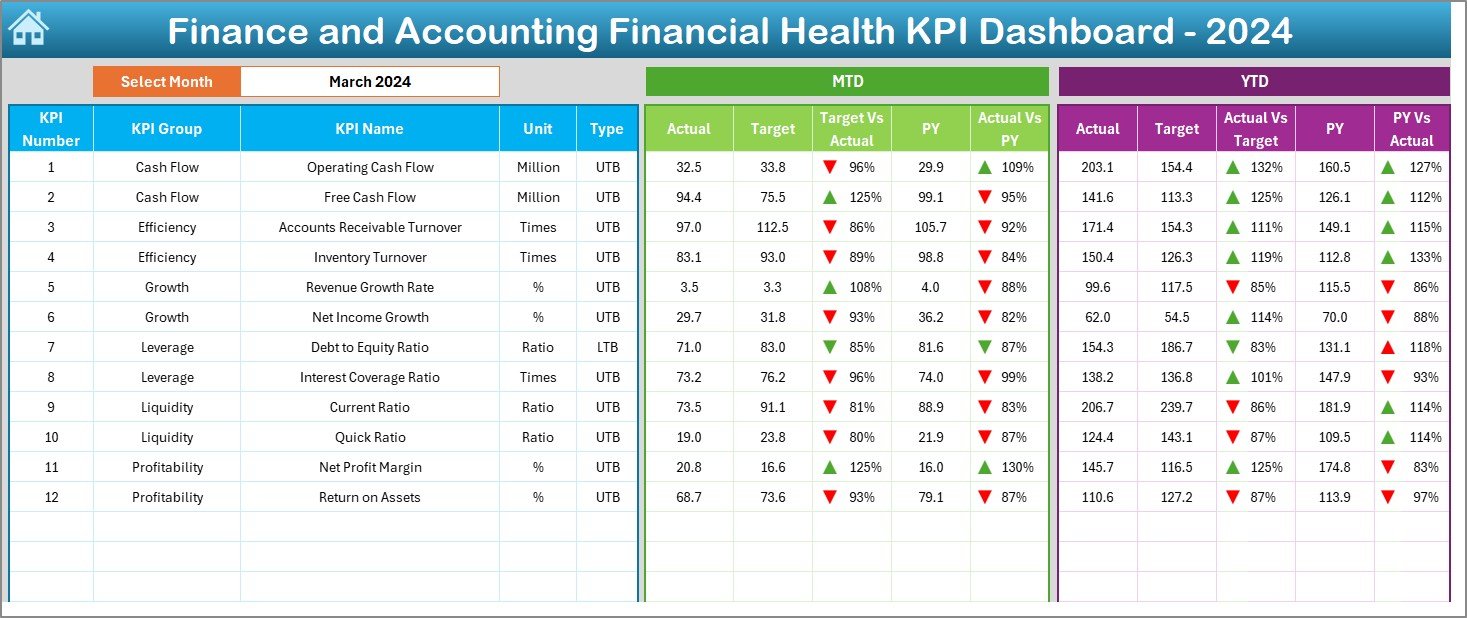
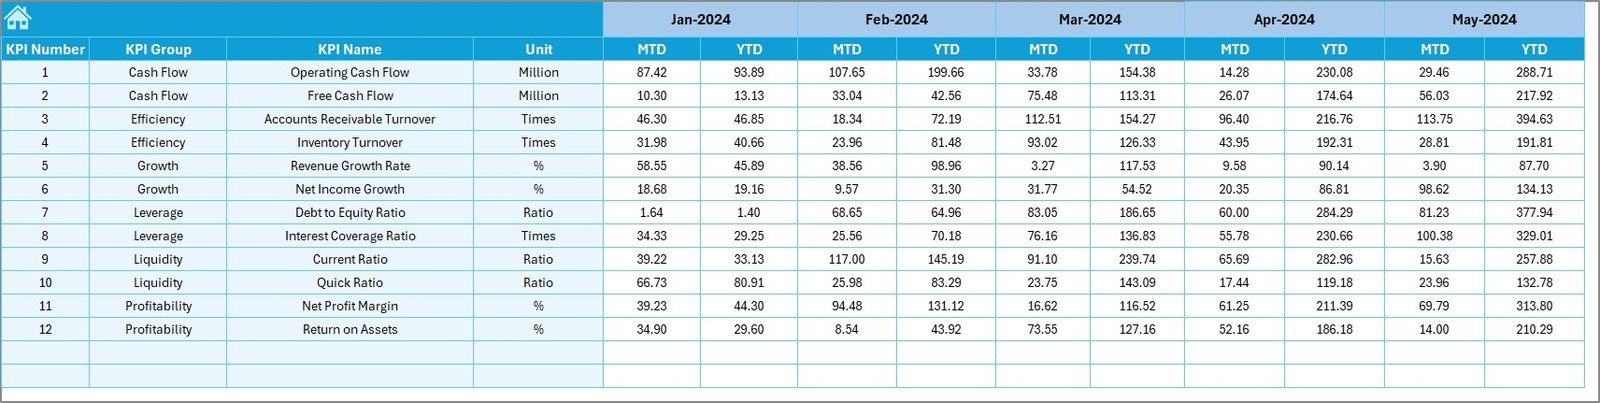
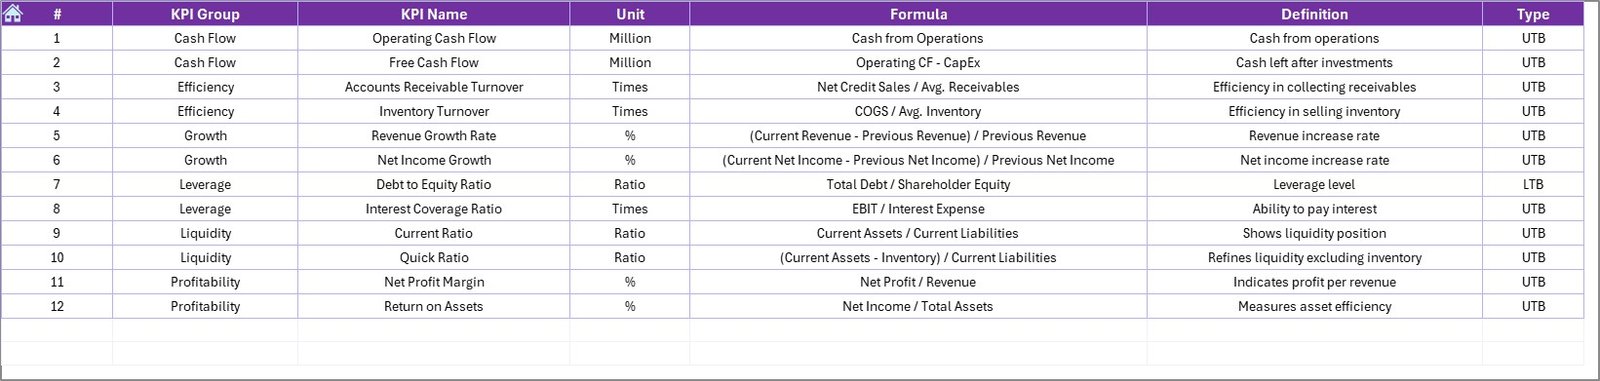
Track key financial KPIs such as profitability, liquidity, solvency, and efficiency ratios. Gain an overview of your company’s financial performance at a glance.
📈 Profitability & Cost Monitoring
Monitor metrics like net profit margin, return on assets (ROA), and return on equity (ROE). This helps you assess the company’s ability to generate profit and manage expenses efficiently.
💸 Cash Flow Management
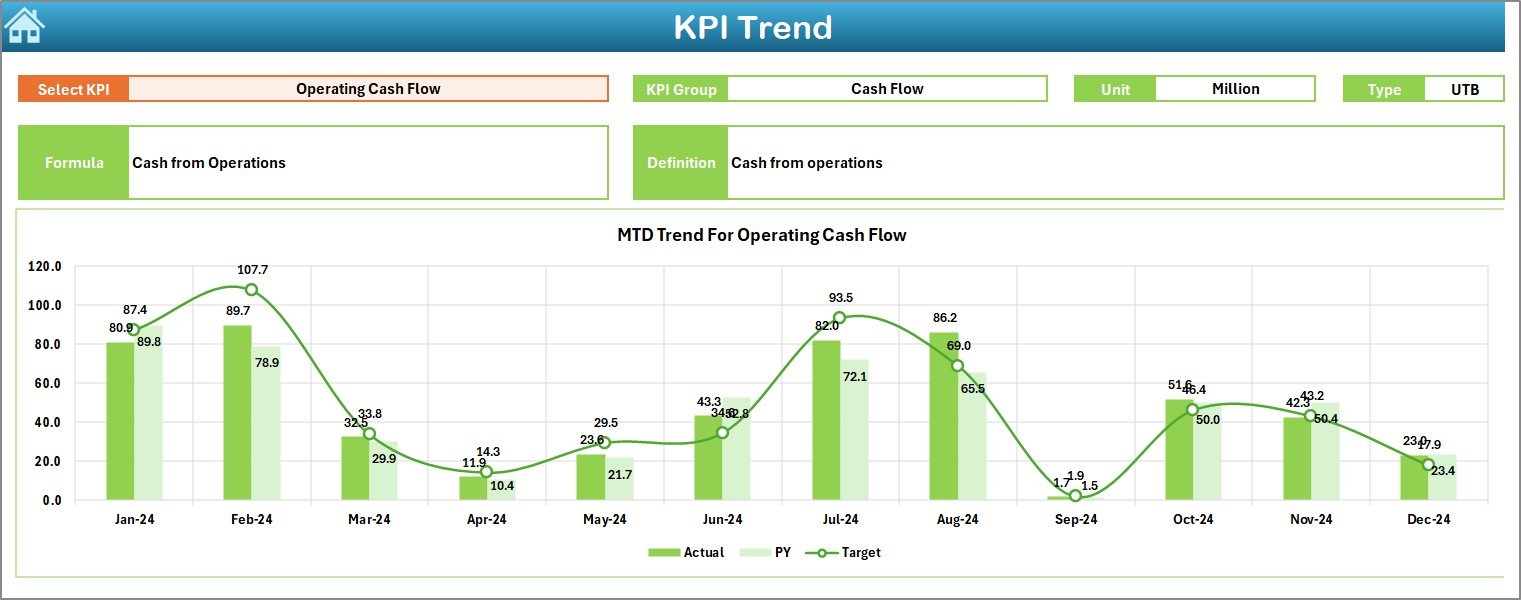
Track cash flow metrics such as operating cash flow, free cash flow, and cash conversion cycle to ensure that the company has sufficient liquidity to cover its obligations.
📉 Debt & Risk Assessment
Measure debt ratios and assess the risk level of your organization with metrics like debt-to-equity ratio and interest coverage ratio. Track how much leverage is being used in the company.
📅 Time-Based Financial Performance Analysis
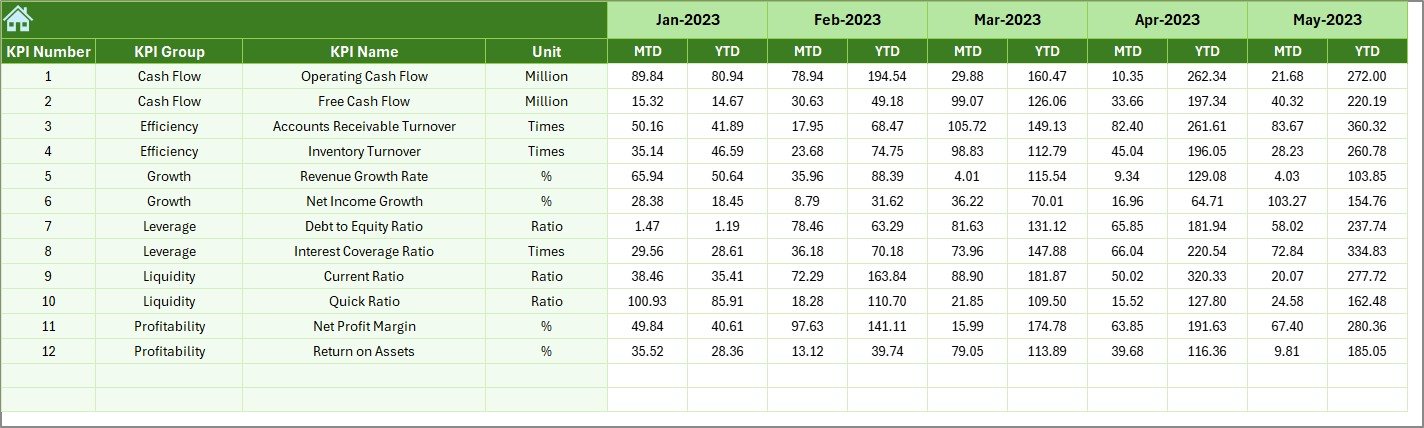
Monitor the company’s financial health over different periods (daily, weekly, monthly, quarterly). This allows you to evaluate trends and identify areas of improvement.
⚙️ Customizable Dashboard
Tailor the dashboard to track the KPIs and financial metrics that are most relevant to your organization. Add or remove data fields, adjust categories, and customize visuals to meet your business needs.
Why You’ll Love the Finance and Accounting Financial Health KPI Dashboard in Excel

✅ Centralized Financial Management
Track all your financial KPIs in one place, reducing the need to navigate through multiple reports or systems. Get a holistic view of your company’s financial health.
✅ Improved Cash Flow Management
Monitor and optimize cash flow with real-time data on operating, free, and net cash flow, ensuring your business remains liquid and can meet financial obligations.
✅ Assess Financial Risk
Keep a close eye on your debt ratios and solvency metrics. Identify and address potential risks before they escalate into major financial problems.
✅ Boost Financial Decision-Making
Leverage the insights from this dashboard to make data-driven decisions that improve profitability, reduce costs, and increase efficiency across the organization.
✅ Customizable & Scalable
Adapt the dashboard to fit your specific business needs. Whether you’re tracking financial health for a small business or a large corporation, the dashboard is scalable for various company sizes.
What’s Inside the Finance and Accounting Financial Health KPI Dashboard in Excel?
-
Comprehensive KPI Tracking: Monitor key financial metrics like profitability, liquidity, and solvency ratios.
-
Profitability & Cost Analysis: Track net profit margin, return on assets, and return on equity.
-
Cash Flow Management: Track cash flow metrics to ensure financial liquidity.
-
Debt & Risk Assessment: Measure debt ratios and assess financial risks.
-
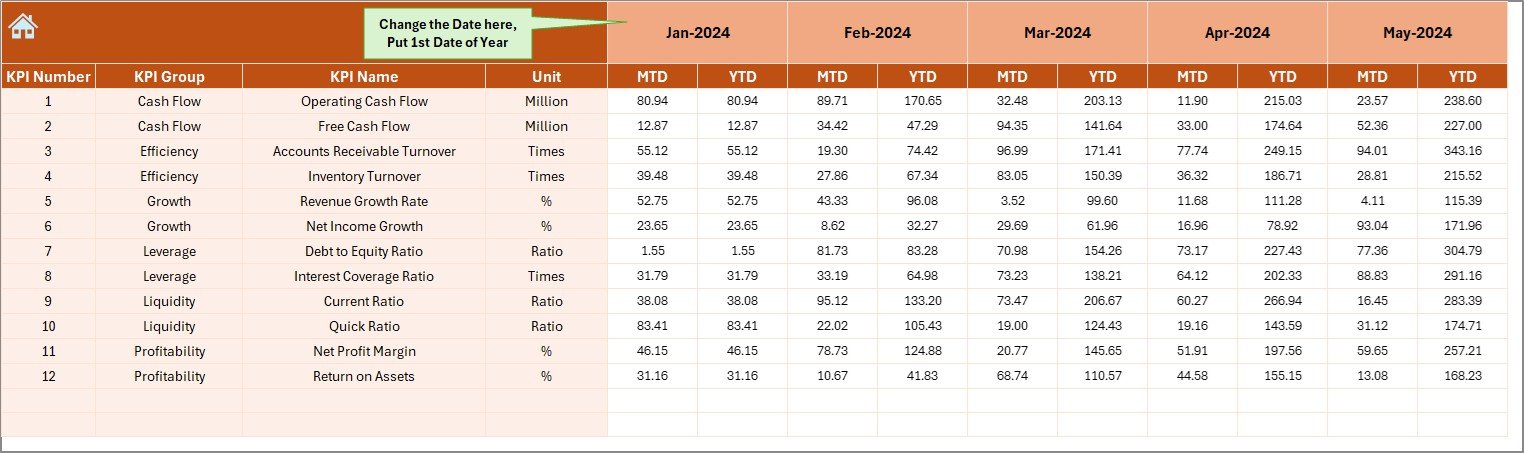
Time-Based Performance Monitoring: Track financial performance over various time periods.
-
Customizable Dashboard: Adjust the dashboard to track the most relevant KPIs for your business.
How to Use the Finance and Accounting Financial Health KPI Dashboard in Excel
1️⃣ Download the Template: Access the Finance and Accounting Financial Health KPI Dashboard in Excel instantly.
2️⃣ Input Financial Data: Enter your company’s financial data, including balance sheets, income statements, and cash flow statements.
3️⃣ Monitor KPIs & Performance: Track key financial metrics such as profitability, liquidity, and debt ratios.
4️⃣ Analyze Trends & Data: Use time-based analysis to evaluate trends and identify financial opportunities or risks.
5️⃣ Make Data-Driven Decisions: Use insights from the dashboard to improve profitability, reduce costs, and enhance financial performance.
Who Can Benefit from the Finance and Accounting Financial Health KPI Dashboard in Excel?
🔹 Finance Managers & Accountants
🔹 Business Owners & Founders
🔹 CFOs & Financial Analysts
🔹 Small & Medium Enterprises (SMBs)
🔹 Large Corporations
🔹 Investors & Stakeholders
🔹 Financial Consultants & Advisors
Track and optimize your company’s financial health with the Finance and Accounting Financial Health KPI Dashboard in Excel. Gain insights into your organization’s financial performance, improve cash flow management, and make data-driven decisions to ensure long-term profitability and growth.
Click here to read the Detailed blog post
Visit our YouTube channel to learn step-by-step video tutorials
Youtube.com/@PKAnExcelExpert


Reviews
There are no reviews yet.