
The film and television industry is one of the most dynamic, creative, and competitive spaces in the world. While creativity drives stories, performance measurement drives business success. Studios, broadcasters, and streaming platforms all rely on hard numbers—box office earnings, ratings, advertising revenue, production efficiency, and audience engagement—to evaluate success. Without a structured system, this data becomes scattered across spreadsheets, reports, and manual trackers, making decision-making slow and error-prone.
That’s why the Film and Television KPI Dashboard in Excel is a game-changer. Designed for media organizations of all sizes, this pre-built Excel template provides an interactive, centralized, and easy-to-use solution to track your most important Key Performance Indicators (KPIs). Whether you’re monitoring film revenues, TV show ratings, streaming subscriptions, or production costs, this dashboard brings everything into one place—fast, visual, and accurate.
✨ Key Features of the Film and Television KPI Dashboard
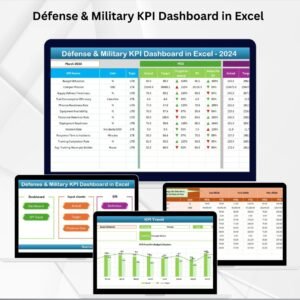
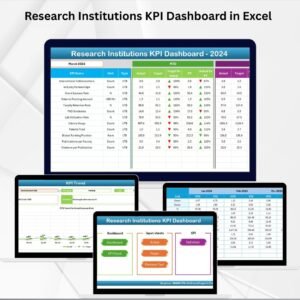
🏠 Home Sheet – Navigation Hub
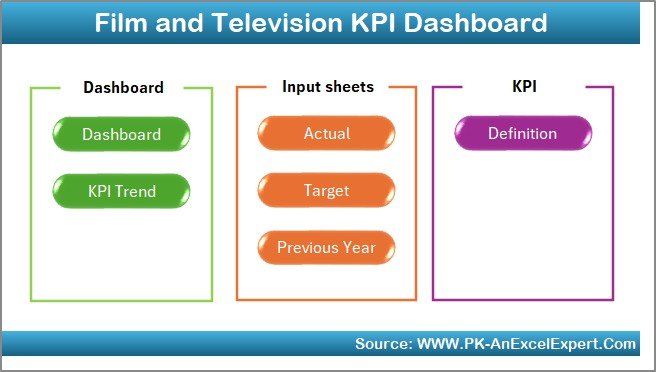
The Home Sheet acts as your control center. It includes six navigation buttons that take you directly to different sections of the dashboard (Dashboard, KPI Trend, Actual Numbers, Target, Previous Year, and KPI Definition). This makes navigating data simple and efficient, eliminating endless scrolling.
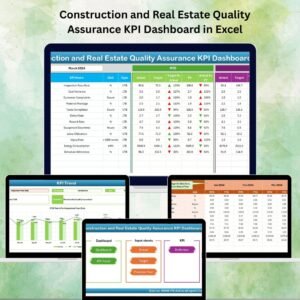
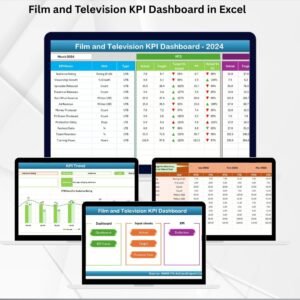
📊 Dashboard Sheet – Performance Snapshot
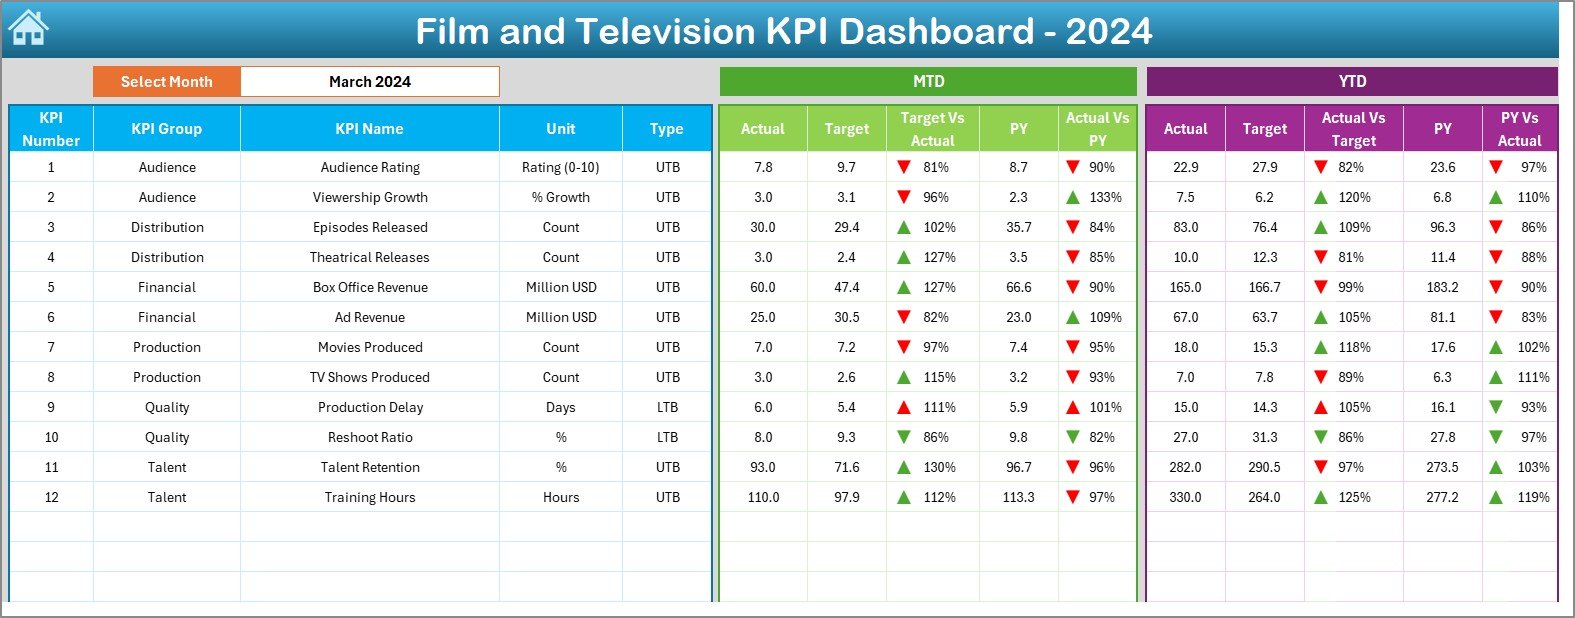
The Dashboard Sheet is the heart of the system. From a drop-down menu in cell D3, select any month, and instantly see all KPIs update. Key features include:
-
MTD (Month-to-Date) and YTD (Year-to-Date) results.
-
Comparisons across Actual, Target, and Previous Year values.
-
Conditional formatting with arrows: green for meeting/exceeding targets, red for underperformance.
This sheet provides executives with a one-page summary of organizational health at any given time.
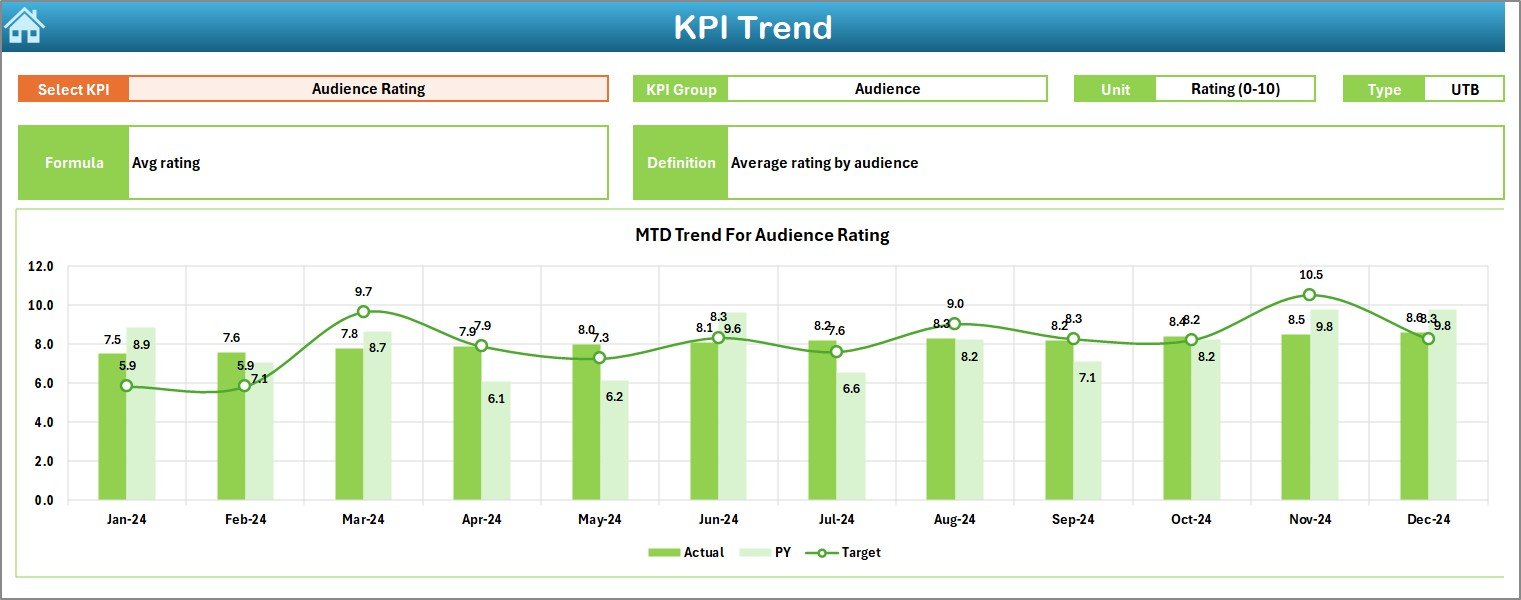
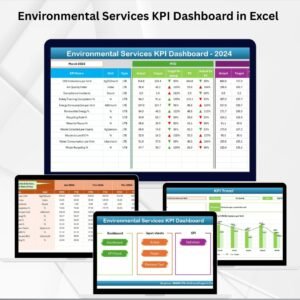
📈 KPI Trend Sheet – Deeper Insights
Select a KPI from a drop-down (cell C3) and view its performance across time. Details include:
-
KPI Group (Audience, Financial, Production, etc.).
-
KPI Unit (e.g., %, revenue in $).
-
KPI Type (UTB = Upper the Better or LTB = Lower the Better).
-
Formula and Definition.
Dynamic trend charts compare Actuals, Targets, and Previous Year figures, helping you spot long-term trends and seasonal patterns.
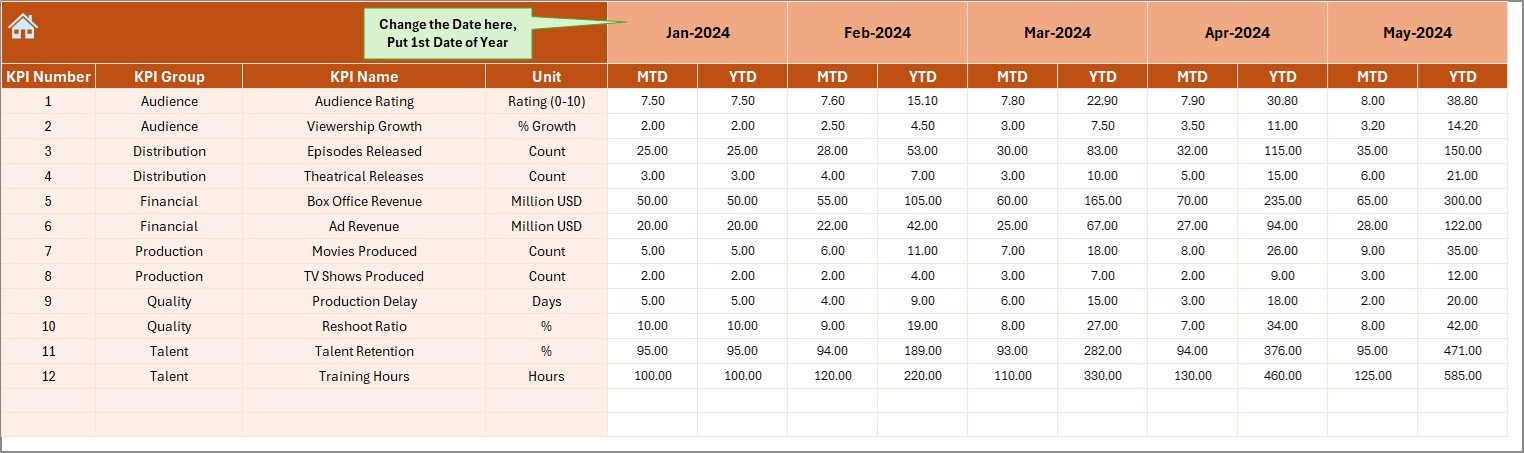
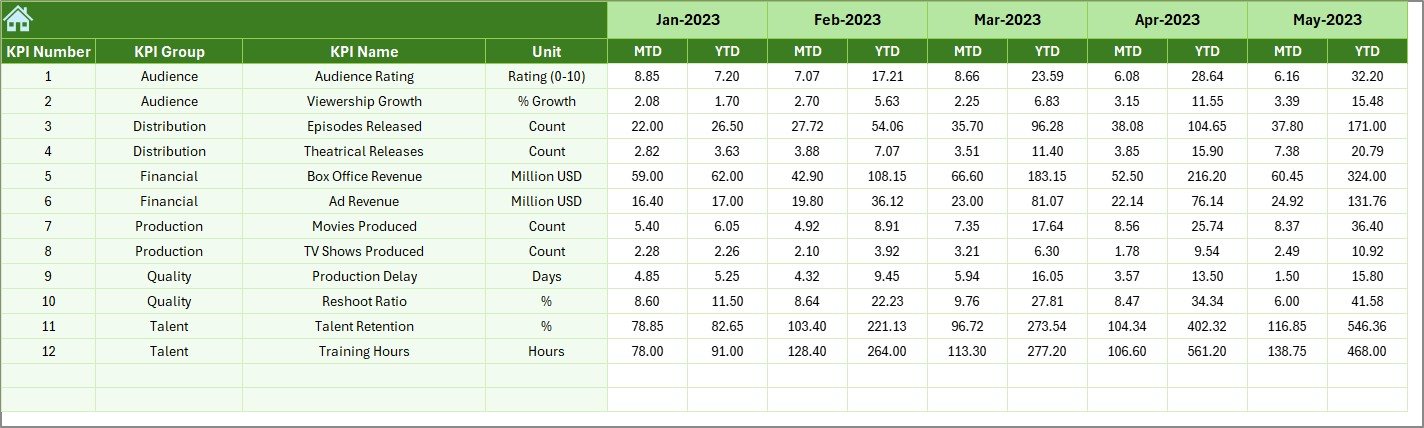
📝 Actual Numbers Input Sheet – Data Entry Made Easy
This is where real monthly performance numbers are entered. A flexible starting month option (cell E1) allows customization. Once updated, data automatically flows into the Dashboard and KPI Trend sheets—no duplicate entry required.
🎯 Target Sheet – Goal Setting
Here you define monthly and yearly targets for each KPI. These serve as benchmarks against which actuals are compared. For example, you may set a monthly advertising revenue target or a show rating goal.
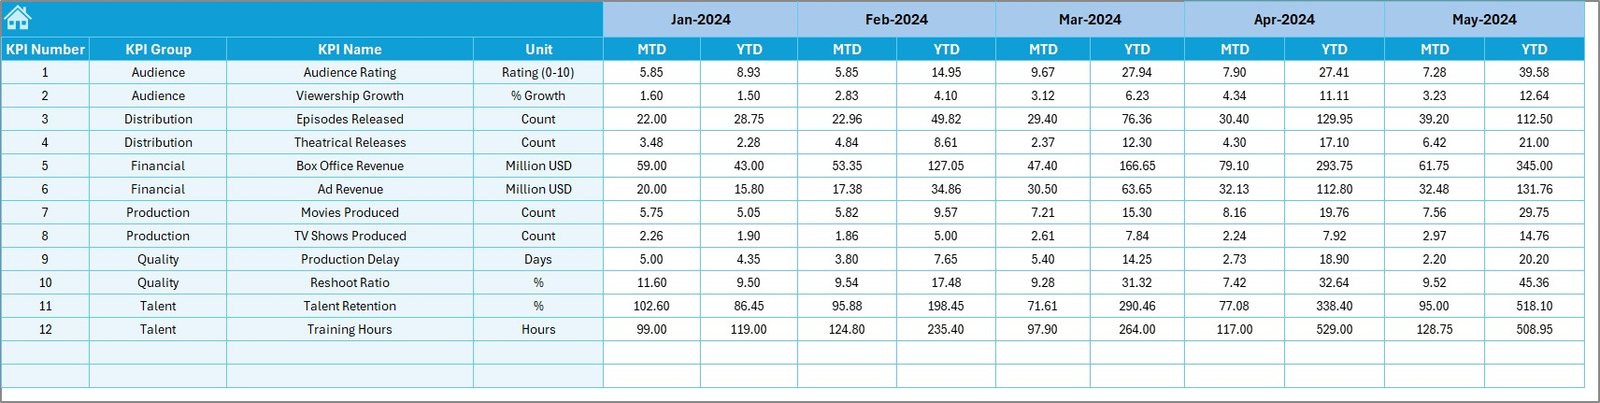
📂 Previous Year Numbers Sheet – Benchmarking Growth
This sheet stores historical data from the previous year. It enables year-over-year comparisons, so you can see if your productions and projects are growing, stagnating, or declining.
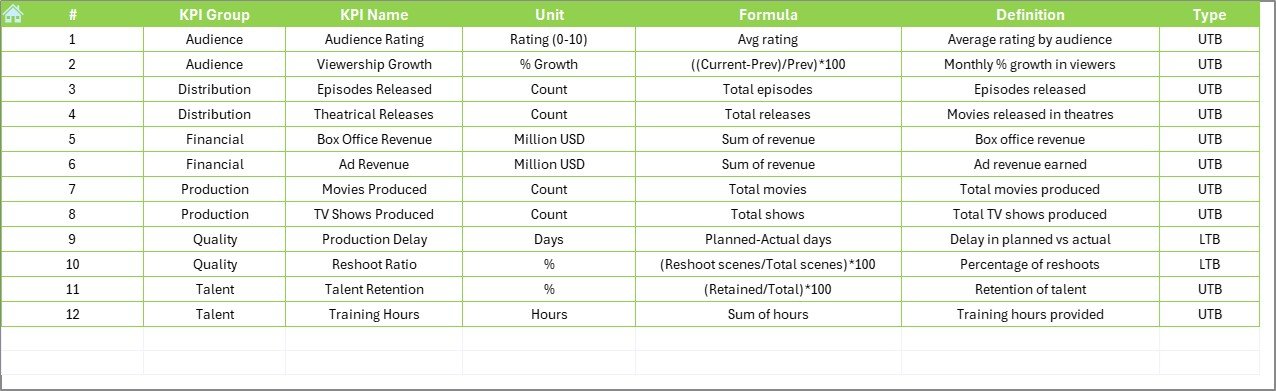
📘 KPI Definition Sheet – Clarity and Consistency
To avoid confusion, this sheet contains the definitions, formulas, and groupings for every KPI. New KPIs can be added here, making the dashboard expandable and adaptable to evolving business needs.
👥 Who Can Benefit from This Dashboard?
-
🎬 Film Production Houses – Monitor box office revenue, production costs, and advertising ROI.
-
📺 Television Networks – Track audience ratings, ad revenue, and program costs.
-
💻 Streaming Platforms – Measure subscription growth, content engagement, and churn.
-
📊 Marketing & Distribution Teams – Compare campaign effectiveness and audience impact.
-
🎥 Independent Producers – Gain insights into project budgets and profitability.
🌟 Advantages of the Film and Television KPI Dashboard
-
✅ Centralized Data – No more juggling multiple spreadsheets.
-
✅ Time-Saving – Automated calculations and comparisons.
-
✅ Clear Visibility – MTD and YTD insights at a glance.
-
✅ Comparative Analysis – Track Actual vs. Target vs. Previous Year.
-
✅ Industry-Specific KPIs – Tailored for film, TV, and streaming.
-
✅ User-Friendly – No advanced Excel skills needed.
-
✅ Customizable – Add or remove KPIs as per your requirements.
🚀 Opportunities for Improvement
-
🔄 Automate data entry with VBA macros.
-
☁️ Enable cloud-based collaboration (OneDrive/Google Sheets).
-
📡 Integrate with streaming or finance systems for real-time updates.
-
📊 Add advanced visuals with Power BI or Tableau.
-
🔒 Secure sensitive financial or production data with Excel password protection.
📌 Best Practices
-
Update data monthly for accuracy.
-
Standardize KPI definitions across teams.
-
Compare at least 2–3 years of data for context.
-
Keep dashboards clean—focus on critical KPIs.
-
Balance quantitative insights with qualitative feedback.
🎯 Conclusion
The Film and Television KPI Dashboard in Excel is more than a spreadsheet—it’s a decision-making tool. By consolidating financial, audience, and production KPIs into a single interactive platform, it gives media leaders the clarity to act quickly and confidently. Whether you’re a studio, network, or streaming service, this dashboard helps ensure that your creativity translates into measurable success.


Reviews
There are no reviews yet.