


In the age of digital branding, your employees are not just team members — they are your most authentic brand ambassadors 💪. The Employee Advocacy KPI Dashboard in Power BI transforms this potential into measurable, data-driven success. Designed for HR, Marketing, and Communications teams, this dashboard empowers organizations to track, analyze, and amplify employee-driven brand engagement with ease.Employee Advocacy KPI Dashboard in Power BI
With real-time visualizations, interactive filters, and smart performance tracking, this ready-to-use Power BI template provides everything you need to measure advocacy, engagement, and reach — all from a single dashboard.
⚙️ Key Features of Employee Advocacy KPI Dashboard in Power BI
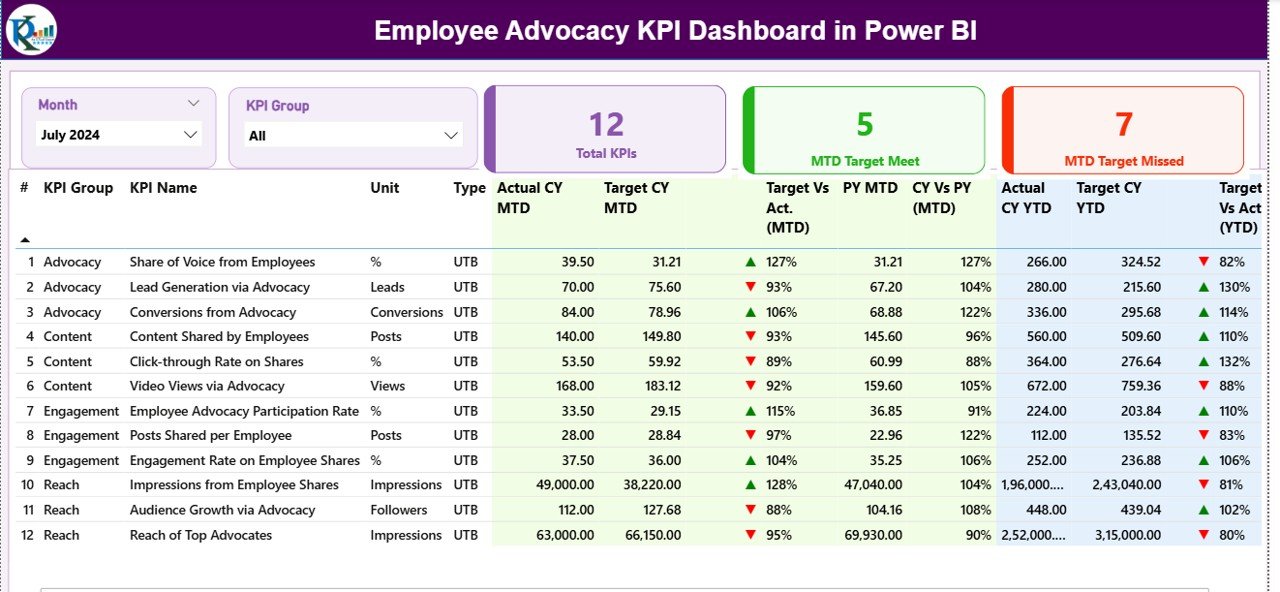
✨ All-in-One Performance View: Track all advocacy metrics including Total Posts, Engagements, Reach, and Top Advocates from one intuitive summary page.
📊 Dynamic KPI Analysis: Compare MTD vs YTD performance, visualize trends, and spot underperforming areas with interactive charts and conditional formatting arrows.
🎯 Actual vs Target Insights: Evaluate progress against defined goals and analyze variance with clear visual indicators.
⚡ Automated Data Refresh: Eliminate manual work — Power BI automatically updates your reports using live connections or scheduled refreshes.
💡 Customizable Layout: Add or modify KPIs, pages, and filters to suit your organization’s unique advocacy strategy.
🧠 Data Transparency: View KPI definitions, formulas, and calculation logic directly from the dashboard for clarity and accuracy.
📱 Multi-Device Access: Monitor advocacy data anytime, anywhere — from desktops, tablets, or smartphones.
🏆 Top Advocates Recognition: Identify and reward employees contributing most to brand awareness.
📦 What’s Inside the Employee Advocacy KPI Dashboard in Power BI
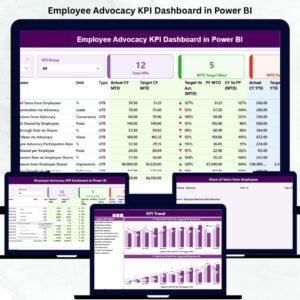
This professional Power BI template includes 7 powerful pages, each crafted for decision-making clarity:
1️⃣ Summary Page – A central hub showing overall performance metrics and navigation buttons.
2️⃣ KPI Trend Page – Interactive analysis of KPIs by month, department, or region.
3️⃣ KPI Definition Page – Displays KPI group, formula, definition, and MTD/YTD trends.
4️⃣ Input_Actual Sheet – Stores monthly actual KPI data.
5️⃣ Input_Target Sheet – Holds benchmark target values for comparison.
6️⃣ KPI Definition Sheet – Contains metadata for accurate calculations.
7️⃣ Dashboard Navigation System – Allows one-click access between analytical pages.
Each element is designed for simplicity, accuracy, and real-time decision-making — enabling managers to focus on strategy, not spreadsheets.
🧭 How to Use the Employee Advocacy KPI Dashboard in Power BI
🚀 Step 1: Import your organization’s data into the Input_Actual and Input_Target sheets.
📅 Step 2: Use the Month Selector to switch between MTD and YTD performance.
📈 Step 3: Review Actual vs Target and PY comparisons using up/down arrow visuals.
🧩 Step 4: Explore KPI trends to identify top-performing employees or departments.
🎁 Step 5: Customize visuals, filters, or slicers based on your advocacy objectives.
💬 Step 6: Share the dashboard with HR or marketing teams for collaboration and real-time decision-making.
With just a few clicks, you’ll transform employee engagement data into actionable advocacy insights!
👥 Who Can Benefit from This Employee Advocacy KPI Dashboard in Power BI
💼 Marketing Teams: Measure how employee engagement boosts brand visibility.
🧍♂️ HR Departments: Monitor participation, recognize top advocates, and build stronger culture.
📢 Communication Managers: Track campaign reach and storytelling effectiveness.
📊 Executives & Decision Makers: Get clear advocacy insights to guide corporate branding strategies.
🌐 Social Media Managers: Understand which employees drive maximum impact across platforms.
🏢 Large Enterprises & Startups: Scale your advocacy tracking for any organization size.
This dashboard isn’t just a report — it’s a brand amplification tool that turns your workforce into your strongest marketing asset.


Reviews
There are no reviews yet.