
Managing multiple education-related projects? 📅 Stay ahead with the Education and Learning Project Timeline KPI Dashboard in Excel—a powerful, easy-to-use tool that helps you track project progress, monitor KPIs, and ensure everything is running on time. Whether you’re overseeing curriculum development, faculty training, or digital learning initiatives, this dashboard gives you a full view of milestones, monthly performance, and long-term trends—all in one file.
Designed for school administrators, educators, coordinators, and consultants, this Excel-based solution simplifies complex data into clear visuals and strategic insights.
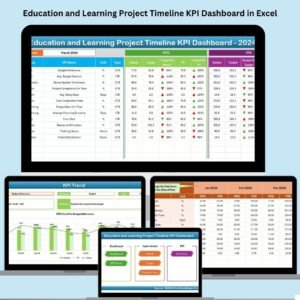
✨ Key Features of Project Timeline KPI Dashboard
🏠 Home Sheet – Your Navigation Hub
-
One-click buttons to jump to different dashboard sections
-
Easy access to KPI visualizations, trend analysis, and data input sheets
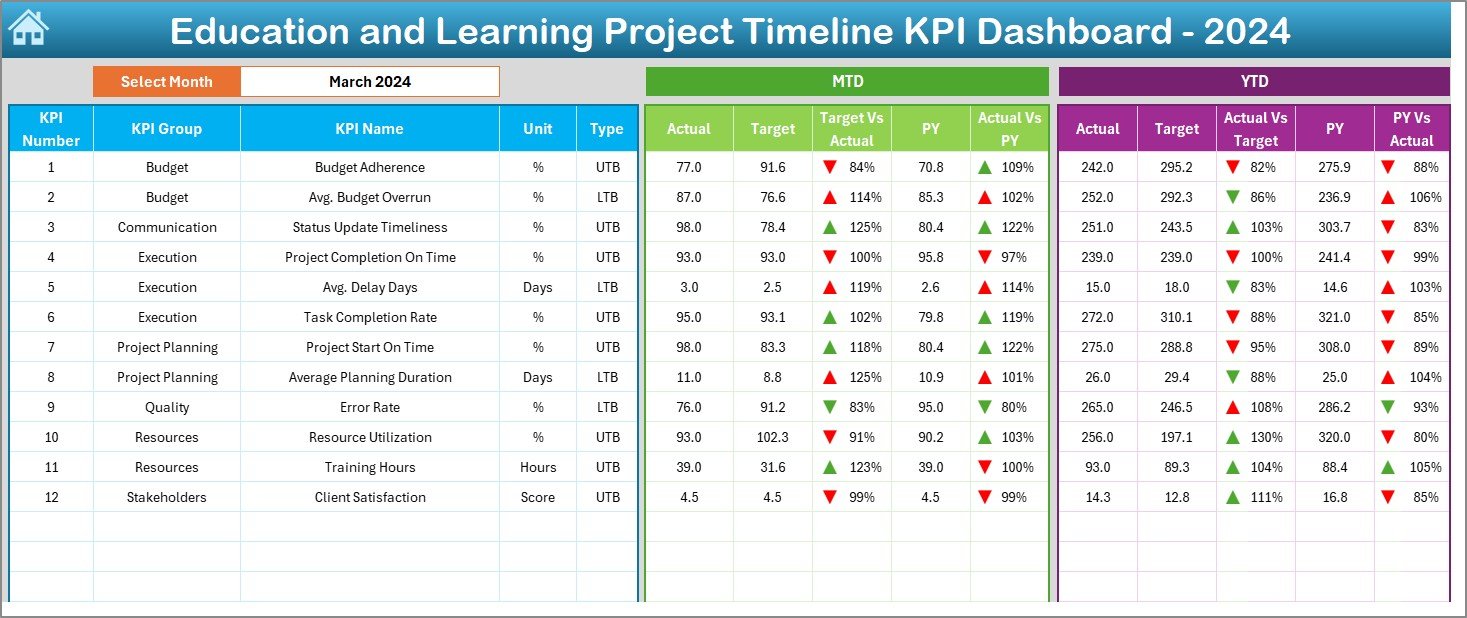
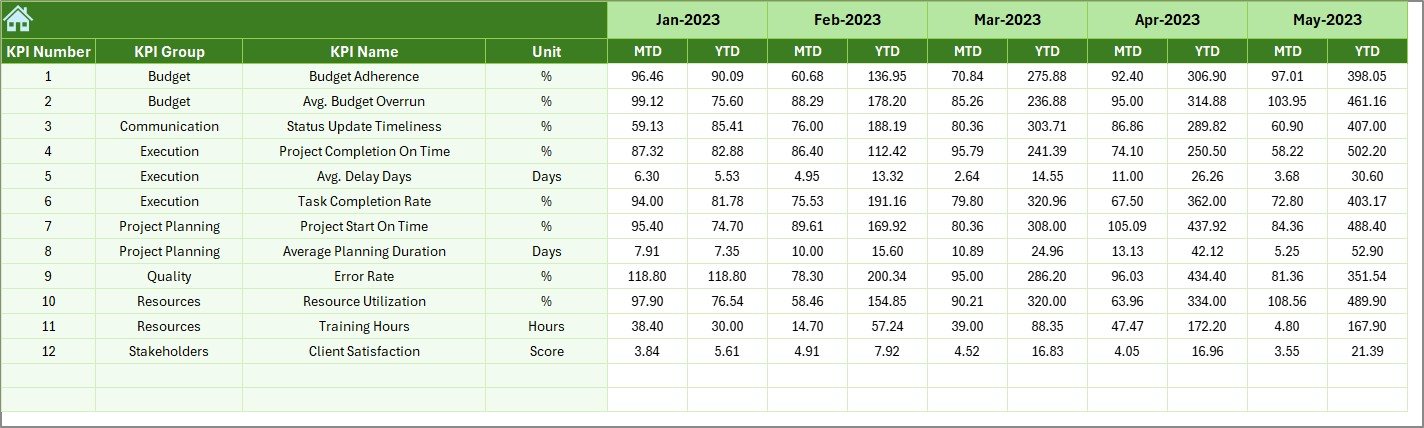
📊 Dashboard Sheet – Monthly KPI Snapshot
-
Select any month via dropdown to view data
-
MTD (Month-To-Date), YTD (Year-To-Date), and PY (Previous Year) metrics
-
Up/down arrows for quick performance status checks
-
Target vs Actual vs PY comparisons in a single view
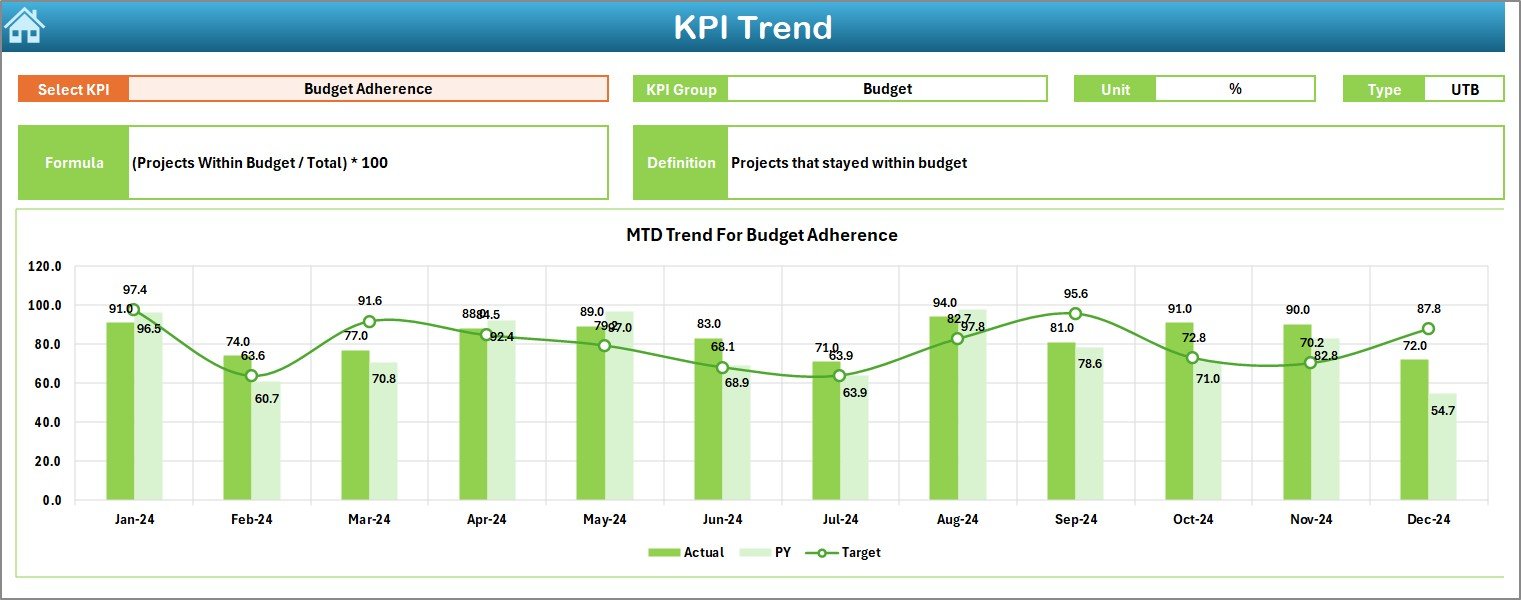
📈 KPI Trend Sheet – Track Long-Term Progress
-
Select KPI from a dropdown menu
-
Review month-over-month performance
-
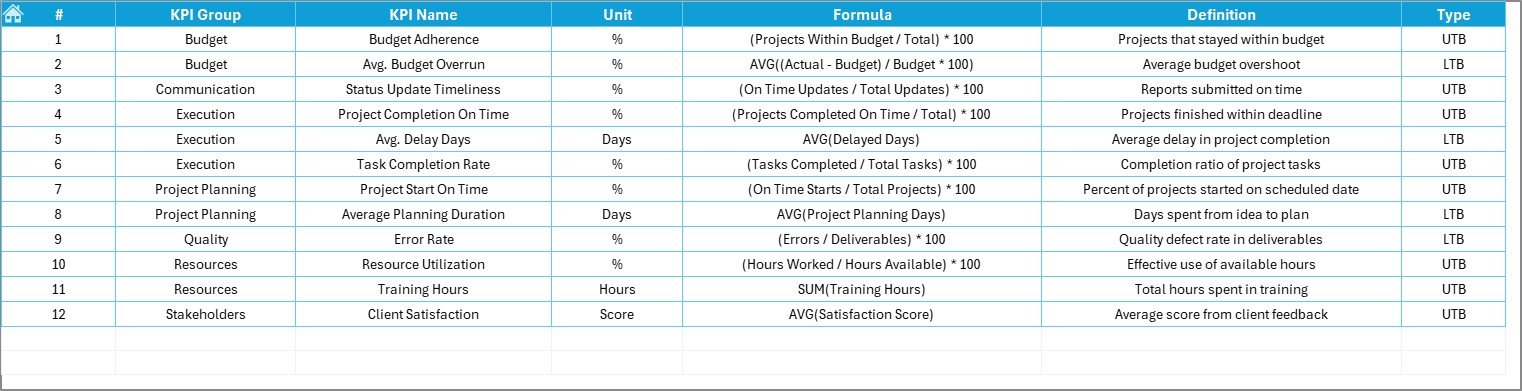
View detailed metadata including:
✔ KPI Group
✔ Unit
✔ Type (UTB or LTB)
✔ Formula & Definition
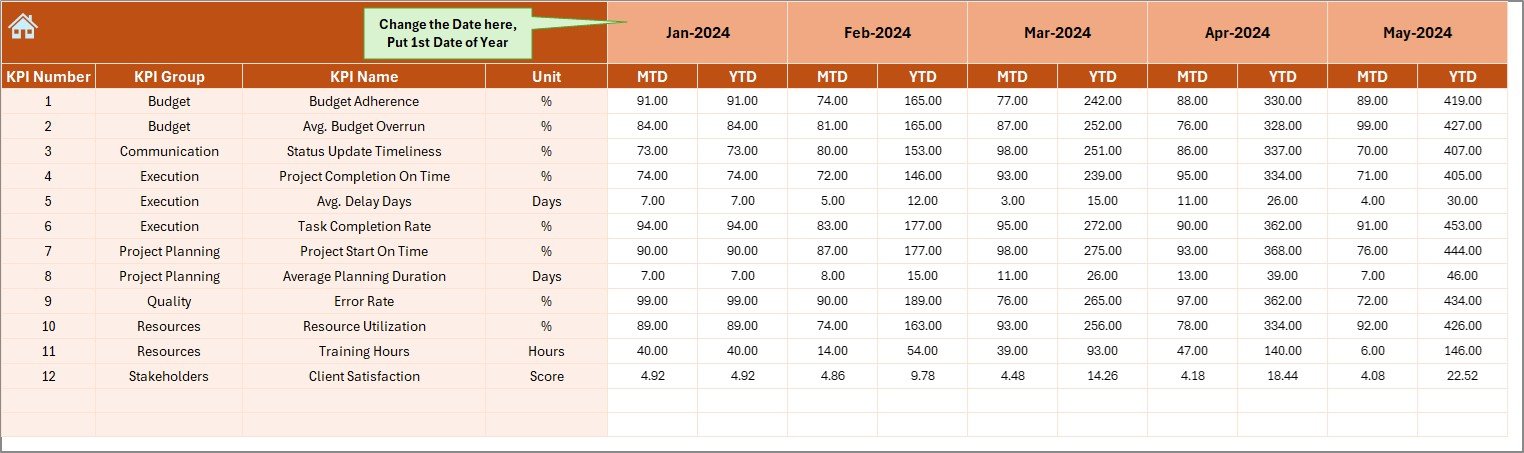
🧾 Actual Numbers Input Sheet – Easy Data Entry
-
Set the first month in cell E1
-
Add MTD/YTD values monthly
-
The dashboard auto-updates with every change
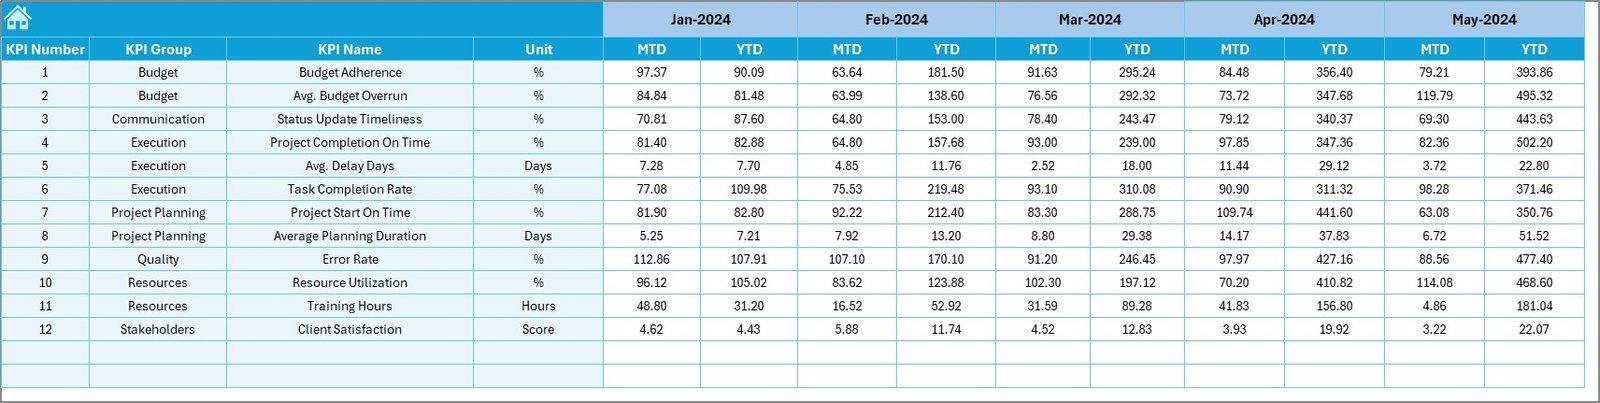
🎯 Target Sheet – Define Your Goals
-
Set monthly and annual targets for each KPI
-
Helps teams stay aligned and accountable
🔁 Previous Year Sheet – Benchmark Your Success
-
Add historical values to compare performance YoY
-
Instantly view progress and gaps
📘 KPI Definition Sheet – Full KPI Documentation
-
Keep everyone aligned on metric meaning and formulas
-
Clearly defined KPIs grouped by category for easy reference
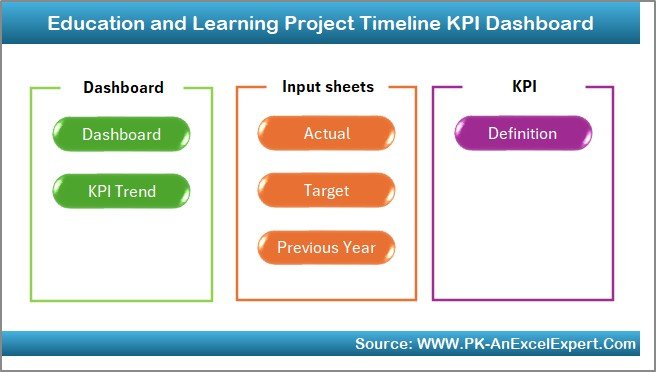
📂 What’s Inside the Dashboard Template
✅ 7 Well-Organized Sheets
-
Home Sheet
-
Dashboard (Visual Summary)
-
KPI Trend Sheet
-
Actual Numbers Input Sheet
-
Target Sheet
-
Previous Year Sheet
-
KPI Definition Sheet
All sheets are linked dynamically to automate tracking and visualization.
🛠️ How to Use the Dashboard
👉 Step 1: Set Your Timeline Start
In the Actual Numbers Input Sheet, choose the start month (cell E1).
👉 Step 2: Input Actuals and Targets
Add monthly values to the input and target sheets.
👉 Step 3: Benchmark with Previous Year
Paste in last year’s performance to the comparison sheet.
👉 Step 4: Select Month on Dashboard
Choose a month to review MTD/YTD stats and KPI visuals.
👉 Step 5: Analyze Trends and Take Action
Use the KPI Trend Sheet to identify strengths, bottlenecks, and opportunities.
👥 Who Can Benefit from This Dashboard?
🏫 School Administrators – Track institutional goals and key projects
📚 Educators – Monitor progress of academic programs
📈 Education Project Managers – Stay on top of milestones and delays
💻 E-learning Coordinators – Evaluate digital rollouts and adoption rates
🧑🏫 Academic Consultants – Report on impact metrics and timelines
This dashboard works perfectly for education institutions, training organizations, NGOs, and private learning centers.
🔧 Customization Tips to Match Your Needs
🎨 Add your logo and brand colors to the Home Sheet
📌 Adjust KPI groups to match your curriculum structure or initiatives
📈 Add new charts for focus areas like delays or high performers
⚠️ Use conditional formatting to highlight underperforming KPIs
📊 Insert pivot tables for more department-specific reporting
✅ Click here to read the Detailed blog post
🔗 Visit our YouTube channel to learn step-by-step video tutorials


Reviews
There are no reviews yet.