The EdTech KPI Dashboard in Excel is a powerful tool designed for educational technology providers, online learning platforms, and educational institutions that want to track, analyze, and optimize the performance of their digital learning initiatives. This customizable dashboard helps you monitor key performance indicators (KPIs) such as student engagement, course completion rates, learning outcomes, and revenue, allowing you to evaluate and improve the effectiveness of your e-learning programs.
With real-time data tracking and comprehensive reporting, this Excel-based dashboard provides insights into various aspects of your EdTech business, enabling you to make data-driven decisions, enhance learning experiences, and maximize ROI. Whether you’re managing online courses, e-learning platforms, or corporate training programs, the EdTech KPI Dashboard in Excel is an essential tool for optimizing the performance of your educational technology initiatives.
Key Features of the EdTech KPI Dashboard in Excel
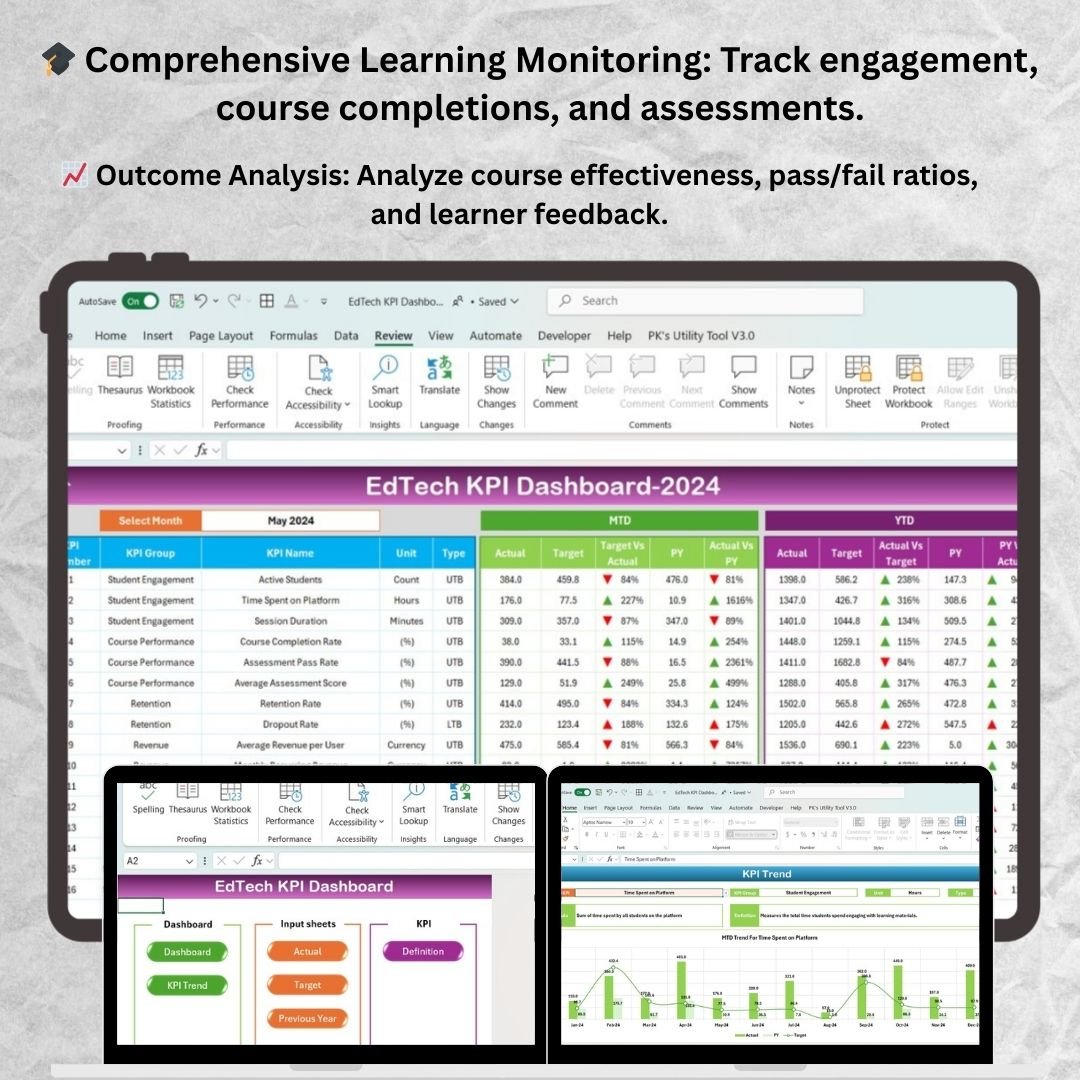
🎓 Comprehensive Learning Performance Monitoring
Track KPIs related to student engagement, course completions, drop-off rates, and assessment results. Gain a clear view of how learners are performing across all your courses.
⚡ Real-Time Student Engagement Tracking
Monitor learner participation and engagement in real-time. Identify active users, drop-off points, and at-risk students, enabling you to take immediate corrective actions to boost engagement.
📈 Course Completion & Outcome Analysis
Analyze course completion rates, pass/fail ratios, and learning outcomes to assess the effectiveness of your courses and identify areas that need improvement.
📅 Customizable KPIs for EdTech Platforms
Easily adjust the dashboard to track KPIs specific to your EdTech business, whether it’s focusing on course ratings, learner retention, or revenue generation.
🖥️ Interactive & User-Friendly Interface
The Excel dashboard is intuitive and easy to navigate, offering interactive charts, filters, and slicers to drill down into specific data points and track your EdTech program’s performance effectively.
Why You’ll Love the EdTech KPI Dashboard in Excel
✅ Track Student Performance & Engagement
Monitor student engagement and performance in real-time, helping you identify at-risk students and improve course content to enhance learner outcomes.
✅ Optimize Course Offerings
Analyze course completion rates, learner feedback, and learning outcomes to continuously optimize your courses, improve content delivery, and increase student satisfaction.
✅ Improve Learner Retention
Identify patterns in student engagement and completion rates to develop strategies for improving learner retention and reducing drop-off rates.
✅ Make Data-Driven Decisions
Leverage the insights from the dashboard to make informed decisions about course development, pricing strategies, marketing efforts, and customer engagement.
✅ Maximize ROI for EdTech Programs
Track revenue, course sales, and student enrollments to maximize your program’s profitability and return on investment.
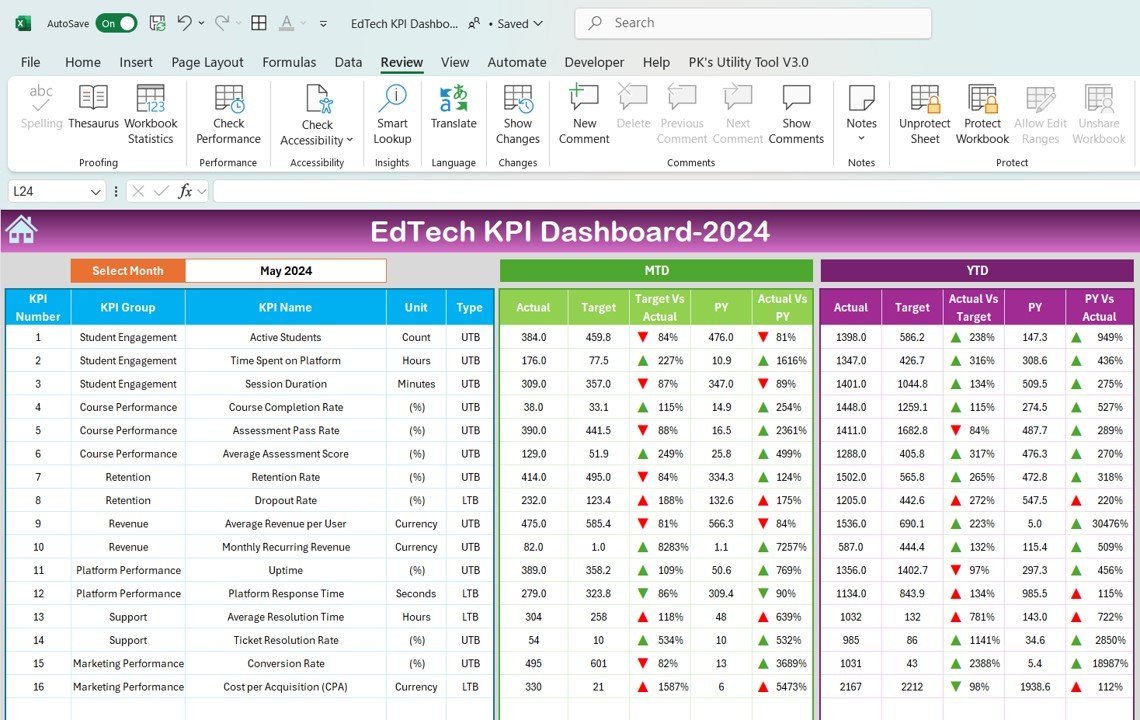
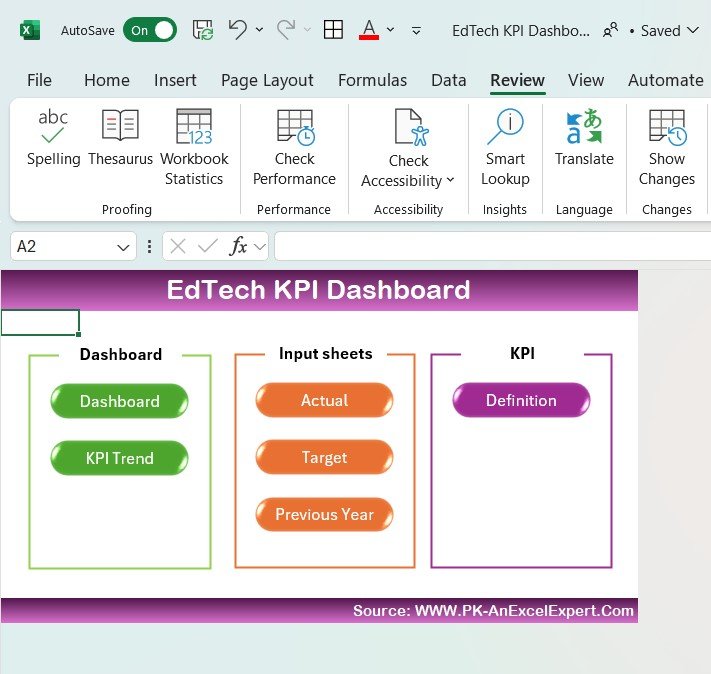
What’s Inside the EdTech KPI Dashboard Template?
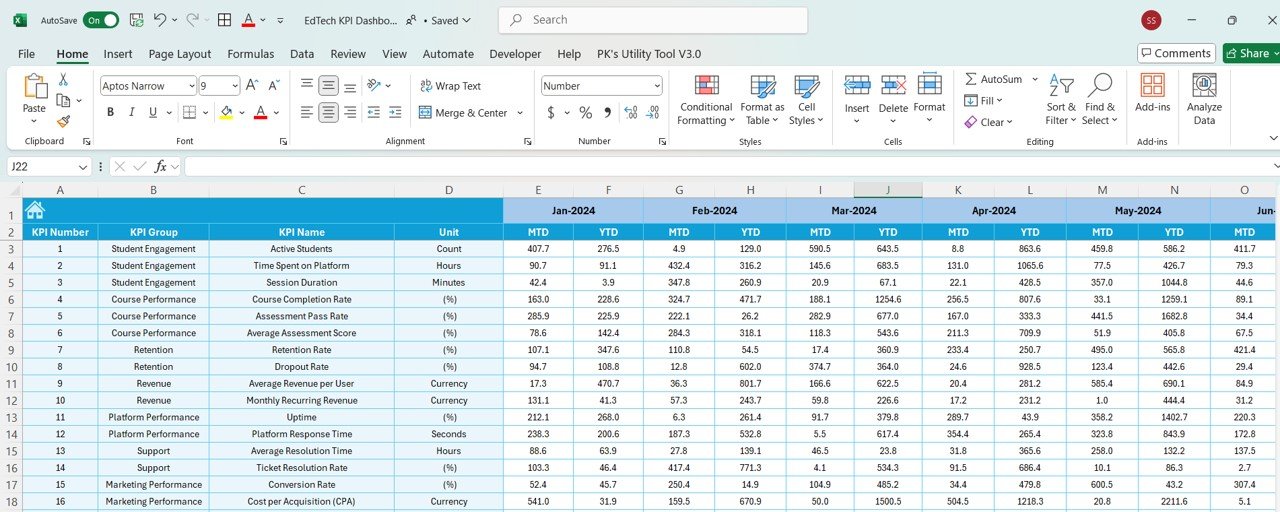
- Course Performance & Completion Tracking: Monitor course completion rates, student performance, and assessment scores.
- Learner Engagement Analysis: Track student interactions, participation, and active users.
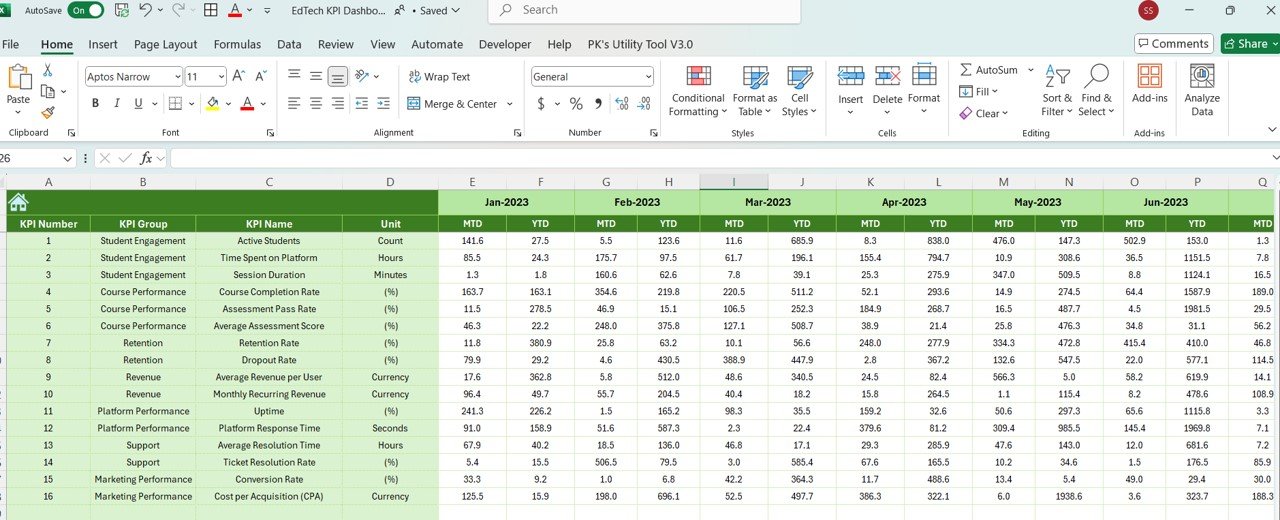
- Revenue & Enrollment Tracking: Visualize student enrollments, course sales, and revenue generation.
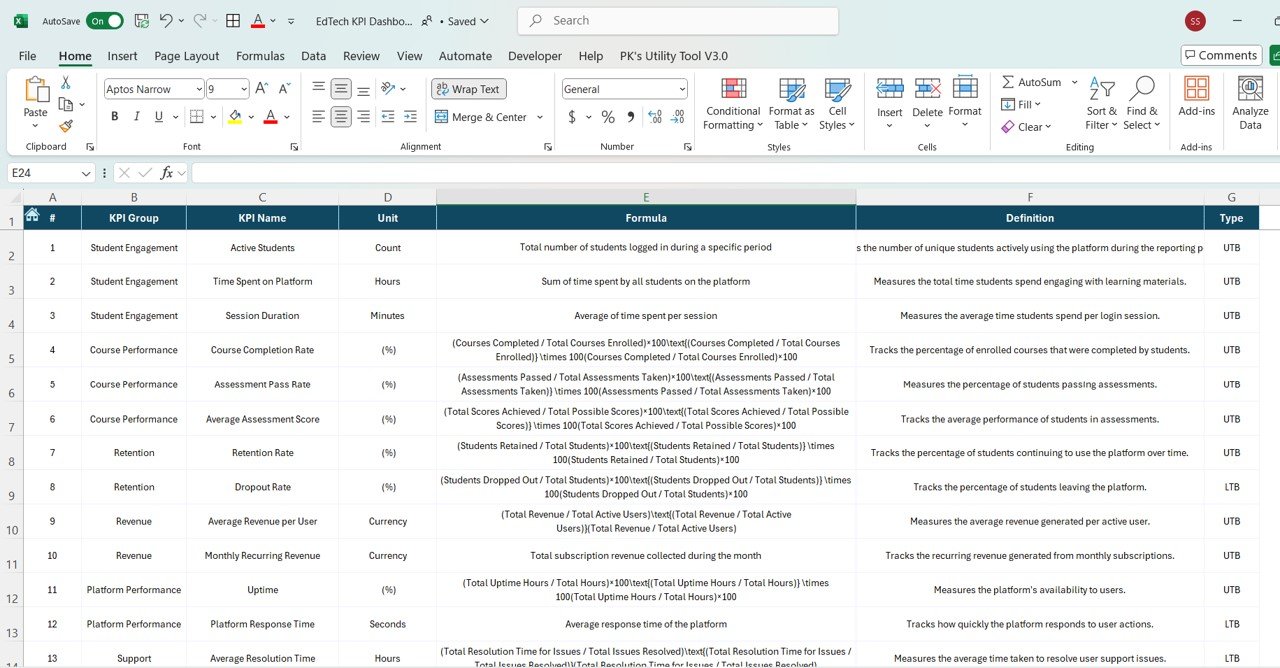
- Customizable KPIs: Adjust the dashboard to track specific EdTech metrics such as learner satisfaction, course ratings, or subscription renewals.
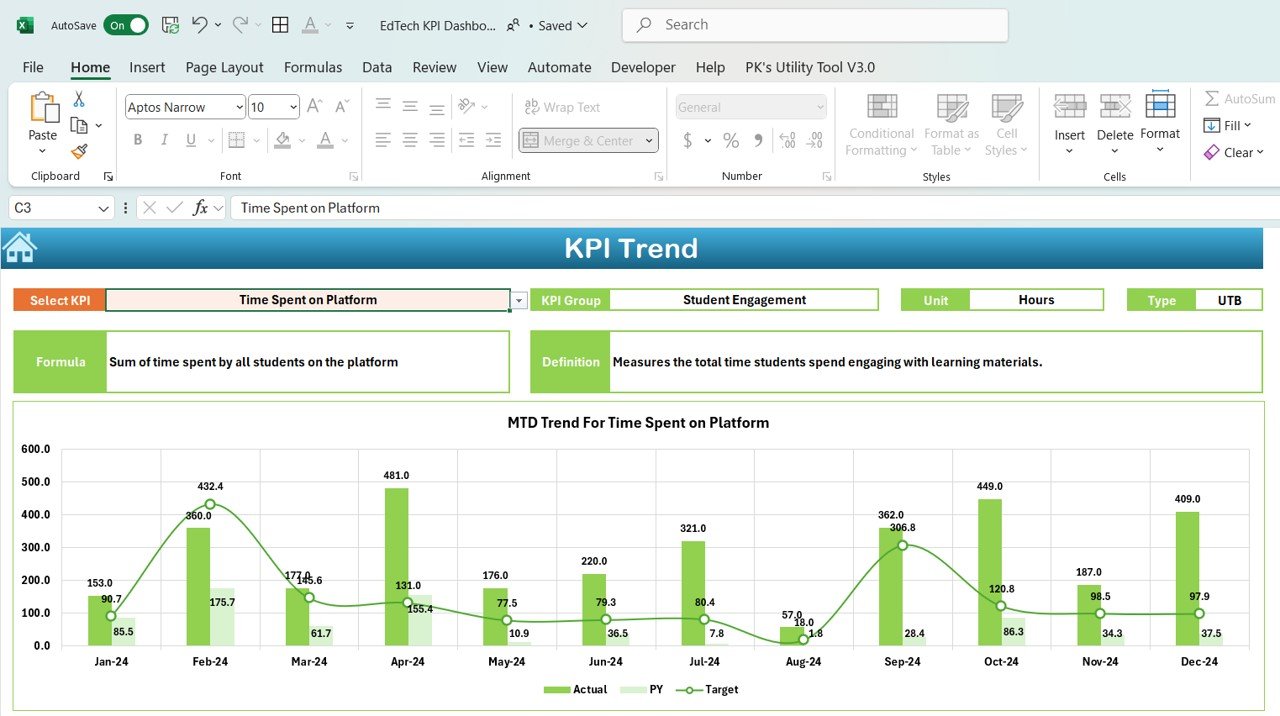
- Interactive Reporting: Use dynamic charts, filters, and slicers to analyze trends and make data-driven decisions.
How to Use the EdTech KPI Dashboard in Excel
1️⃣ Download the Template: Get instant access to your EdTech KPI Dashboard in Excel.
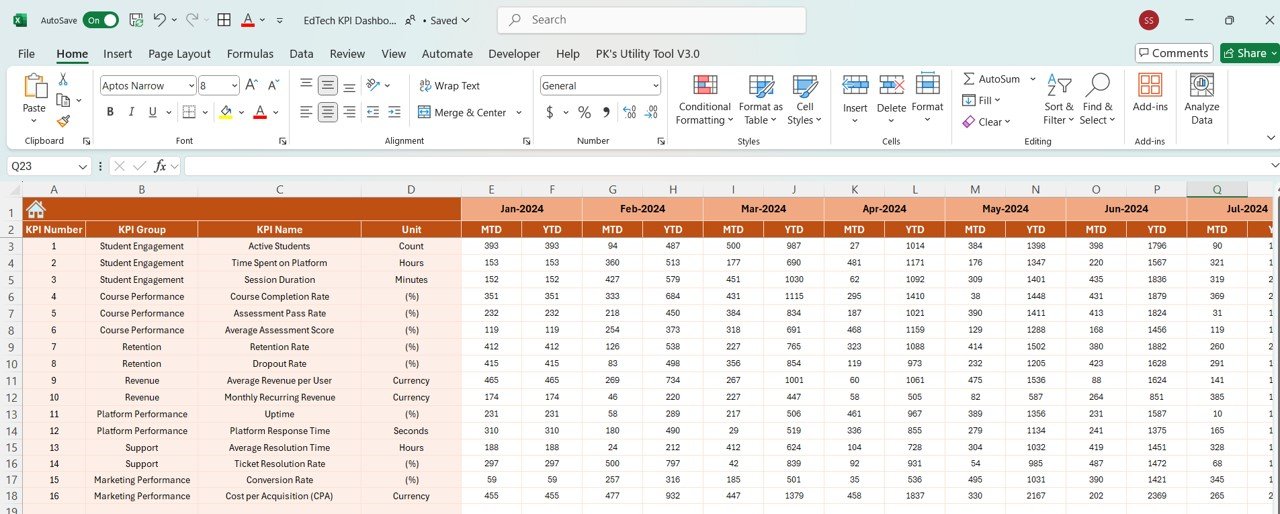
2️⃣ Input Course & Student Data: Enter data such as student enrollments, course completions, assessment results, and revenue.
3️⃣ Track & Monitor KPIs: Use the dashboard to monitor real-time performance across multiple EdTech programs.
4️⃣ Analyze & Optimize: Leverage insights from the dashboard to optimize course content, marketing strategies, and learner engagement.
Who Can Benefit from the EdTech KPI Dashboard in Excel?
🔹 EdTech Companies & Online Learning Platforms
🔹 Educational Institutions Offering Online Courses
🔹 Corporate Training Teams & Learning & Development Managers
🔹 E-Learning Content Creators & Educators
🔹 Business Owners & Entrepreneurs in Education
🔹 Data Analysts & Business Intelligence Professionals in Education
Track, analyze, and optimize your EdTech program’s performance with the EdTech KPI Dashboard in Excel. Monitor key performance metrics, improve learning outcomes, and boost engagement and revenue for your educational technology initiatives.
Click here to read the Detailed blog post
Visit our YouTube channel to learn step-by-step video tutorials
Youtube.com/@PKAnExcelExpert


Reviews
There are no reviews yet.