



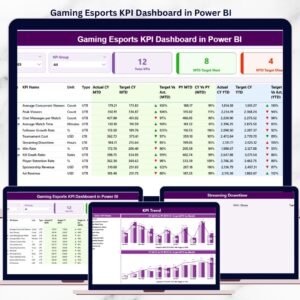
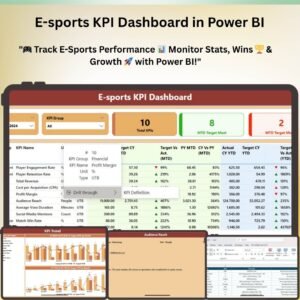
The E-Sports KPI Dashboard in Power BI is a cutting-edge tool designed to help e-sports teams, managers, and analysts track key performance indicators (KPIs) related to gaming performance, player statistics, and team dynamics. Whether you are managing a professional gaming team or analyzing data for your own e-sports endeavors, this dynamic dashboard allows you to monitor everything from individual player metrics to team-level performance, all in one place.
Power BI’s intuitive interface and powerful analytical features make it easy to transform raw data into actionable insights. This dashboard provides comprehensive visualizations of KPIs that matter most, including player performance, match statistics, win/loss ratios, and more. Whether you’re tracking metrics for strategy improvements, recruitment decisions, or competitive analysis, this tool gives you the edge to stay ahead in the competitive world of e-sports.

Key Features of the E-Sports KPI Dashboard:
🎮 Comprehensive Player & Team Metrics
Track individual player stats and overall team performance in one consolidated dashboard. From kills, deaths, and assists to win/loss ratios, the dashboard covers it all. This gives you a clear picture of each player’s contribution and the team’s overall success.
📊 Dynamic Data Visualizations
The dashboard includes various charts and graphs such as bar charts, pie charts, and trend lines that make it easy to visualize and analyze key data. It helps in tracking player performance over time, comparing stats between different players, and identifying performance trends.
🔢 Real-Time KPI Tracking
Monitor crucial metrics in real time, such as average match duration, player rankings, and match outcomes. With up-to-date data, you can quickly assess team performance and make data-driven decisions during tournaments or practice sessions.
🕹️ Match & Tournament Analysis
Break down performance by specific matches and tournaments. Analyze how your team performed across multiple events, and compare performance across different competitions to identify areas of improvement and refine strategies.
📅 Historical Data Comparison
Track your team’s performance over time by comparing historical data with current performance metrics. This feature helps you assess improvements, regression, and identify patterns across different seasons or tournaments.
⚙️ Customizable & Scalable
Tailor the dashboard to suit your team’s specific needs. Adjust the KPIs, player statistics, and match data according to your unique requirements. As your team grows and evolves, the dashboard can scale accordingly, providing valuable insights for every level of play.
Why You’ll Love This E-Sports KPI Dashboard:
✅ Maximizes Team Performance – Gain insights into player performance, identify strengths and weaknesses, and make data-driven decisions to improve your team’s chances of success. ✅ Improves Strategy & Tactics – With real-time tracking and performance trends, this dashboard allows managers to adapt strategies based on actionable insights. ✅ Easily Customizable – Customize KPIs and adjust the dashboard to fit the unique needs of your team or gaming organization. ✅ Enhances Recruitment & Player Development – Identify potential recruits by analyzing player statistics, or track progress and improvement of existing team members. ✅ User-Friendly Interface – Even non-technical users can easily navigate and use the dashboard for insights without advanced Power BI skills.
What’s Inside the E-Sports KPI Dashboard:
- Player Performance Overview – Analyze key player metrics such as kills, deaths, assists, and overall ranking.
- Team Performance Summary – Track win/loss ratios, average match length, and team rankings across different competitions.
- Match-by-Match Analysis – Detailed breakdown of match statistics and how each player performed during specific matches or tournaments.
- Historical Comparison – Compare your team’s performance over multiple tournaments and seasons.
- Custom KPIs – Add or adjust KPIs to match the specific needs of your e-sports team or organization.
How to Use the E-Sports KPI Dashboard:
1️⃣ Download the Dashboard – Get instant access to the Power BI file upon purchase. 2️⃣ Customize Player & Team Data – Enter your team’s data, player stats, and match results. 3️⃣ Analyze Performance – Track performance and KPIs in real-time, identifying patterns, strengths, and areas for improvement. 4️⃣ Make Informed Decisions – Use data-driven insights to improve gameplay, tactics, and recruitment strategies.
Who Can Benefit from This E-Sports KPI Dashboard?
- E-Sports Team Managers
- Professional Gamers & Coaches
- Gaming Analysts & Scouts
- E-Sports Organizations & Enterprises
- Competitive Gamers
- Gaming Recruitment Agencies
Stay ahead of the competition by leveraging this comprehensive KPI dashboard to monitor, analyze, and optimize your team’s performance in the fast-paced world of e-sports.
Click here to read the Detailed blog post
https://www.pk-anexcelexpert.com/e-sports-kpi-dashboard-in-power-bi/
Visit our YouTube channel to learn step-by-step video tutorials
Compatibility and Requirements
- Open the .pbix file in Power BI Desktop, which is free. Microsoft explains how to install it in Get Power BI Desktop.
- Enter your own team data, player stats and match results, as the steps above describe.
Frequently Asked Questions
What does the E-Sports KPI Dashboard track?
Player stats such as kills, deaths, assists and ranking, team win/loss ratios, average match length, team rankings, and match and tournament results.
Can I compare seasons or tournaments?
Yes. The historical comparison shows your team’s performance across tournaments and seasons.
Can I break results down by match?
Yes. The match-by-match analysis shows how each player performed in specific matches or tournaments.
Can I add my own KPIs?
Yes. You can add or adjust KPIs, player statistics and match data to fit your team.
Is there an Excel or Google Sheets version?
Yes. See the E-Sports KPI Dashboard in Excel and the E-sports KPI Dashboard in Google Sheets.
Related E-Sports and Gaming Templates
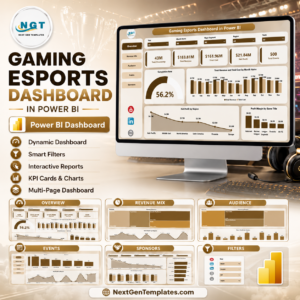
- Gaming Esports Dashboard in Power BI: a full gaming and esports dashboard
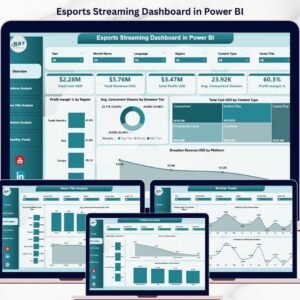
- Esports Streaming Dashboard in Power BI: track esports streaming
- Esports Team KPI Dashboard in Power BI: KPIs for one esports team
- E-Sports KPI Dashboard in Excel: the same topic in Excel
- Power BI Dashboard Mega Collection: 15 Power BI templates in one pack
Browse all Power BI KPI dashboard templates or the Power BI dashboard templates.



Reviews
There are no reviews yet.