In today’s evolving work culture, fostering diversity, equity, and inclusion (DEI) is no longer just a nice-to-have — it’s a strategic imperative. The Diversity and Inclusion KPI Dashboard in Power BI empowers HR teams, executives, and diversity officers with powerful data visualization tools to measure, monitor, and act on DEI performance indicators. Whether you’re launching a new initiative or auditing your progress, this dashboard gives you real-time insights that matter.
✨ Key Features of Diversity and Inclusion KPI Dashboard
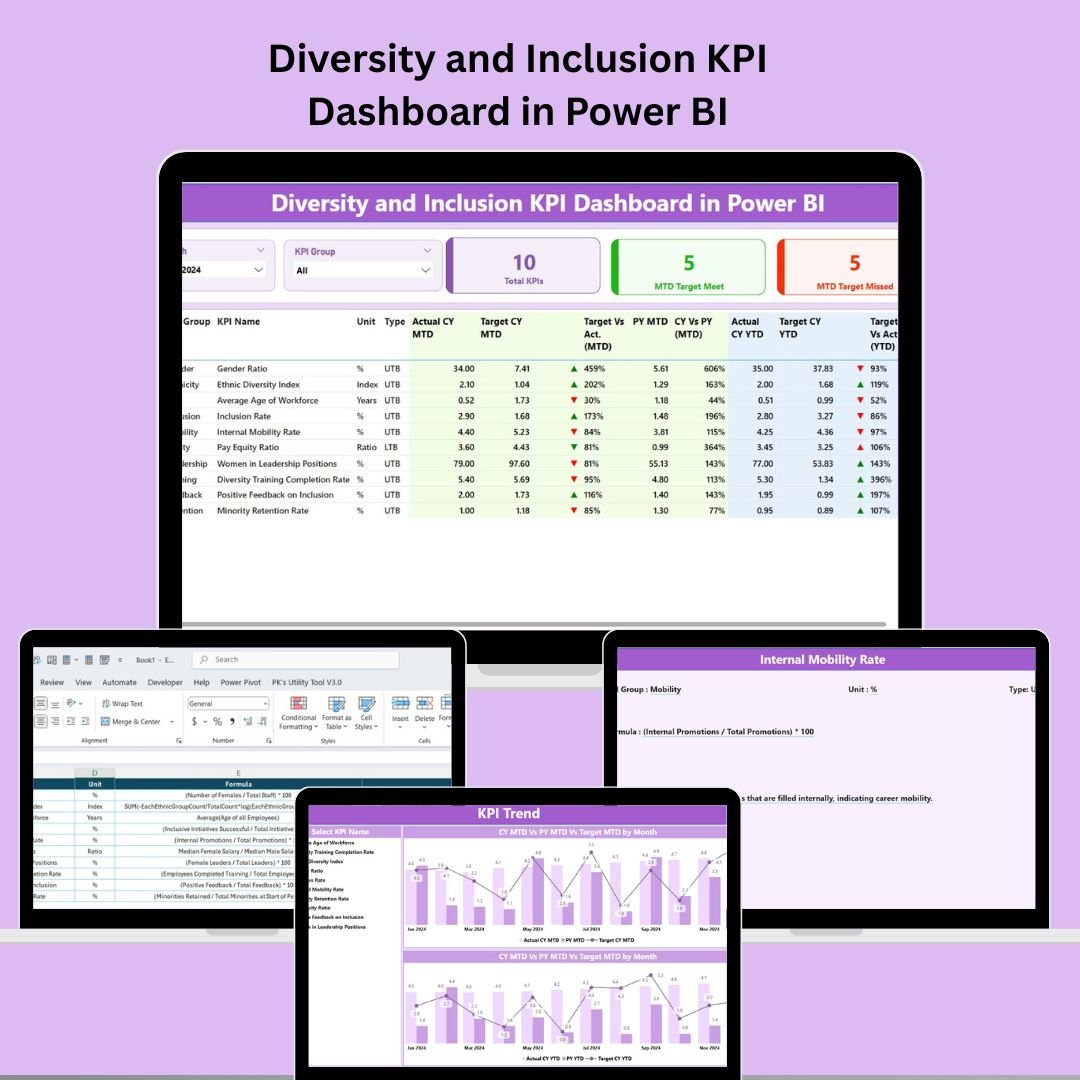
📊 Summary Page
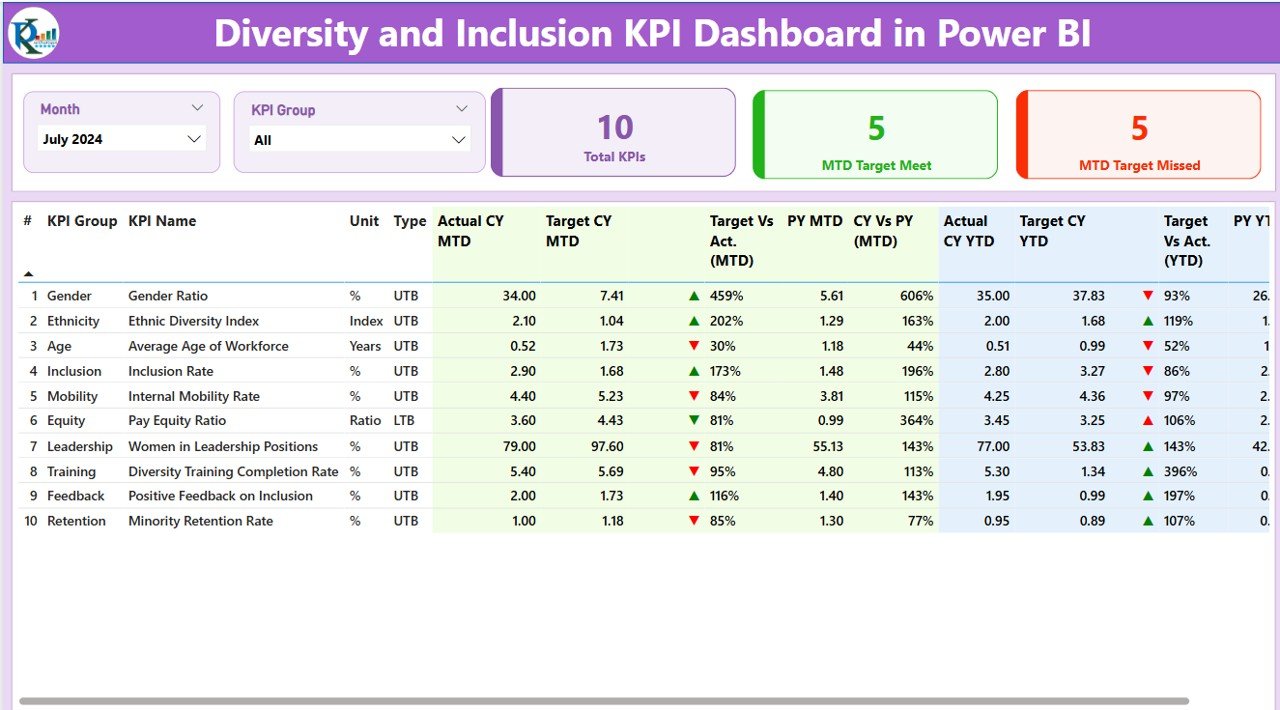
The central hub of the dashboard—see your entire DEI landscape at a glance:
-
🎯 KPI Group (e.g., Gender, Race, Leadership)
-
📈 Current vs. Target MTD & YTD
-
🔺🔻 Status indicators for quick assessment
-
📅 Year-to-date progress visualization
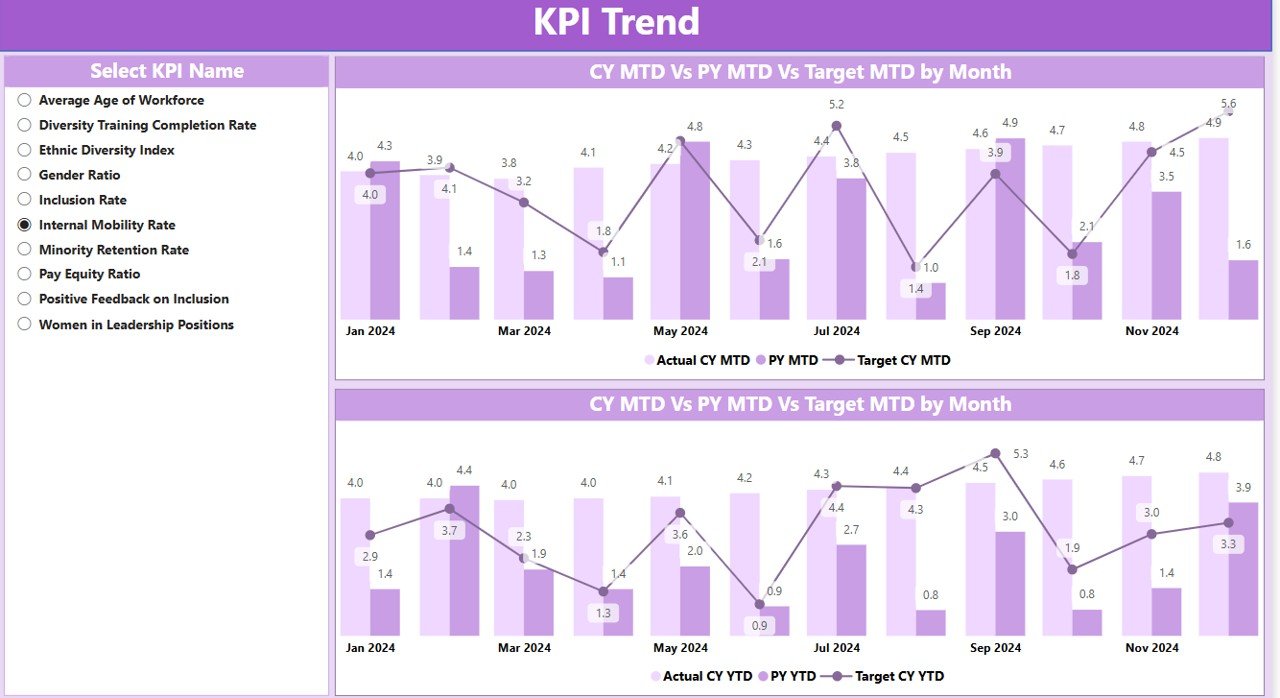
📉 KPI Trend Page
Dive deep into historical data trends for every KPI:
-
📊 Combo charts for Actual vs. Target vs. Previous Year
-
🎯 Slicer-enabled filtering by specific KPIs
-
🔍 MTD and YTD comparative views
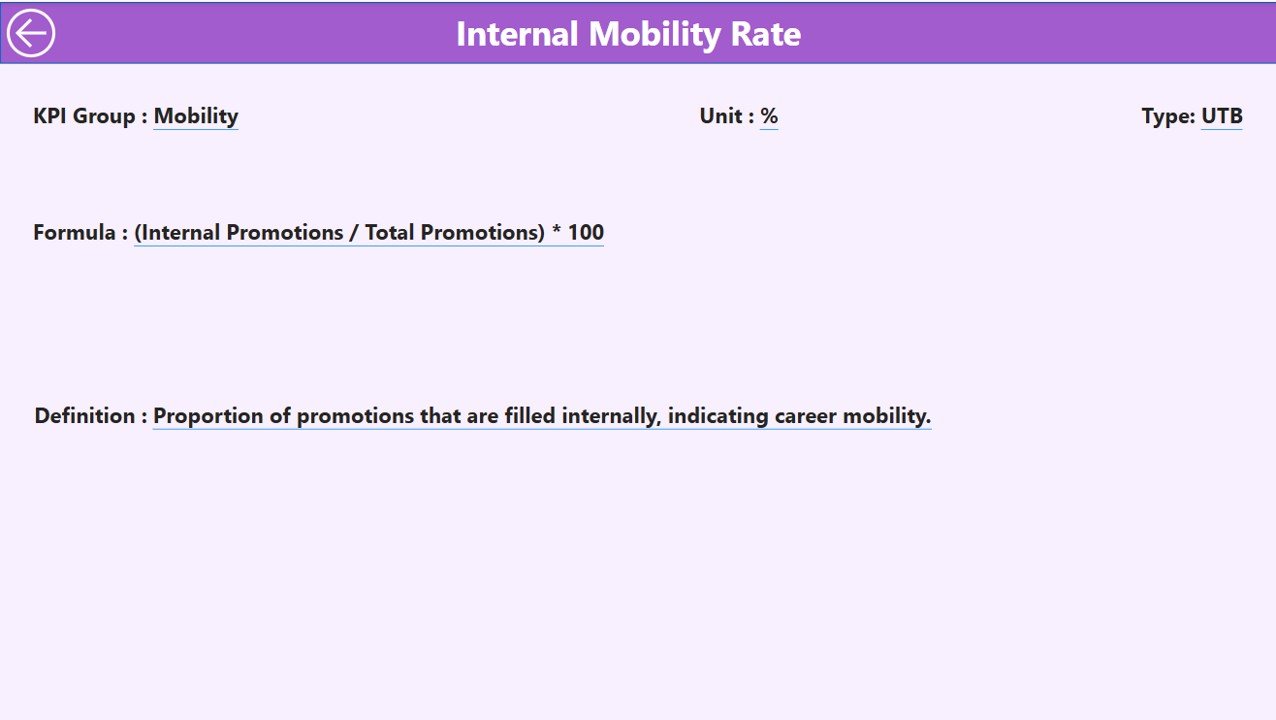
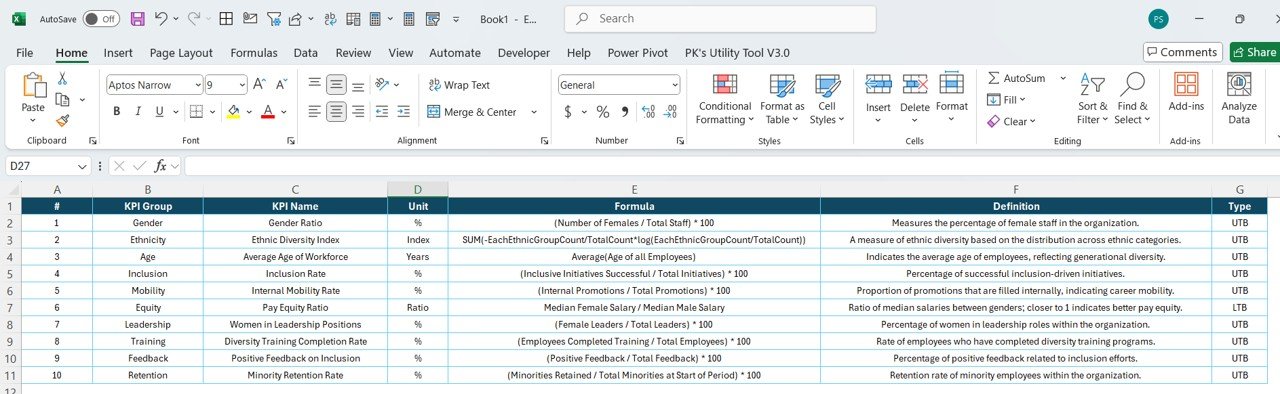
📘 KPI Definition Page
Get clear, standardized definitions of all your DEI metrics:
-
🧮 Formula breakdowns
-
🔍 Descriptions and unit references
-
🔄 UTB/LTB classifications (Upper/Lower the Better)
📦 What’s Inside the Dashboard Package?
This ready-to-use solution includes:
-
📁 Power BI .pbix file (fully interactive dashboard)
-
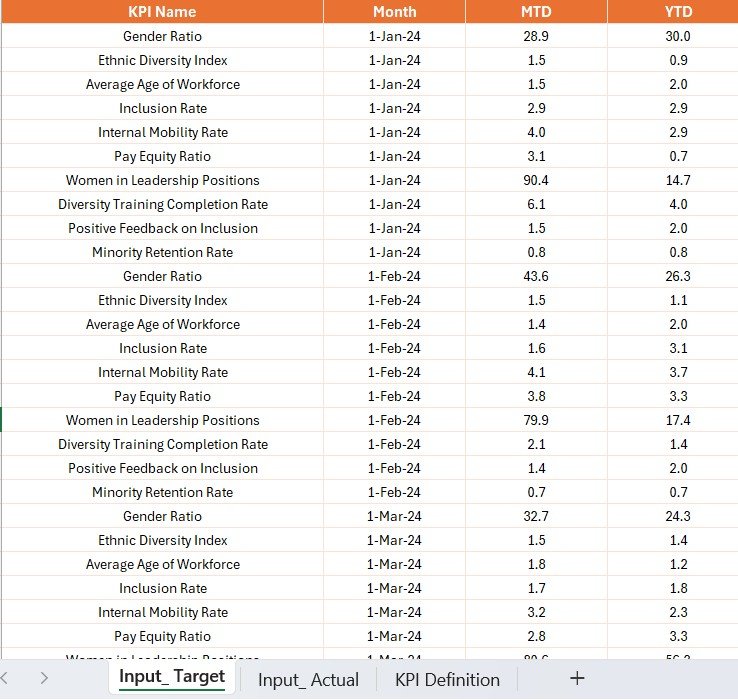
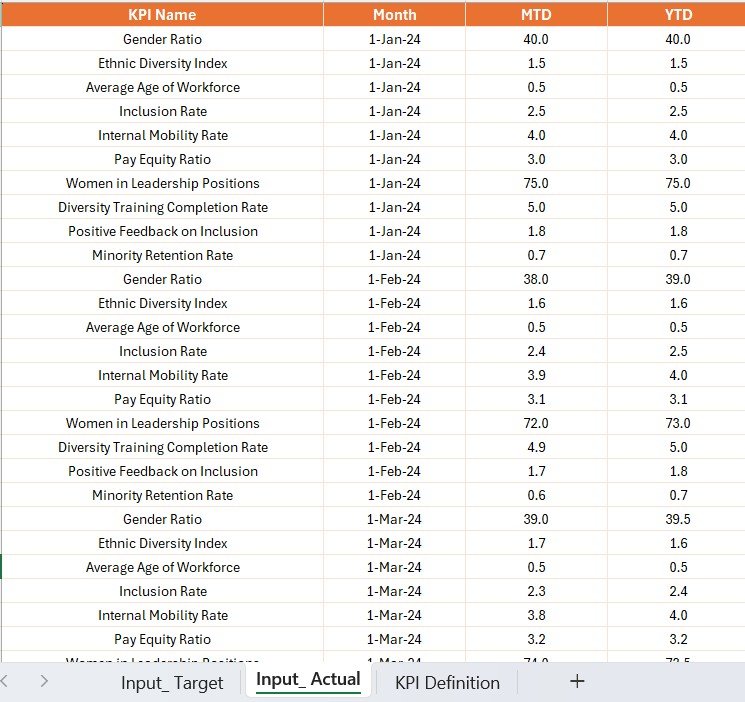
📊 3 Excel sheets for seamless data entry:
-
Actual Numbers
-
Target Values
-
KPI Definitions
-
-
📎 Drill-through connections to explore each KPI in-depth
-
🖼️ Conditional formatting for quick visual alerts
🛠️ How to Use the Dashboard
Using this dashboard is incredibly easy—even for non-technical users:
-
✅ Input Actuals → Update monthly MTD and YTD values in the Excel sheet.
-
🎯 Set Targets → Enter performance benchmarks for each KPI.
-
📊 Visualize Trends → Open Power BI and connect your Excel data.
-
🕵️ Analyze & Act → Use filters, slicers, and charts to review progress and take action.
Power BI will automatically refresh visuals and metrics every time you update the data.
👥 Who Can Benefit from This Dashboard?
Whether you’re a DEI champion or part of the executive leadership, this dashboard is designed for:
-
🏢 HR Departments – Track hiring diversity, training, and pay equity.
-
🧑💼 DEI Officers – Measure impact of initiatives and programs.
-
🎓 Educational Institutions – Report inclusion KPIs across faculties.
-
🏥 Healthcare & Nonprofits – Monitor community outreach and demographic representation.
-
🧠 Corporate Leaders – Align DEI efforts with business strategy.
🚀 Why Choose Power BI for Diversity & Inclusion?
-
🧩 Connects to Excel, HRMS, and cloud systems
-
🖥️ Interactive visuals that require zero coding
-
🪄 Built-in filters and slicers for real-time exploration
-
📤 Easy sharing across leadership and teams
📌 Best Practices for Using This Dashboard
-
✅ Set realistic DEI goals with clear metrics
-
🔁 Update actuals and targets monthly
-
🎯 Assign KPI ownership to specific roles
-
🔎 Use it for strategic decision-making, not just monitoring
-
📥 Regularly back up your Excel data source
🔗 Click here to read the Detailed blog post
📺 Visit our YouTube channel to learn step-by-step video tutorials


Reviews
There are no reviews yet.