

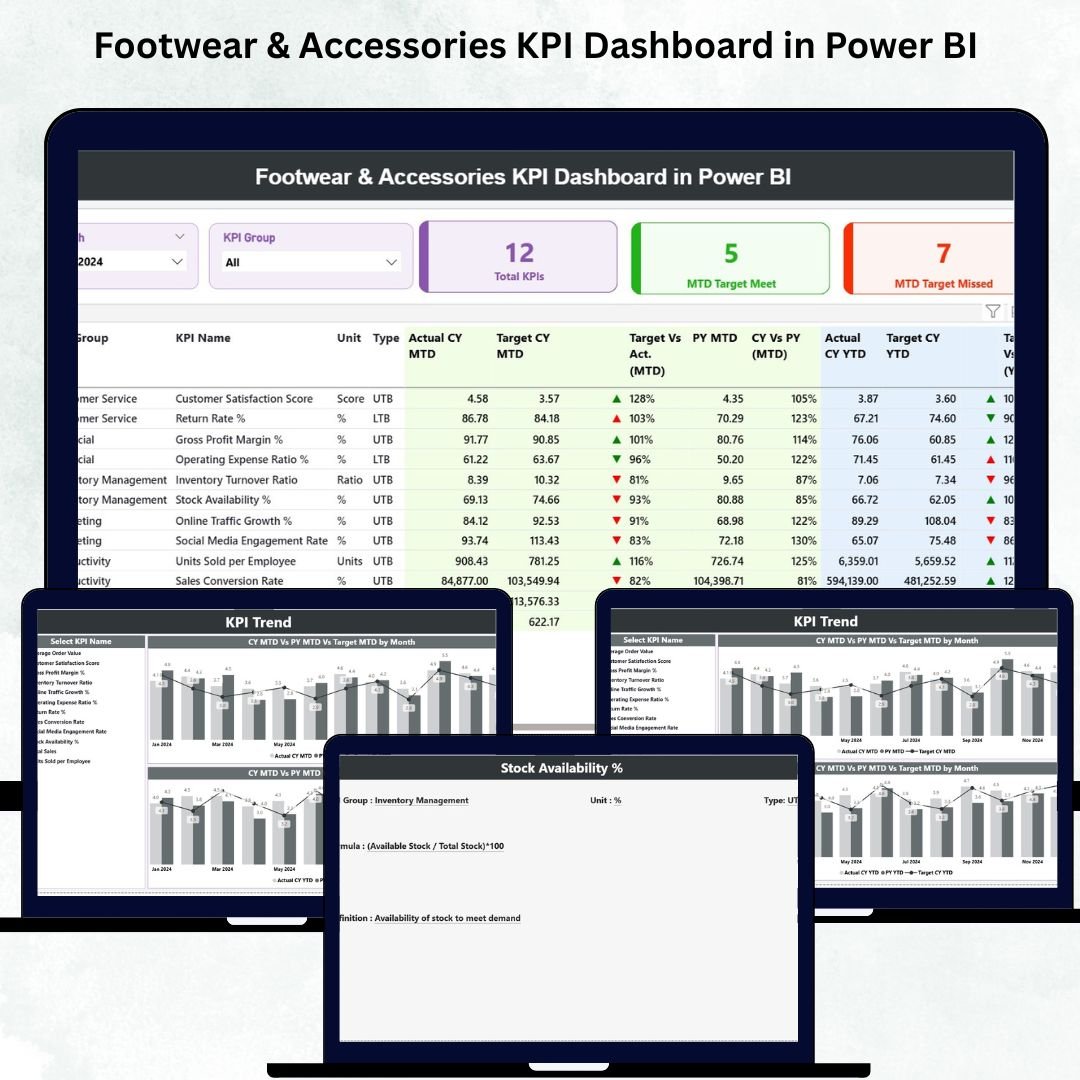
Running a footwear & accessories retail business requires fast decisions, accurate insights, and complete visibility across products, categories, stores, and customers. Trends change quickly, returns fluctuate by season, and performance varies across regions. To keep up with the market, retailers need a powerful tool that transforms raw numbers into clear insights. That’s exactly why we created the Footwear & Accessories KPI Dashboard in Power BI — a ready-to-use, professional, and highly interactive dashboard designed to simplify your performance tracking.
This dashboard gives you instant visibility of MTD, YTD, PY comparisons, Target vs Actual performance, category trends, store insights, customer metrics, and product-level KPIs — all in one place. Whether you manage multiple stores, analyze KPIs for decision-making, or want to improve profitability, this dashboard delivers everything you need.
⭐ Key Features of the Footwear & Accessories KPI Dashboard in Power BI
Our dashboard is built to help retail teams understand performance faster and act smarter. Here’s what makes it powerful:
✨ Interactive Summary Page – Track all KPIs with icons, colors, percentages & filters.
📊 MTD & YTD Tracking – Know exactly how you’re performing this month and year.
📈 Trend Analysis Page – Compare CY, PY & Target values for deeper insights.
🔍 Category, Store & Customer Insights – Understand performance from every angle.
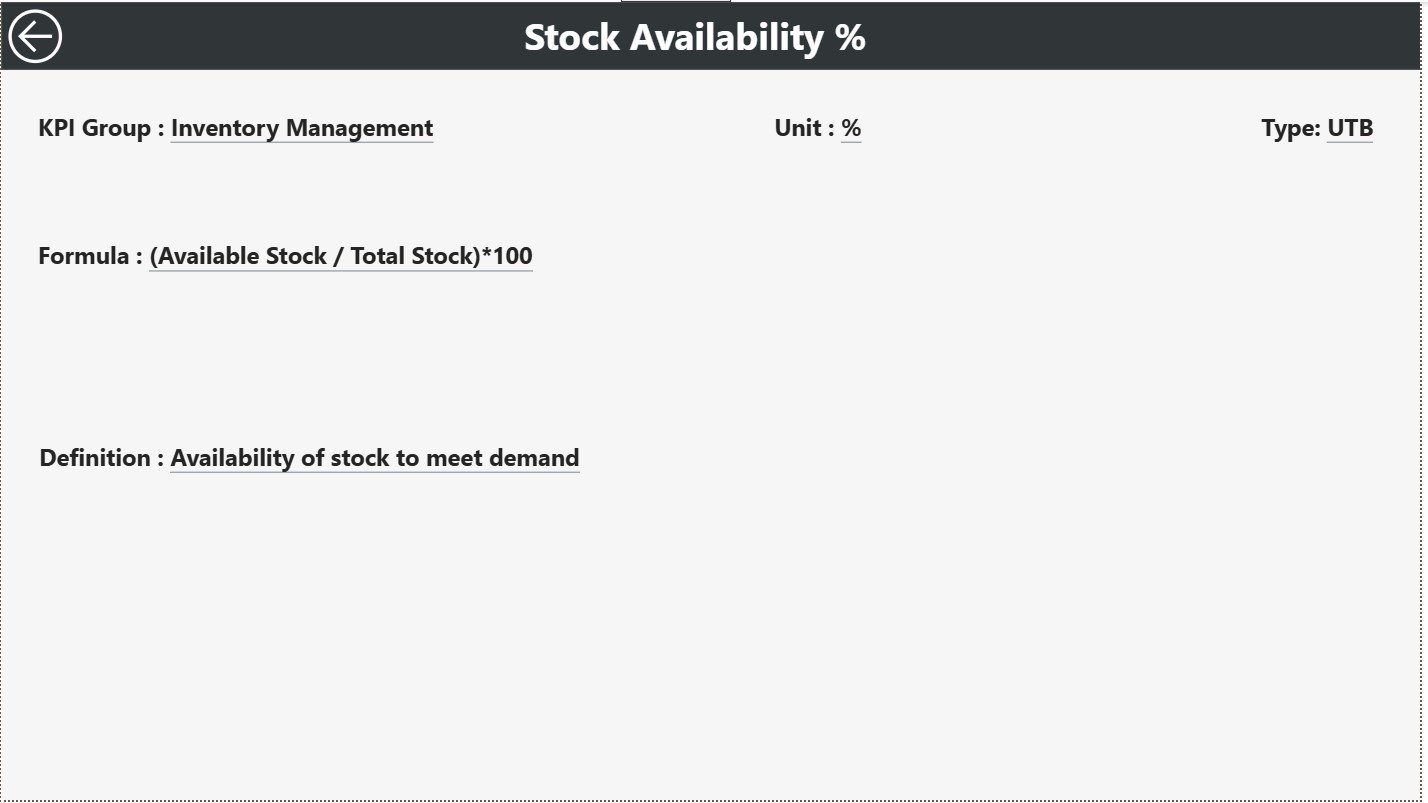
📘 Drill-Through KPI Definitions – View formulas, logic, KPI type, and units instantly.
⚡ Fast Power BI Refresh – Update Excel → Refresh Dashboard → Insights ready.
💼 Ideal for Multi-Store Chains – Track brand-level, product-level, and regional results.
This dashboard is perfect for leaders who want accurate insights without spending hours building reports.
📦 What’s Inside the Footwear & Accessories KPI Dashboard
Once you download the dashboard, you get three high-impact analytical pages, each created for a specific purpose.
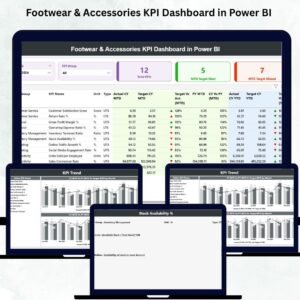
🔹 1. Summary Page – Your Main KPI Hub
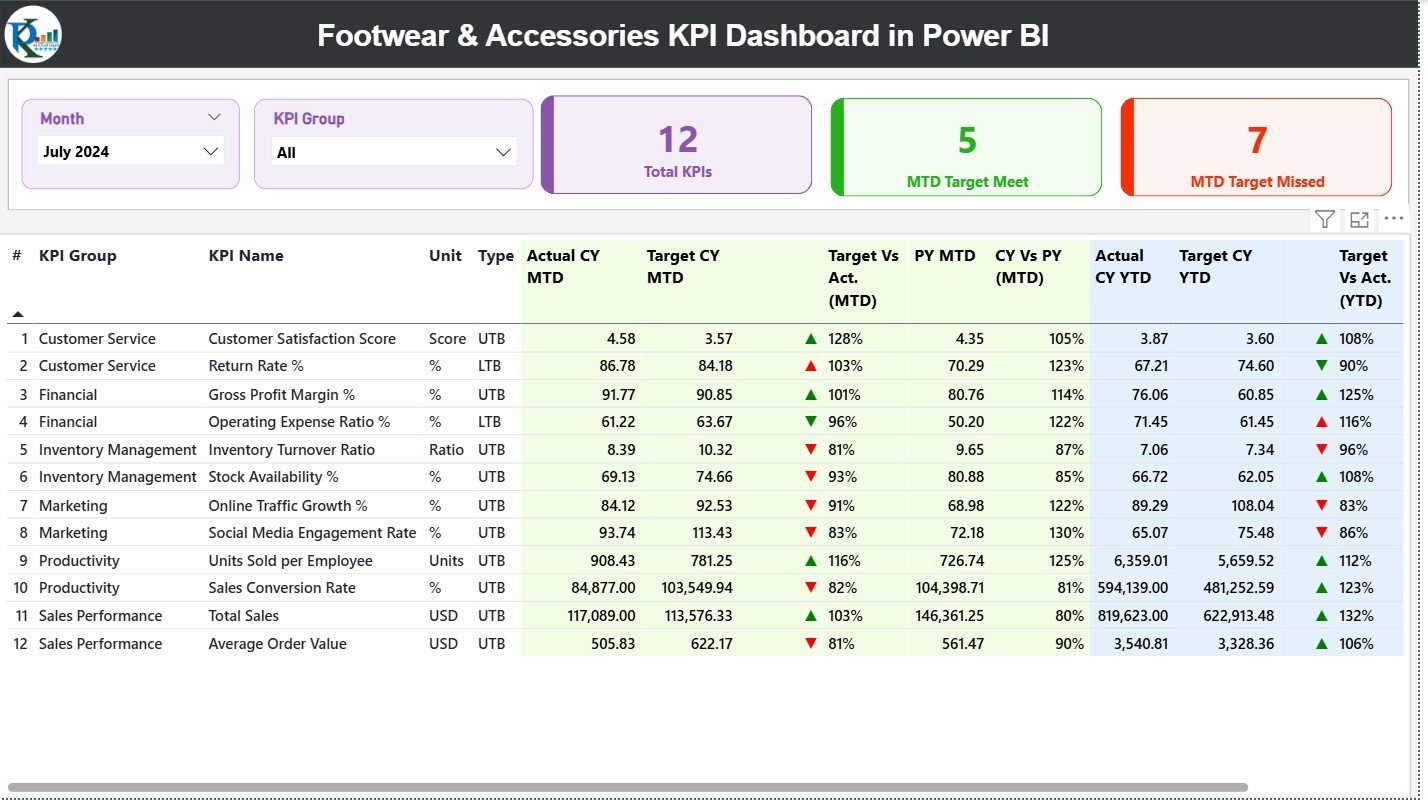
The Summary Page provides quick answers to all performance questions. It includes:
Month Slicer
KPI Group Slicer
Total KPIs Count
MTD Target Met
MTD Target Missed
A detailed KPI table shows:
KPI Name, Unit & Group
LTB or UTB type
MTD Actual vs Target
PY MTD
YTD Actual vs Target
PY YTD
Performance Icons (▲/▼)
This is your go-to page for daily, weekly, and monthly business reviews.
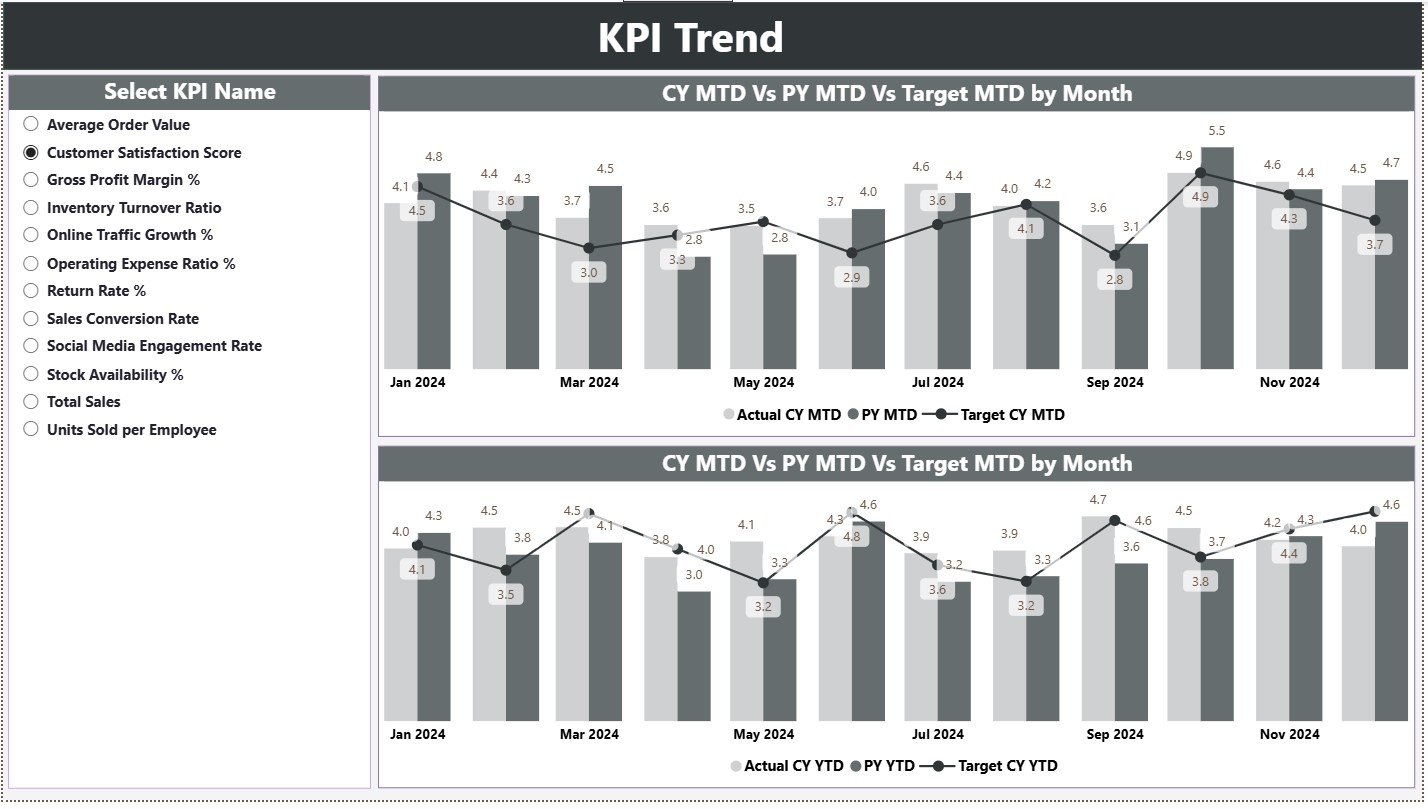
🔹 2. KPI Trend Page – Month-wise & Year-wise Performance
Retail performance changes quickly — this page helps you understand the journey.
Choose any KPI from the slicer
View MTD trend chart (CY, PY & Target)
View YTD trend chart (CY, PY & Target)
Use this page for:
📅 Sales planning
📦 Category trend analysis
📊 Forecasting
📉 Identifying performance dips
🔹 3. KPI Definition Page – Complete KPI Documentation
This is a drill-through page accessible from the Summary Page. It includes:
KPI Number
KPI Group
KPI Name
Unit
Formula
Definition
Type (LTB or UTB)
This page ensures complete clarity during meetings and training sessions.
🛠️ How to Use the Footwear & Accessories KPI Dashboard
Using this dashboard is extremely simple — anyone with basic Excel & Power BI knowledge can manage it.
Update the Excel source files
Actual MTD/YTD
Target MTD/YTD
KPI Definitions
Open Power BI Desktop
Click Refresh
Dashboard updates instantly!
Use slicers to filter month/KPI
Explore Summary & Trend Pages
Drill through KPIs for full details
That’s it — no coding, no complex setup.
👥 Who Can Benefit from This Dashboard?
This dashboard is ideal for:
🛒 Retail Owners & Directors – Track store-level & brand-level performance.
🏬 Store Managers – Monitor sales, returns & customer service.
📊 Business Analysts – Compare MTD, YTD & PY trends.
📦 Category Managers – Evaluate brand & category contributions.
📈 Merchandising Teams – Analyze product demand & returns.
💡 Retail Consultants – Present insights professionally to clients.
Whether you manage 5 stores or 500, this dashboard scales effortlessly.
















Reviews
There are no reviews yet.