


The Disaster Relief KPI Dashboard in Excel is a powerful tool designed to help organizations involved in disaster response manage and optimize their operations effectively. This dashboard consolidates key performance indicators (KPIs) into one user-friendly interface, allowing organizations to track and analyze response times, resource allocation, and the effectiveness of their relief efforts. By centralizing all critical data, the dashboard facilitates real-time decision-making, ensuring that resources are deployed efficiently and effectively during times of need.
With Excel’s dynamic features, this tool helps organizations stay on top of relief efforts, ensuring smooth operations even during the most critical situations.

Key Features of the Disaster Relief KPI Dashboard in Excel
📊 Comprehensive Dashboard Overview
-
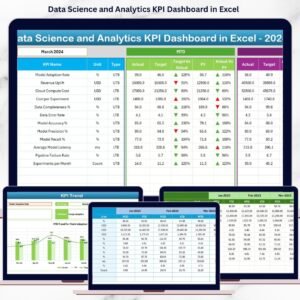
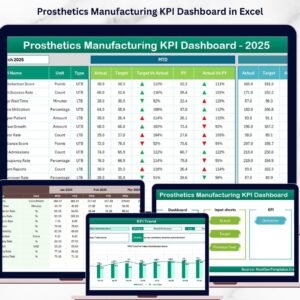
Performance Metrics Display: The dashboard displays key disaster relief KPIs such as response times, distribution rates, and the number of beneficiaries served.
-
Dynamic Data Selection: Users can select different time periods from a dropdown menu, allowing the dashboard to update data accordingly for more accurate, time-based analysis.
📈 Detailed KPI Analysis
-
KPI Trend Tracking: Track the performance of individual KPIs over time, with trend charts that compare actual figures against targets, past performance, and goals.
-
KPI Definitions and Formulas: Each KPI includes detailed descriptions, measurement units, and formulas to ensure clarity and consistency in tracking progress.
💼 Data Management and Customization
-
Actual Numbers Input: Easily input actual data for each month or year, ensuring that the dashboard always reflects the most current performance.
-
Target Setting: Define monthly and yearly targets for each KPI, enabling clear performance tracking and goal alignment.
-
Historical Data Comparison: Maintain and compare historical data for better trend analysis and decision-making.
🧭 User-Friendly Navigation and Support
-
Home Sheet Navigation: A central hub with interactive buttons that make it easy to jump to various sections of the dashboard.
-
Support and Customization: Access comprehensive guidelines and instructions for setting up and customizing the dashboard to fit your organization’s needs and objectives.
Benefits of Using the Disaster Relief KPI Dashboard in Excel
✅ Enhanced Decision-Making
By consolidating all critical performance data, the dashboard supports quick, informed decision-making that can improve the effectiveness of relief efforts during disasters.
✅ Improved Operational Efficiency
Identify trends, measure performance, and monitor the allocation of resources efficiently, ensuring that relief operations are running smoothly and effectively.
✅ Customization and Flexibility
The dashboard is fully customizable, allowing you to track specific KPIs that are relevant to your organization, adapting to different disaster scenarios and response strategies.
Getting Started with Your Disaster Relief KPI Dashboard in Excel
-
Define Disaster Relief KPIs: Identify the most important KPIs for your relief efforts, such as response times, resource distribution, and beneficiary reach.
-
Set Up the Dashboard: Utilize the provided template or design a custom dashboard with sections for data entry, KPI tracking, and visualizations.
-
Input Data: Enter historical and target data for each KPI, ensuring accuracy and consistency across your reports.
-
Customize Features: Adjust the dashboard to reflect your organization’s specific disaster relief strategies, such as modifying KPIs or adding new performance targets.
-
Monitor and Update: Regularly review and update the dashboard to ensure it reflects the most up-to-date data, helping your team stay on top of relief efforts in real time.
By using the Disaster Relief KPI Dashboard in Excel, your organization can better manage disaster response operations, optimize resource allocation, and make data-driven decisions that maximize the effectiveness of your efforts.
Click here to read the Detailed blog post
Disaster Relief KPI Dashboard in Excel
Visit our YouTube channel to learn step-by-step video tutorials
YouTube.com/@PKAnExcelExpert


Reviews
There are no reviews yet.