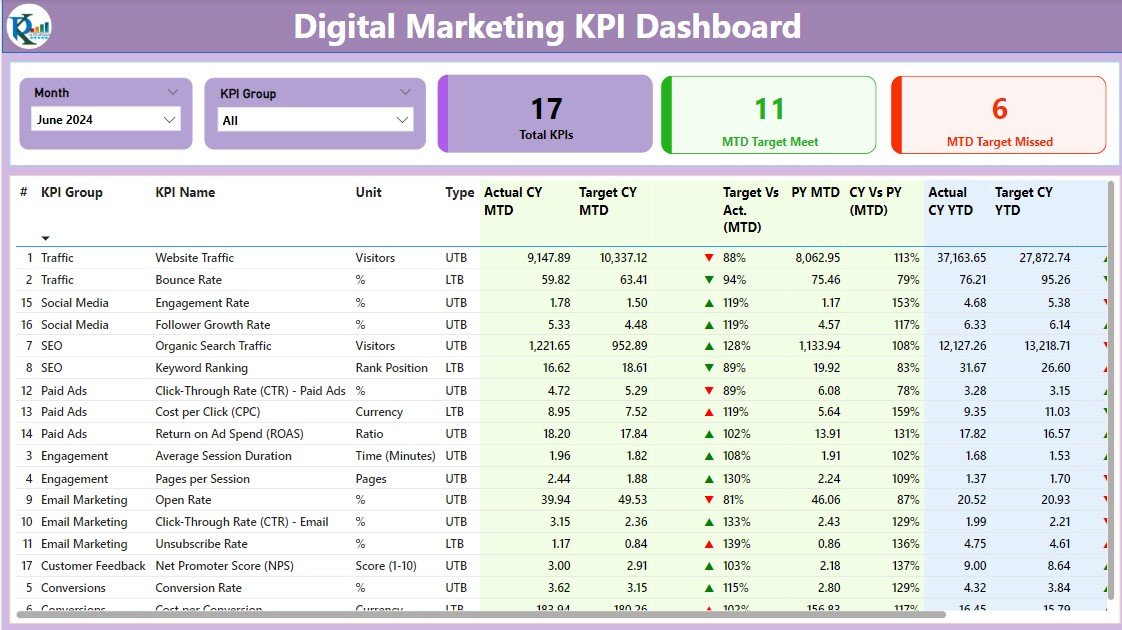
The Digital Marketing KPI Dashboard in Power BI is a powerful and interactive tool designed for digital marketing managers, analysts, and business owners to track, analyze, and optimize their digital marketing efforts. This customizable Power BI dashboard provides insights into key performance indicators (KPIs) such as website traffic, conversion rates, ROI, social media performance, and email campaign effectiveness, helping you to make data-driven decisions and improve marketing strategies.
With real-time data integration, this dashboard enables you to track campaign performance across multiple channels—be it SEO, PPC, social media, or email—allowing you to spot trends, optimize spending, and maximize the return on your marketing investment. It’s the perfect tool for anyone looking to improve their digital marketing efforts and drive business growth.
Key Features of the Digital Marketing KPI Dashboard in Power BI
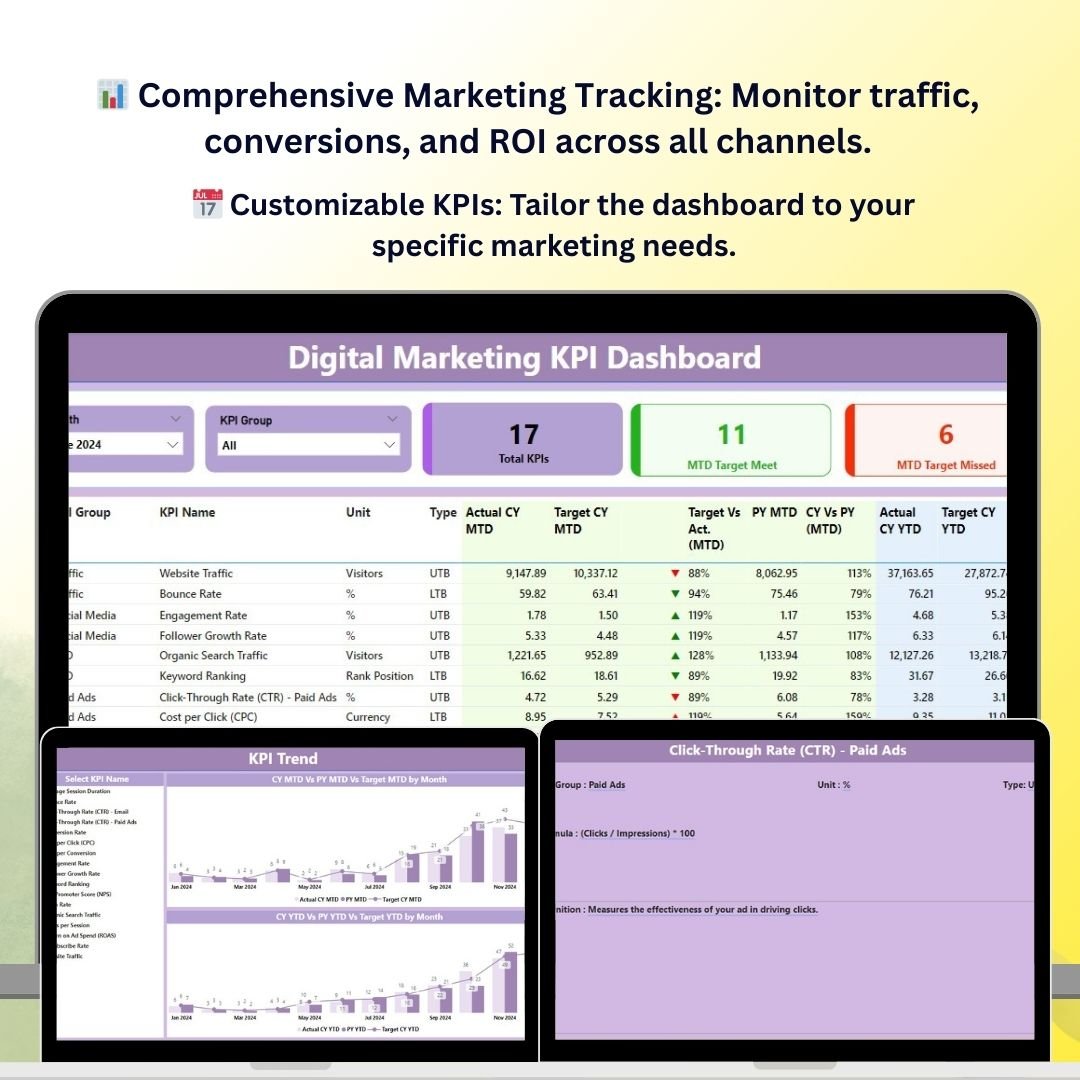
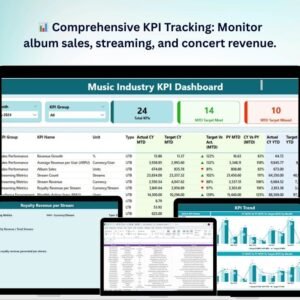
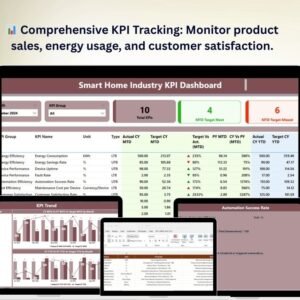
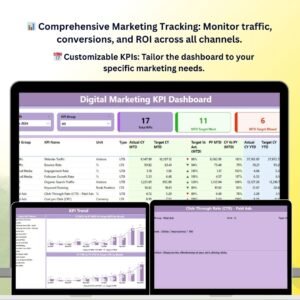
📊 Comprehensive Marketing Performance Tracking
Track essential KPIs such as website traffic, conversion rates, social media engagement, email open rates, and campaign ROI. Monitor all key digital marketing metrics in one place for a complete overview.
⚡ Real-Time Campaign Monitoring
Track the performance of ongoing campaigns in real time. Monitor important metrics such as impressions, clicks, leads generated, and conversion rates, ensuring that your campaigns are always on track.
📈 Multi-Channel Performance Insights
Evaluate the performance of your marketing campaigns across different channels—SEO, PPC, email, and social media. Compare the effectiveness of each channel and make informed decisions about resource allocation.
📅 Customizable KPIs for Digital Marketing
Tailor the dashboard to track KPIs specific to your digital marketing strategy, whether it’s focusing on lead generation, traffic sources, or ad spend efficiency.
🖥️ Interactive & User-Friendly Interface
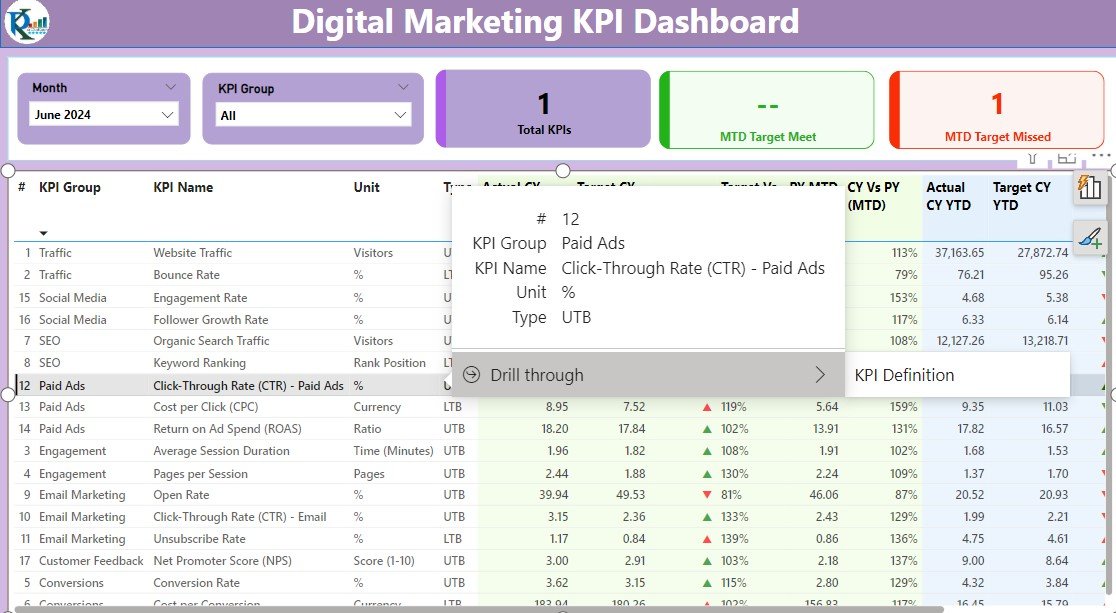
The Power BI dashboard is designed to be intuitive and interactive. Easily filter, slice, and drill down into data to gain detailed insights into campaign performance and optimize marketing strategies.
Why You’ll Love the Digital Marketing KPI Dashboard in Power BI
✅ Track All Marketing Metrics in One Place
Monitor website traffic, conversion rates, social media performance, and ROI across multiple channels. Have all your essential marketing metrics in one dashboard for easy access.
✅ Optimize Campaign Performance
Track the performance of campaigns in real-time, identify underperforming areas, and take corrective actions to maximize marketing effectiveness.
✅ Improve Marketing ROI
With insights into cost-per-click, lead generation, and sales conversions, optimize your marketing spend to get the most out of every dollar spent.
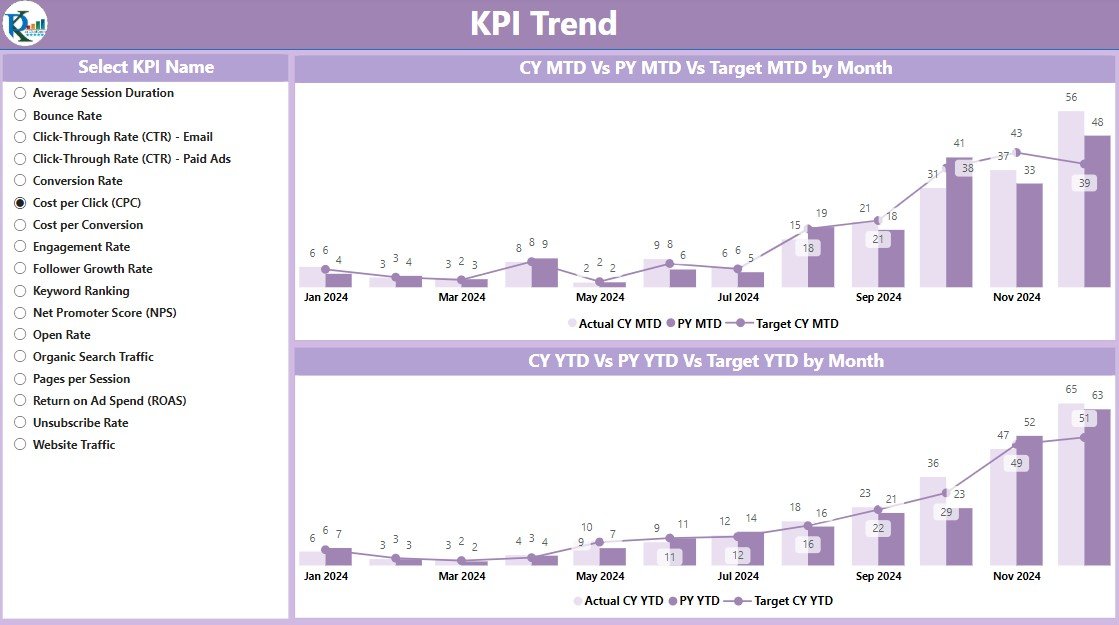
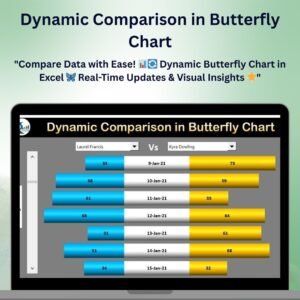
✅ Visualize Marketing Trends
Use interactive charts and graphs to visualize marketing trends, traffic patterns, and performance comparisons. Quickly spot areas of success and opportunities for improvement.
✅ Make Data-Driven Marketing Decisions
Leverage real-time insights to make informed decisions about your marketing strategy, from campaign adjustments to long-term planning.
What’s Inside the Digital Marketing KPI Dashboard Template?
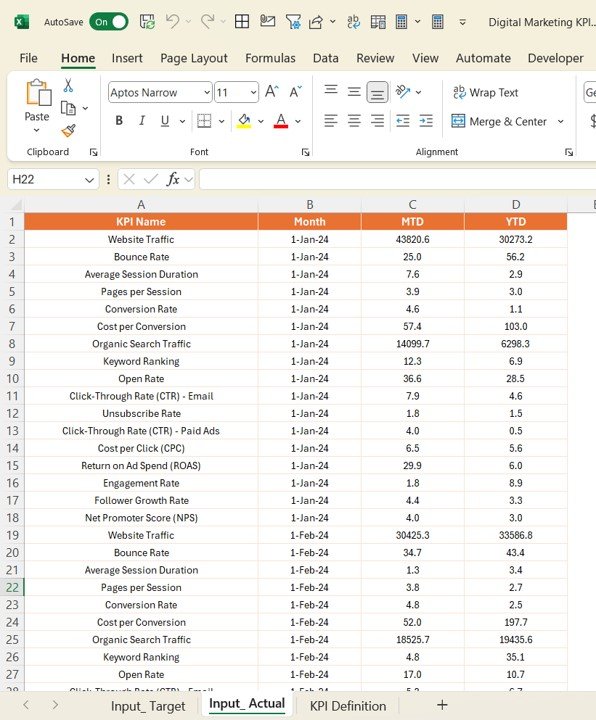
- Traffic & Conversion Monitoring: Track website traffic, conversions, bounce rates, and more.
- PPC & Ad Spend Analysis: Monitor PPC campaign performance and cost-per-click metrics to optimize ad spending.
- Social Media Performance: Track likes, shares, comments, and overall engagement across platforms like Facebook, Twitter, and LinkedIn.
- Email Campaign Insights: Measure open rates, click-through rates, and overall engagement with your email campaigns.
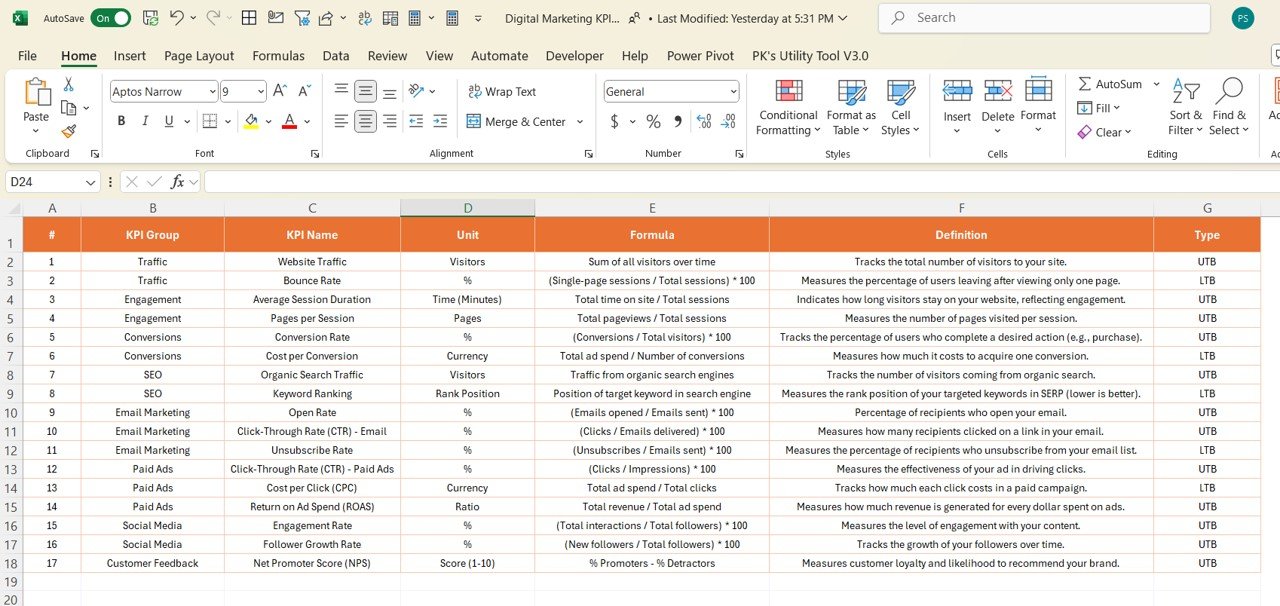
- Customizable KPIs: Adjust the dashboard to track marketing KPIs that are most relevant to your business and marketing strategy.
- Interactive Reporting: Use filters and slicers to analyze performance by campaign, channel, or time period.
How to Use the Digital Marketing KPI Dashboard in Power BI
1️⃣ Download the Template: Instantly access your Digital Marketing KPI Dashboard in Power BI.
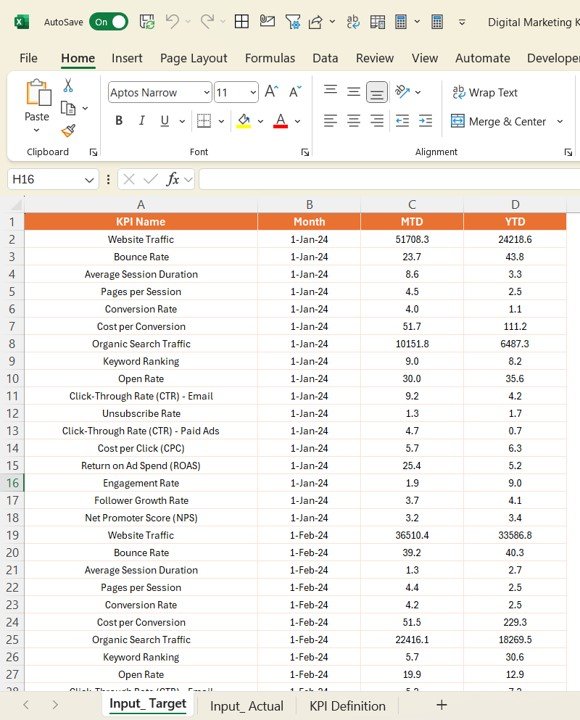
2️⃣ Input Marketing Data: Enter data from your marketing channels, such as website traffic, social media performance, PPC campaign results, and email campaign metrics.
3️⃣ Monitor & Track KPIs: Use the dashboard to track real-time performance across multiple marketing channels.
4️⃣ Analyze & Optimize: Use the insights to optimize your marketing strategy, improve ROI, and make data-driven decisions for future campaigns.
Who Can Benefit from the Digital Marketing KPI Dashboard in Power BI?
🔹 Digital Marketing Managers & Teams
🔹 Business Owners & Entrepreneurs
🔹 Social Media Managers
🔹 PPC & SEO Analysts
🔹 Content Marketers & Email Campaign Managers
🔹 Anyone Involved in Digital Marketing Campaigns & Strategy
Track, analyze, and optimize your digital marketing efforts with the Digital Marketing KPI Dashboard in Power BI. Monitor key performance metrics, improve campaign effectiveness, and maximize ROI with this powerful and easy-to-use tool.
Click here to read the Detailed blog post
Visit our YouTube channel to learn step-by-step video tutorials
Youtube.com/@PKAnExcelExpert


Reviews
There are no reviews yet.