
The Digital Asset Management KPI Dashboard in Excel is a powerful tool designed to help organizations efficiently manage, track, and analyze the performance of their digital assets. Whether you’re managing images, videos, documents, or other digital content, this Excel-based dashboard offers a comprehensive overview of asset usage, efficiency, and lifecycle management.
From tracking asset downloads to monitoring storage utilization, this dashboard helps you optimize digital asset workflows and make data-driven decisions. It enables digital asset managers, marketing teams, and business owners to stay on top of asset performance, ensuring that content is being used effectively and efficiently throughout its lifecycle.
Key Features of the Digital Asset Management KPI Dashboard in Excel
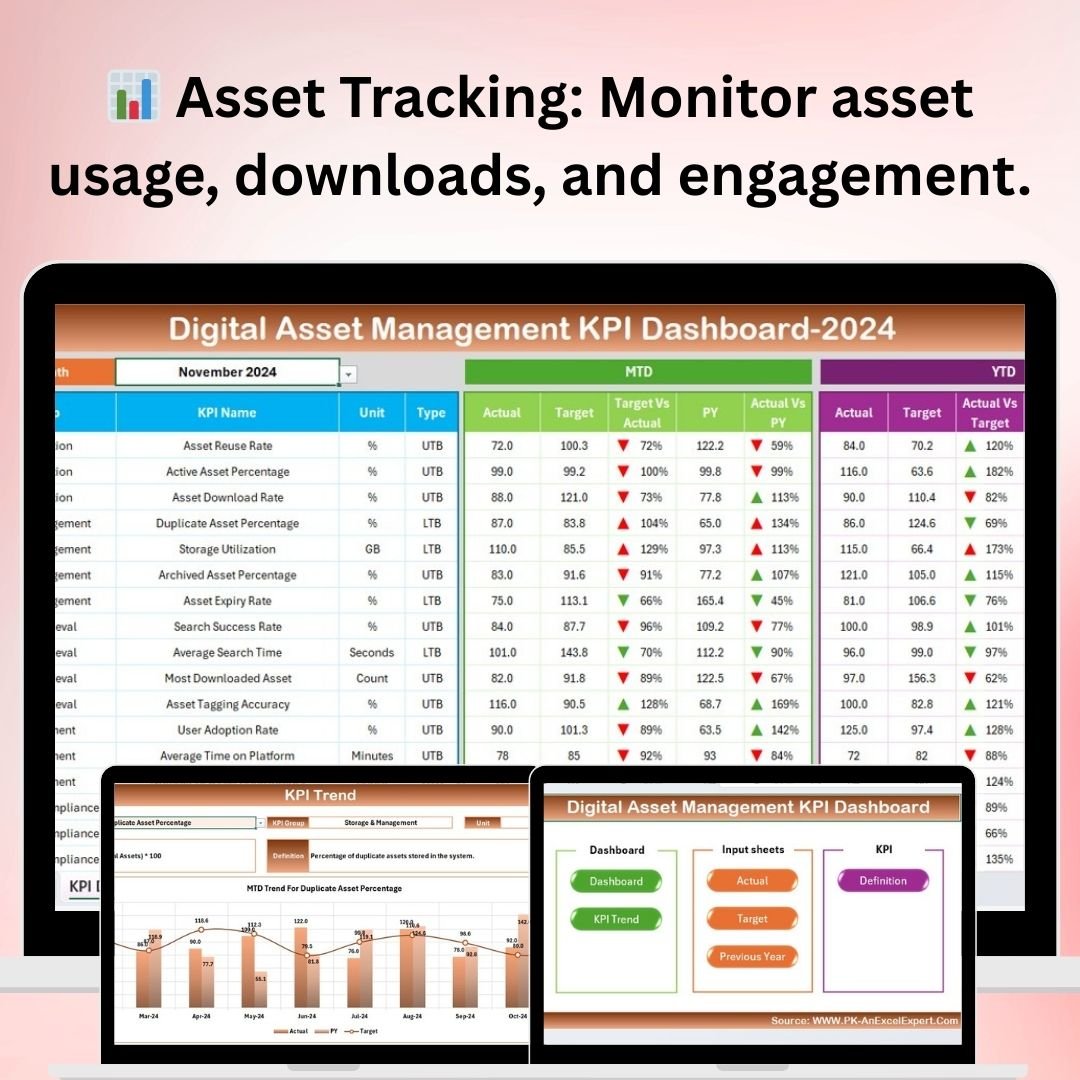
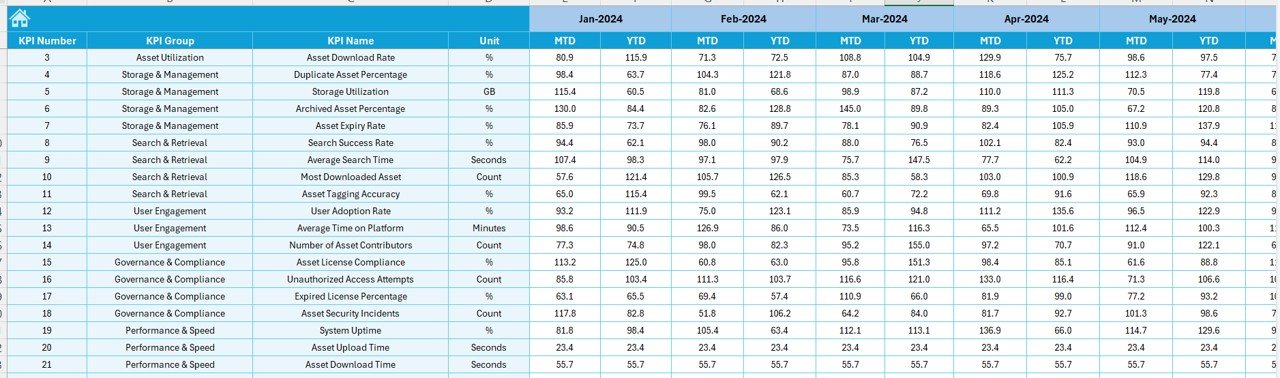
📊 Digital Asset Tracking
Track key metrics such as asset downloads, usage frequency, and user engagement. This provides valuable insights into which assets are most utilized and which may need to be optimized or retired.
💾 Storage Utilization Monitoring
Monitor how much storage is being used for digital assets and identify areas where optimization can be done to ensure that resources are being utilized effectively and efficiently.
📅 Asset Lifecycle Management
Track the lifecycle of each digital asset, from creation and usage to retirement. Ensure that assets are maintained, updated, or archived according to their relevance and usage.
🔍 Asset Performance Analysis
Analyze asset performance across various platforms and departments, identifying high-performing assets that drive engagement and those that require improvement or replacement.
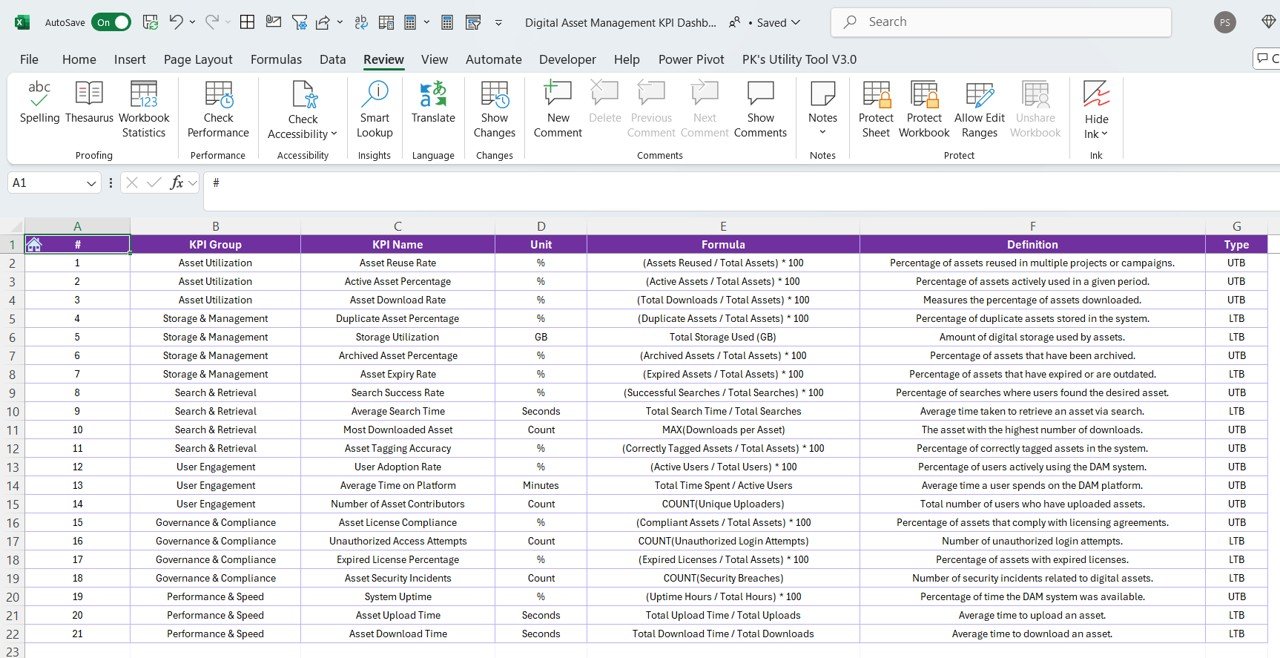
⚙️ Customizable KPIs & Metrics
Adapt the dashboard to fit your organization’s digital asset management needs. Track additional metrics, such as asset quality, cost per asset, or asset categorization, to reflect your unique business requirements.
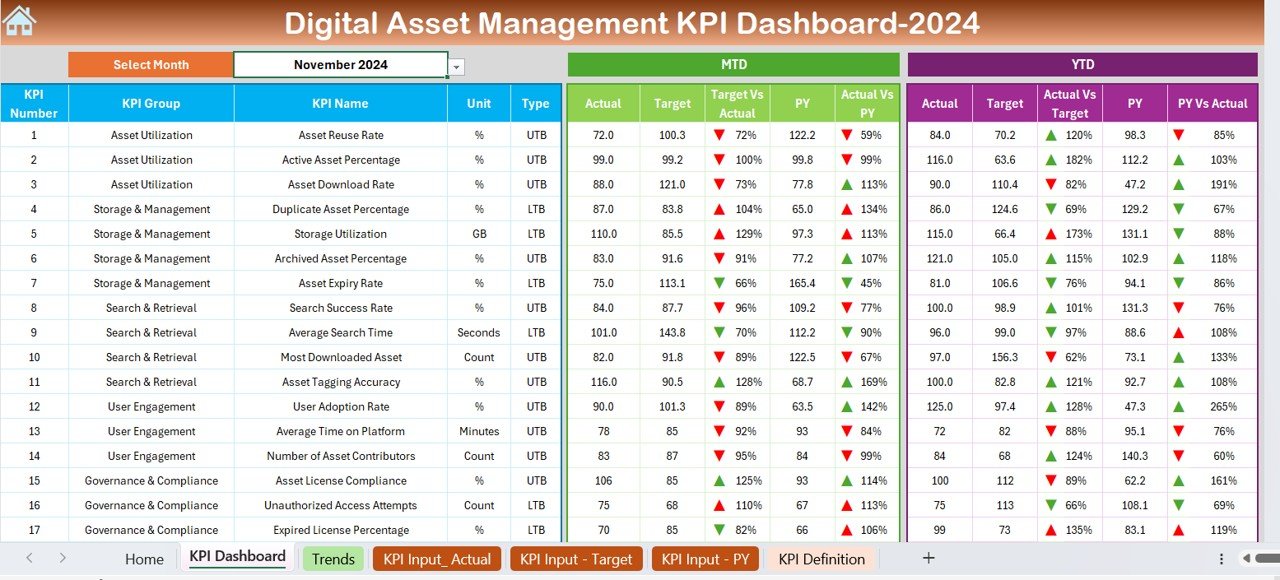
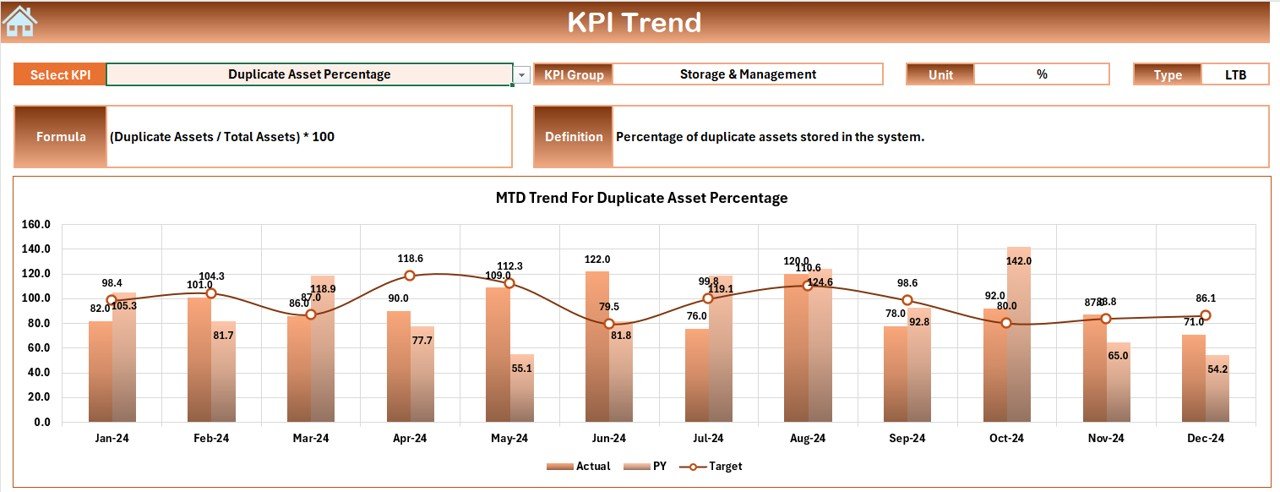
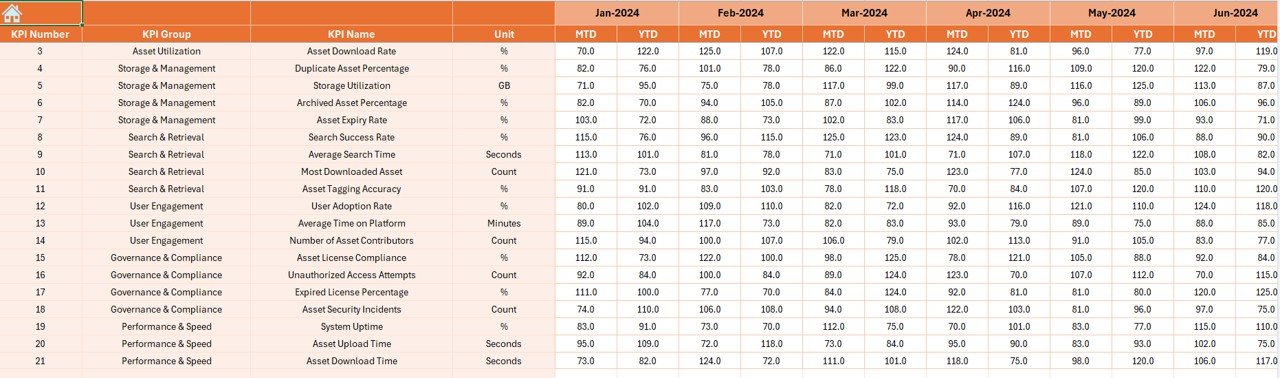
📈 Visual Dashboards & Reports
Leverage powerful charts and graphs to visualize asset performance, trends, and storage metrics. Make informed decisions based on real-time data and easy-to-understand visualizations.
Why You’ll Love the Digital Asset Management KPI Dashboard in Excel
✅ Centralized Asset Management
Keep track of all digital assets in one centralized location, ensuring easy access and management. Stay organized and ensure no asset is overlooked.
✅ Improve Resource Utilization
Optimize storage utilization and manage your assets more efficiently. Track usage to ensure you’re maximizing the value of your digital resources.
✅ Streamline Asset Lifecycle
Track the full lifecycle of digital assets and ensure they are being used appropriately. Make data-driven decisions on when to retire or update assets.
✅ Boost Asset Performance
Analyze asset performance and identify which assets are underperforming, allowing you to make adjustments for greater engagement and effectiveness.
✅ Scalable & Customizable
Tailor the dashboard to suit your organization’s specific asset management needs. Whether you’re tracking marketing materials or multimedia content, this dashboard adapts to any scenario.
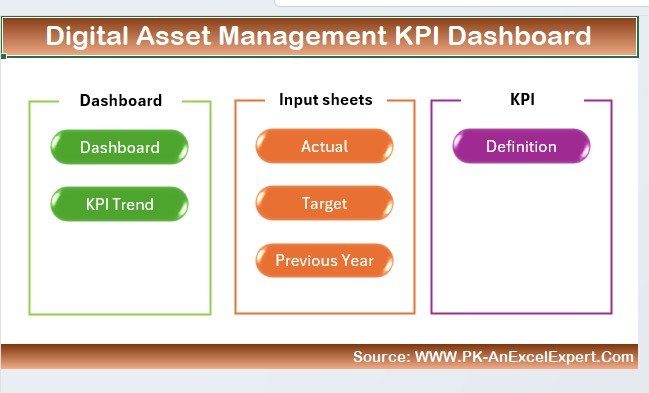
What’s Inside the Digital Asset Management KPI Dashboard in Excel?
-
Asset Tracking: Monitor the usage, downloads, and engagement of each asset.
-
Storage Utilization: Track the storage consumption and optimize resource allocation.
-
Asset Lifecycle Management: Keep track of the creation, updates, and retirement of assets.
-
Asset Performance Metrics: Analyze the effectiveness and reach of assets across various platforms.
-
Customizable KPIs: Adapt the dashboard to track the metrics that matter most to your organization.
-
Visual Dashboards: Utilize visual charts and graphs to view real-time asset performance.
How to Use the Digital Asset Management KPI Dashboard in Excel
1️⃣ Download the Template: Get the Digital Asset Management KPI Dashboard in Excel instantly.
2️⃣ Input Asset Data: Add details such as asset types, usage, and download statistics.
3️⃣ Monitor Performance: Track asset performance across various departments or platforms.
4️⃣ Analyze Storage: Use storage metrics to monitor and optimize digital asset storage.
5️⃣ Generate Reports: Create reports that provide insights into asset performance and lifecycle.
Who Can Benefit from the Digital Asset Management KPI Dashboard in Excel?
🔹 Digital Asset Managers
🔹 Marketing Teams
🔹 Content Creators & Editors
🔹 IT & Infrastructure Teams
🔹 E-commerce & Retail Companies
🔹 Large Corporations with Extensive Digital Asset Libraries
🔹 Nonprofits & Government Organizations Managing Public Digital Content
Efficiently track and manage your digital assets with the Digital Asset Management KPI Dashboard in Excel. Streamline workflows, optimize storage, and enhance the value of your digital resources.
Click here to read the Detailed blog post
Visit our YouTube channel to learn step-by-step video tutorials
Youtube.com/@PKAnExcelExpert


Reviews
There are no reviews yet.