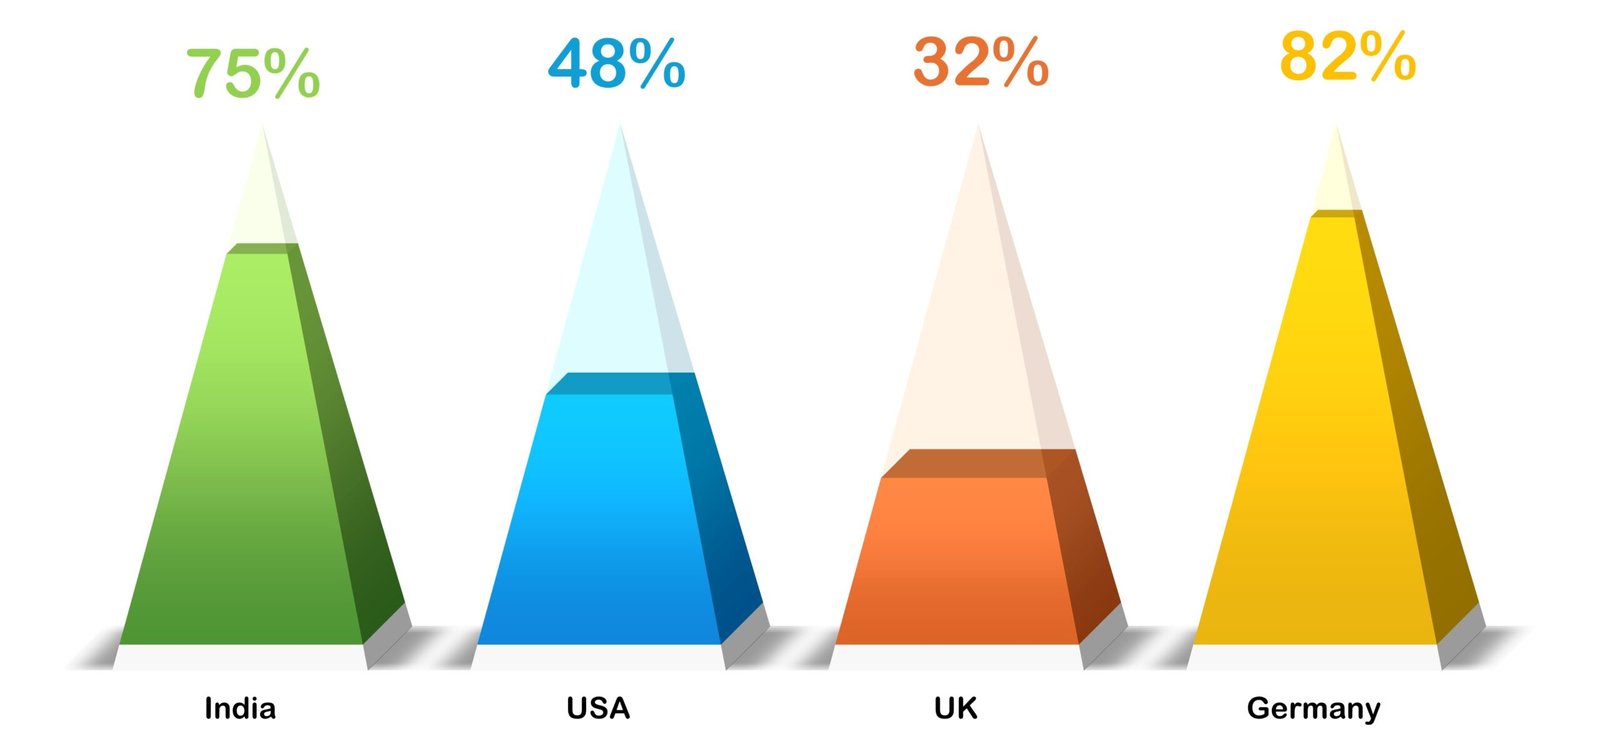
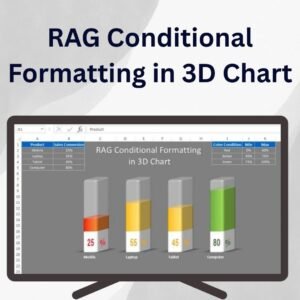
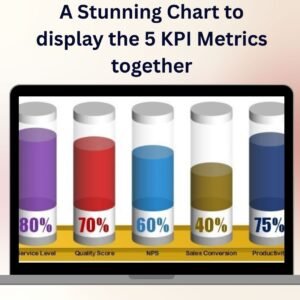
The Data-Driven 3D Container Chart in PowerPoint is a dynamic way to present complex data in a visually engaging format. By incorporating three-dimensional container charts, you can make your presentations more impactful, providing clear, easy-to-understand data visuals. This tool allows you to showcase your data in a structured, professional, and interactive way, making it perfect for business, academic, and other presentation settings.
Follow this step-by-step guide to create your own 3D container chart in PowerPoint, helping you to effectively communicate key insights in a visually appealing format.
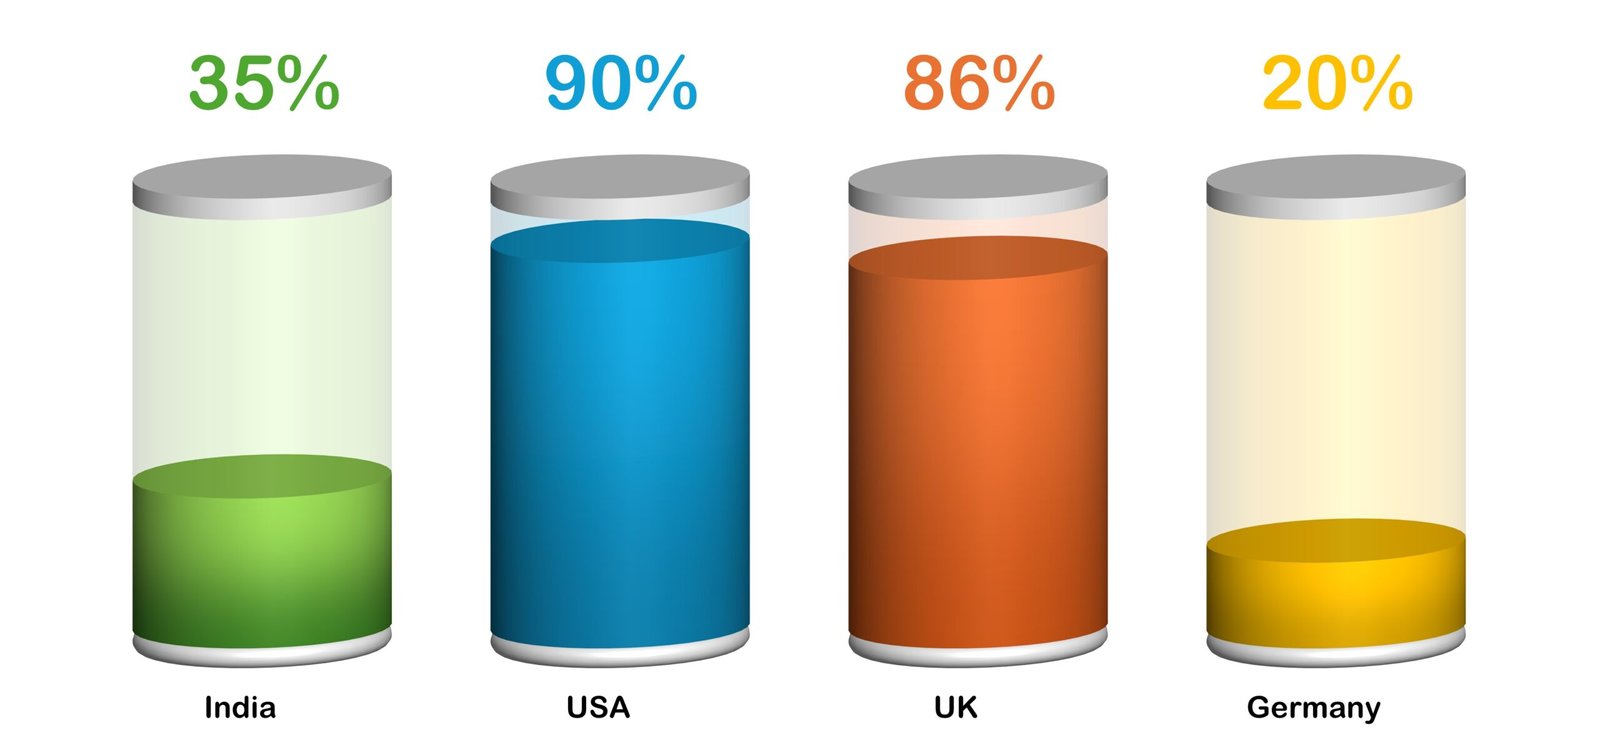
Key Features of the Data-Driven 3D Container Chart in PowerPoint
📊 Data Preparation in Excel
-
Organize Data: Input your data into Excel, ensuring each category has a corresponding value for accurate chart representation.
-
Select and Create Chart: Highlight your data and select an appropriate chart type (like column or bar chart) that best represents your information.
📈 3D Chart Customization
-
Apply 3D Effects: Once your chart is created, choose the 3D chart style that best fits your needs. Adjust depth, angle, and lighting to make your chart stand out.
-
Design Enhancements: Customize the chart to add your desired effects and make your data look more visually appealing.
🖥 Seamless Integration with PowerPoint
-
Link Data to Chart: Copy the customized chart from Excel and paste it into PowerPoint using the “Paste Special” option. Choose “Paste Link” to keep the chart updated whenever the data changes.
-
Efficient Updates: Changes made in Excel will automatically reflect in PowerPoint, making it easy to keep your presentation up-to-date.
🔄 Real-Time Data with DataPoint Add-On
-
Live Data Integration: For advanced presentations, consider using the Data Point add-on for PowerPoint. This tool links live data sources to your slides, ensuring that your charts are always showing the most current information during the presentation.
-
Multiple Data Sources: DataPoint supports connecting to various sources, such as Excel files, databases, and web services, allowing for seamless integration of real-time data.
Benefits of Using the Data-Driven 3D Container Chart in PowerPoint
✅ Engaging Visuals
Using 3D container charts adds depth and dimension to your presentation, making it visually more engaging and easier for the audience to grasp complex data.
✅ Real-Time Updates
By linking your PowerPoint chart to Excel or live data sources, you ensure that your chart always displays the most accurate, up-to-date information without needing manual updates.
✅ Improved Decision-Making
With clear and concise visuals, your audience can quickly understand trends, patterns, and key data points, enabling more informed decision-making.
✅ Customizable to Your Needs
Easily adapt the design of the chart to suit your specific presentation needs, from adjusting colors to adding specific visual effects.
Click here to read the Detailed blog post
Data-Driven 3D Container Chart in PowerPoint
Visit our YouTube channel to learn step-by-step video tutorials
YouTube.com/@PKAnExcelExpert















Reviews
There are no reviews yet.