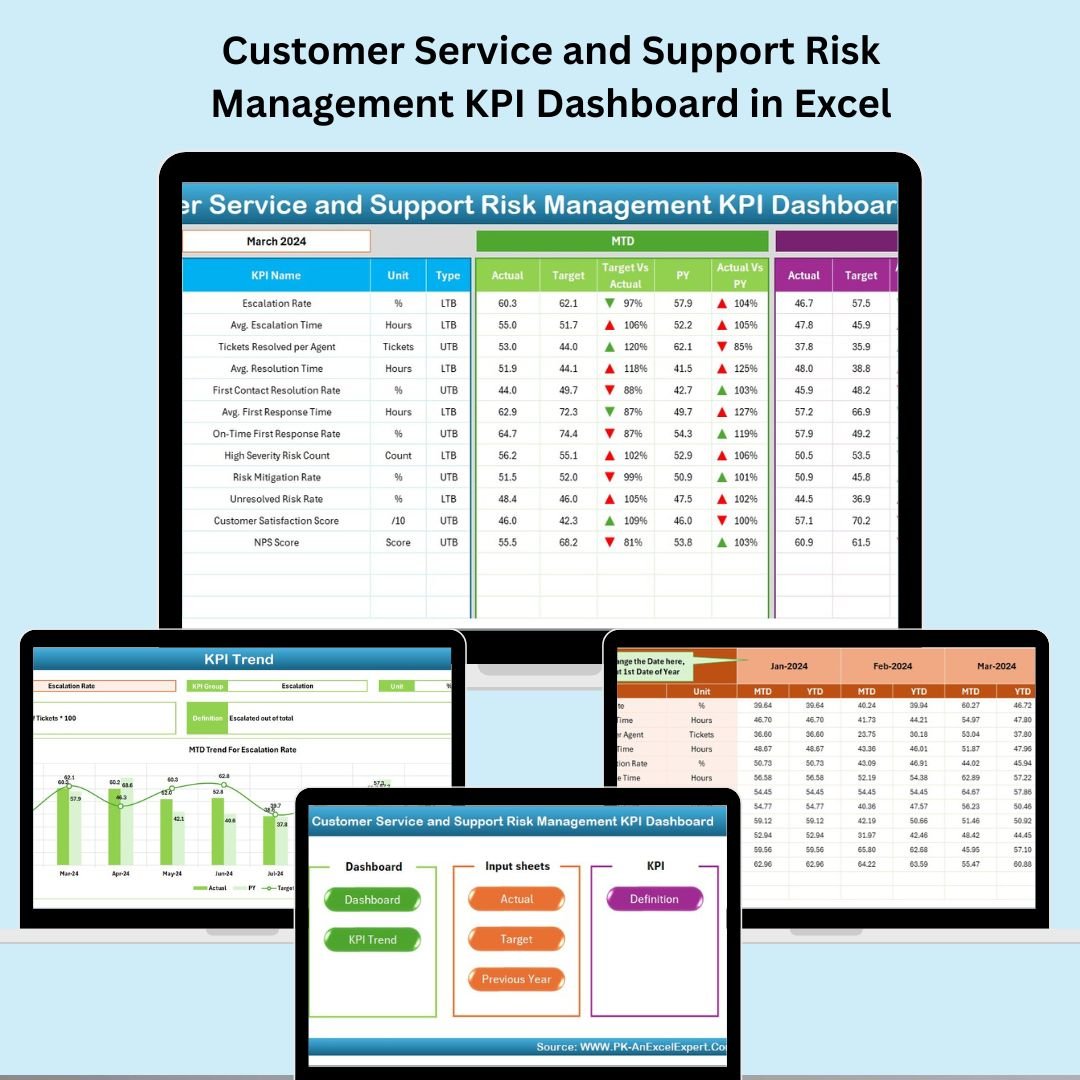
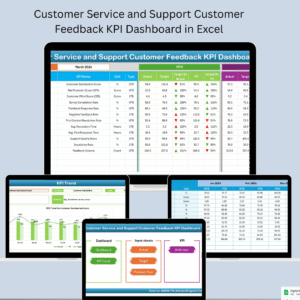
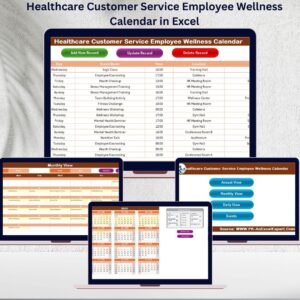
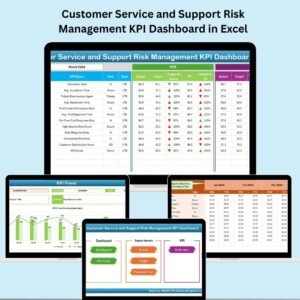
Customer Service and Support Risk Management KPI Dashboard in Excel 💼📊
Struggling to keep up with rising support risks and customer complaints? Want to take proactive control of your customer service performance? Our Customer Service and Support Risk Management KPI Dashboard in Excel is exactly what your team needs! ✅
This ready-to-use Excel template is your ultimate command center for identifying, tracking, and minimizing customer service risks before they become major issues. Whether you’re a service manager, analyst, or small business owner, this dashboard puts powerful insights at your fingertips—without the need for any coding or advanced software.
Let’s dive into everything this dynamic dashboard has to offer 👇
✨ Key Features of Customer Service and Support Risk Management KPI Dashboard
🧠 Smart Navigation
Jump across all sheets instantly using a well-organized Home Sheet with clickable buttons for easy access.
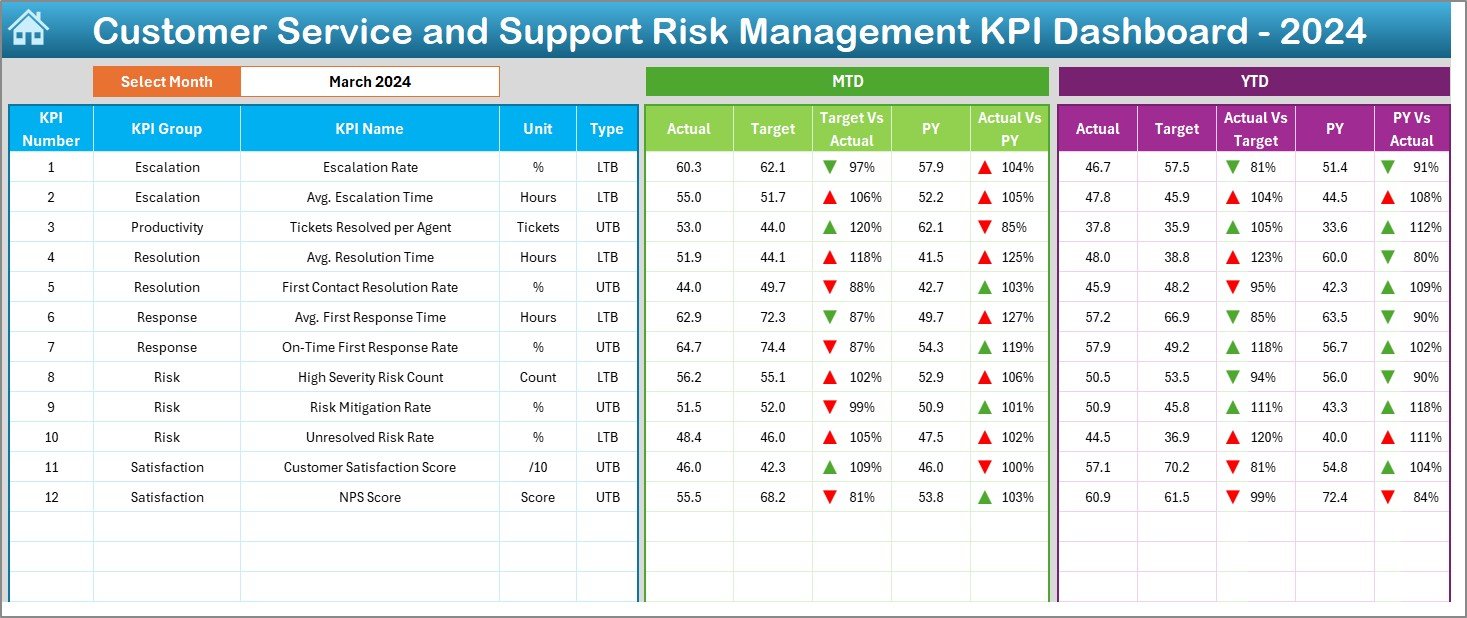
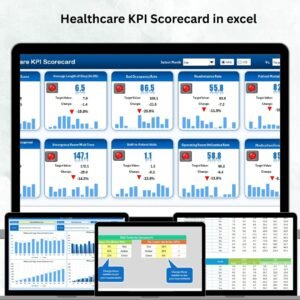
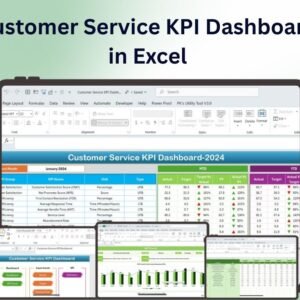
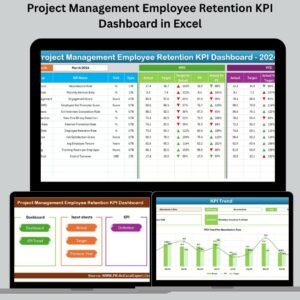
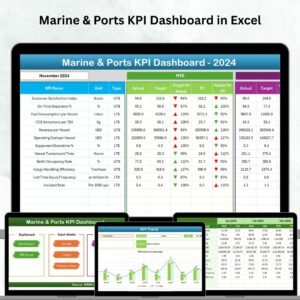
📊 Interactive Dashboard
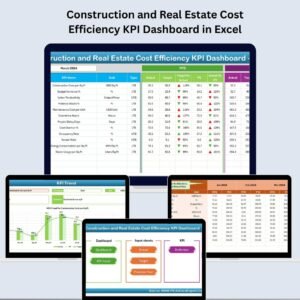
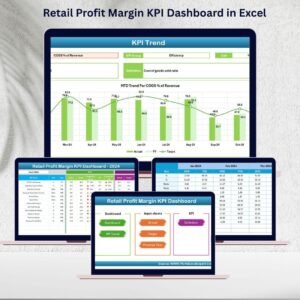
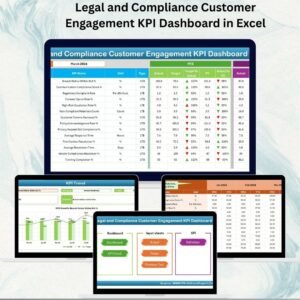
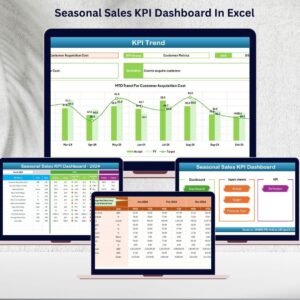
View all KPIs in one place with our Dashboard Sheet—select a month and instantly see MTD/YTD Actuals, Targets, Previous Year values, and color-coded performance arrows.
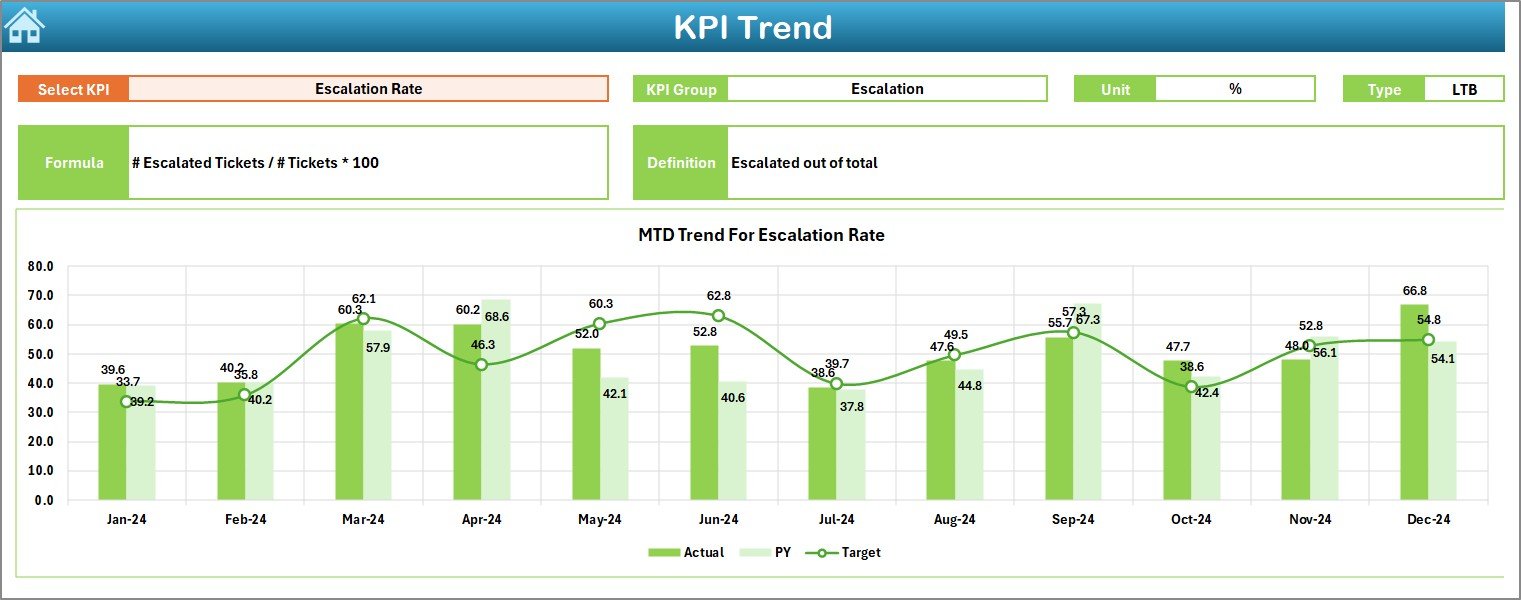
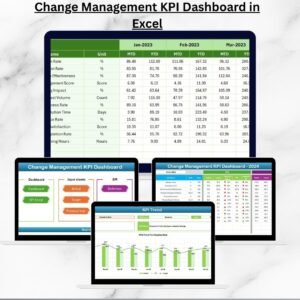
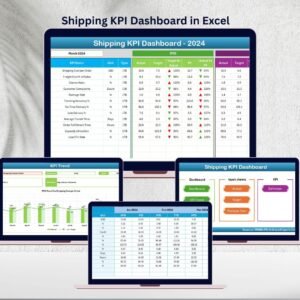
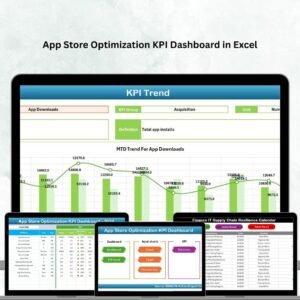
📈 KPI Trend Visualization
Monitor KPI performance trends over time with drop-down-based selection, showing both MTD and YTD charts.
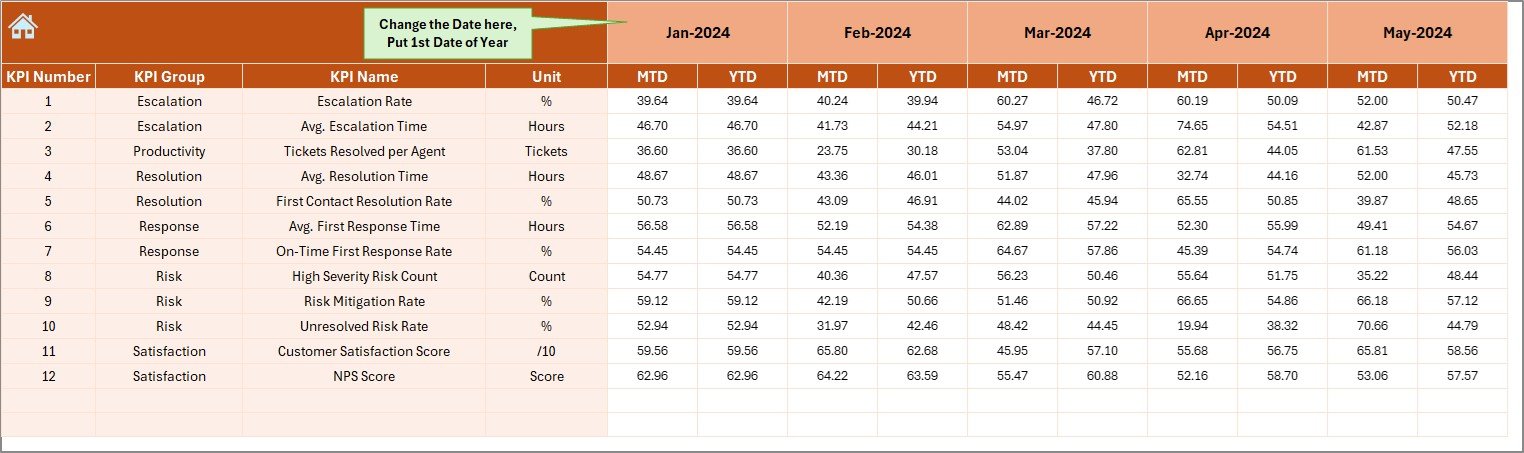
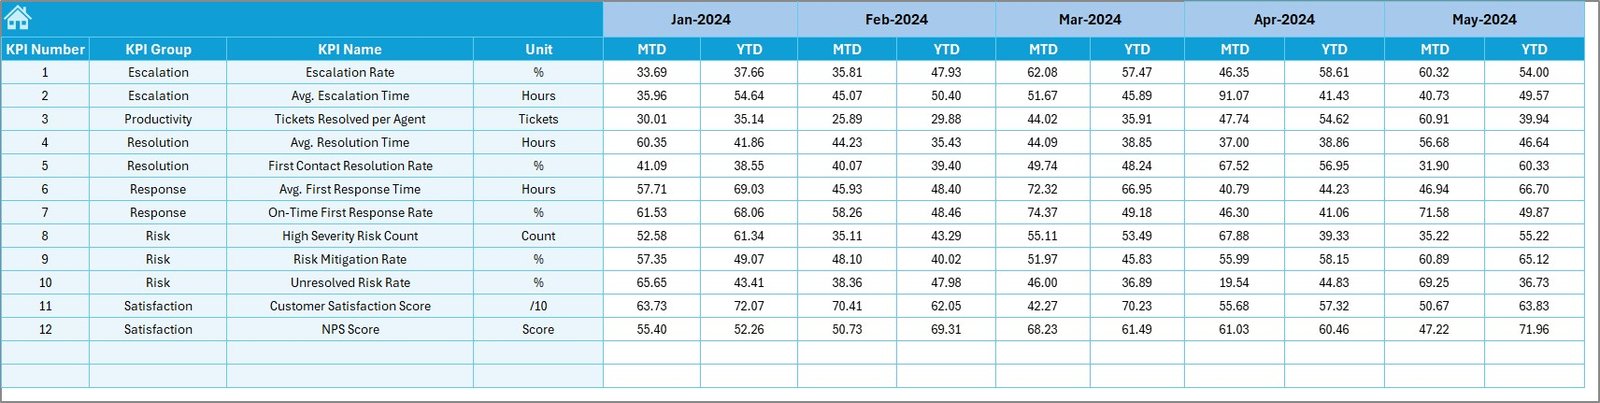
🔢 Real-Time Data Entry
Enter monthly actuals in the Actual Numbers Input Sheet and manage risk based on real-time figures.
🎯 Target Management
Set KPI goals clearly in the Target Sheet to benchmark success and identify gaps early.
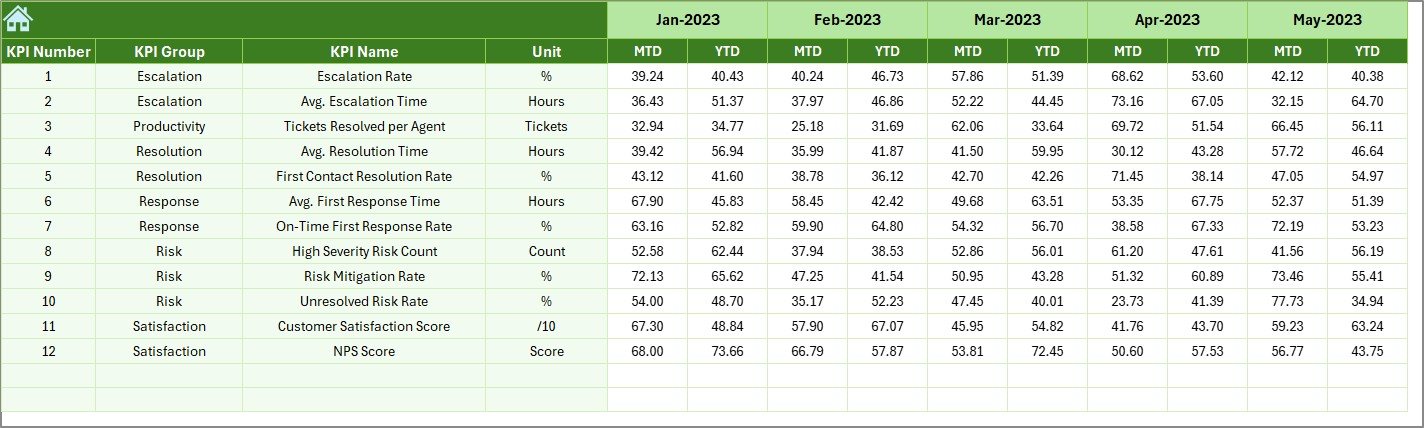
🔄 Previous Year Comparison
Use the Previous Year Numbers Sheet to benchmark performance and forecast improvement areas.
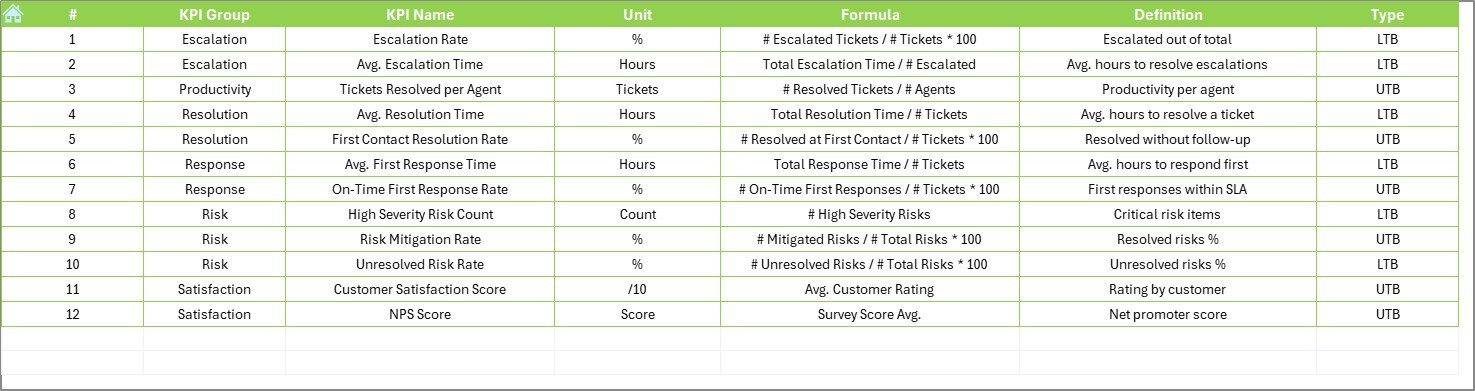
🧾 Reference-Ready KPI Definitions
Quickly understand each KPI’s logic with the KPI Definition Sheet covering Units, Formulas, and Descriptions.
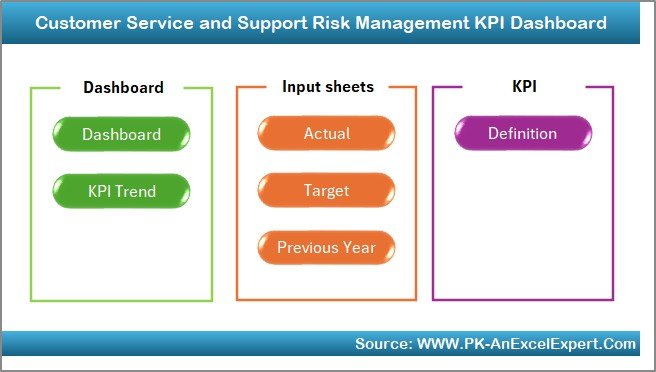
📂 What’s Inside the Dashboard Template
Your download includes 7 expertly crafted worksheets:
-
Home Sheet – Navigation panel with shortcut buttons
-
Dashboard Sheet – Visual performance summary (MTD/YTD)
-
KPI Trend Sheet – Trend analysis with charts
-
Actual Numbers Input Sheet – Monthly data entry
-
Target Sheet – Define MTD/YTD benchmarks
-
Previous Year Numbers Sheet – Baseline data
-
KPI Definition Sheet – Complete KPI glossary
All sheets are interlinked and structured for seamless updates and analysis.
🛠️ How to Use the Dashboard
-
Start at the Home Sheet – Navigate to any section with a single click.
-
Input Monthly Actuals – Go to “Actual Numbers Input” and enter data by KPI.
-
Set Targets & Past Data – Populate the “Target” and “Previous Year” sheets.
-
Use Dropdowns – Select month/KPI to auto-update visuals and performance metrics.
-
Analyze KPI Trends – Spot outliers, deviations, or improvement areas using arrows and charts.
-
Review Definitions – Stay aligned with standardized metrics via the KPI Definition Sheet.
This no-fuss Excel tool keeps everything easy, clean, and professional!
👥 Who Can Benefit from This Dashboard
🔸 Customer Service Teams – Monitor resolution time, complaints, escalations
🔸 Support Managers – Make informed staffing and training decisions
🔸 CX Analysts – Use data to forecast and improve experience
🔸 Startup Founders – Track service KPIs from day one
🔸 Large Enterprises – Scale insights across departments
🔸 Risk Officers – Identify early warning signals in customer care
Whether you’re handling 10 tickets or 10,000—this dashboard scales with your needs.


Reviews
There are no reviews yet.