Customer service is no longer just a cost center—it’s a revenue generator! With the Customer Service and Support Revenue Tracking KPI Dashboard in Excel, you gain powerful insights into how your support team contributes directly to your bottom line. 📈💬
This ready-to-use Excel dashboard tracks key revenue-driven KPIs like Upsell Conversion Rate, Revenue per Resolved Ticket, and Customer Retention Revenue—all without needing complex software. Whether you manage a small team or an enterprise-level operation, this dashboard helps you optimize performance, identify trends, and turn your support department into a strategic profit center. 💼🚀
✅ Key Features of Customer Service and Support Revenue Tracking KPI Dashboard in Excel
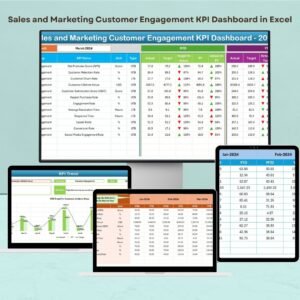
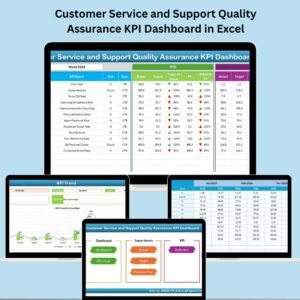
📊 All-in-One Dashboard View
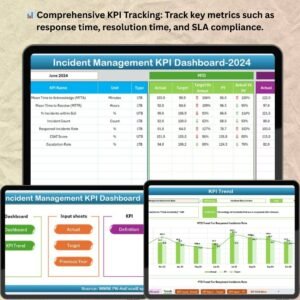
Get MTD & YTD metrics, with Actual vs. Target vs. Previous Year figures—all on one interactive page!
🔽 Drop-Down Month Selector
Easily filter the dashboard by month using a simple dropdown in cell D3.
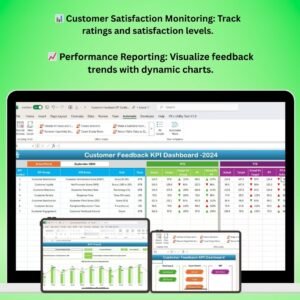
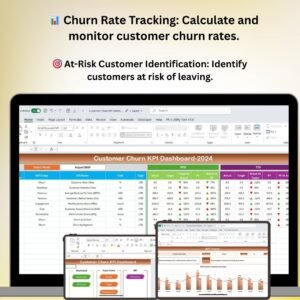
🟢 Up/Down Arrows for Visual Clarity
Conditional formatting with arrows instantly shows performance movement.
📈 KPI Trend Monitoring
Drill into monthly trends for any KPI and spot early warnings or consistent wins.
🧮 Auto-Syncing Data Sheets
Update your actuals, targets, and previous year data—dashboard adjusts automatically.
📄 Built-In KPI Definitions
Every KPI includes a formula, unit, and definition so your entire team is aligned.
🧰 Zero Coding Required
No macros or VBA needed—just Excel skills you already have.
🧾 7 Organized Worksheet Tabs
From data input to trend analysis, each tab plays a role in delivering actionable insights.
📦 What’s Inside the Dashboard?
Let’s take a look at the 7 essential tabs that make this tool powerful yet easy to use:
🏠 Home Sheet
A central hub with clickable buttons to navigate across the dashboard—no scrolling or searching required.
📊 Dashboard Sheet
This is the main dashboard:
-
Tracks MTD/YTD figures
-
Visualizes performance vs. targets and previous year
-
Shows arrows to indicate progress trends
-
Controlled via month selector (D3)
📈 KPI Trend Sheet
Choose a KPI and instantly view:
-
KPI type, unit, and formula
-
Actual vs. Target vs. Previous Year chart
-
MTD and YTD performance over time
📝 Actual Numbers Input
Input monthly actuals for all KPIs. Set the fiscal year start from cell E1 and keep data current for accurate reporting.
🎯 Target Sheet
Set your monthly and yearly targets. Values automatically feed into all relevant charts and comparisons.
📅 Previous Year Sheet
Enter historical data for a side-by-side view with current results.
🧾 KPI Definition Sheet
Maintain a standardized KPI list with:
-
KPI Group
-
Name
-
Formula
-
Unit
-
Definition
-
Type (UTB or LTB)
🛠️ How to Use the Dashboard
-
📥 Download & Open the Excel file
-
🔓 Enable Editing & Macros if prompted
-
📆 Select Your Month from the drop-down (cell D3)
-
📌 Input Monthly Actuals in the Actual Numbers sheet
-
🎯 Set Targets in the Target sheet
-
🕰️ Add Previous Year Data for comparison
-
📊 Explore Trends and visualize KPI growth or drops
-
✍️ Customize KPIs in the KPI Definition sheet if needed
👥 Who Can Benefit from This Dashboard?
💼 Customer Support Managers – Track how support drives revenue
📈 Sales & CX Teams – Align upselling and retention goals
🏢 Startups & SMEs – Get enterprise-level insights with just Excel
🎯 KPI Analysts – Monitor ROI on support operations
🧑💻 Executives – Evaluate support performance without needing BI tools
💬 Support Agents – Understand goals and personal impact on company revenue
🔗 ### Click here to read the Detailed blog post
🔗 Visit our YouTube channel to learn step-by-step video tutorials


Reviews
There are no reviews yet.