

In today’s fast-paced business environment, managing customer service operations efficiently without overspending is critical. That’s why we created the Customer Service and Support Cost Efficiency KPI Dashboard in Excel — a powerful, ready-to-use solution that tracks essential cost-performance metrics, boosts team accountability, and helps you make data-driven decisions — all in one place! 💡📊
Built with user-friendliness in mind, this Excel dashboard offers stunning visuals, effortless data updates, and strategic insights — without the need for expensive BI tools or coding knowledge.
✅ Key Features of Customer Service and Support Cost Efficiency KPI Dashboard
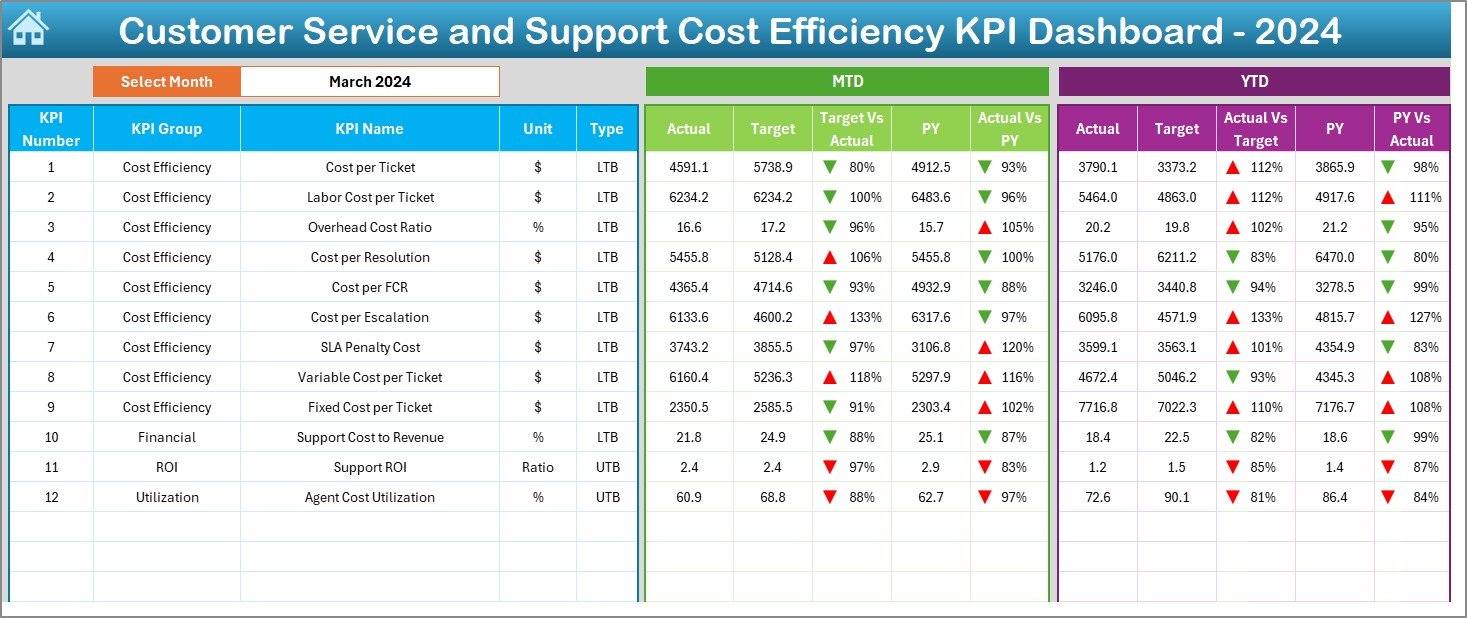
🔹 Month Selector Dropdown: View MTD and YTD metrics by simply selecting the desired month.
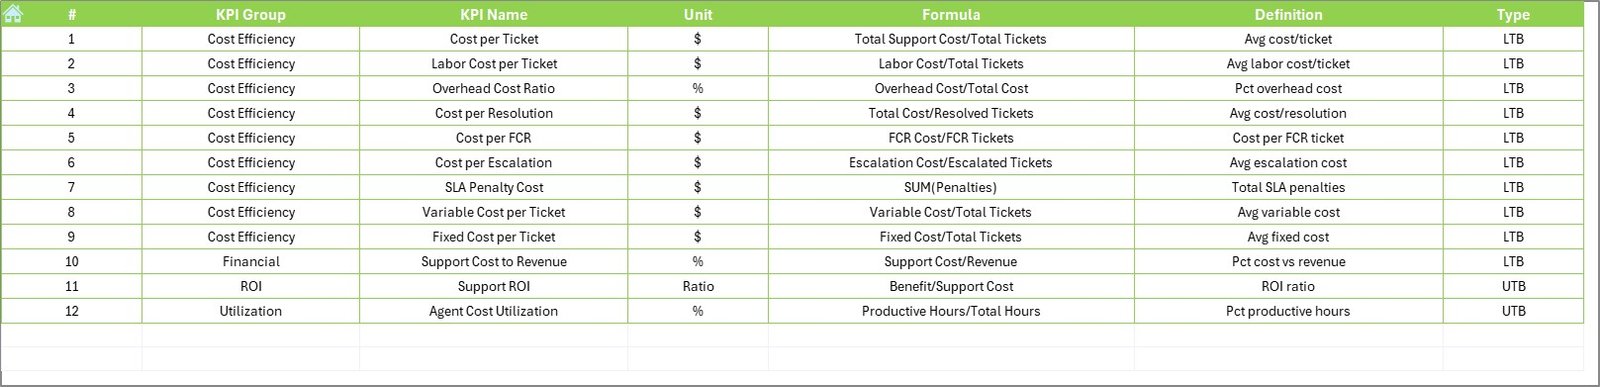
🔹 Dynamic KPI Tracking: Monitor 12+ cost-efficiency KPIs with instant visual insights.
🔹 Conditional Formatting: Built-in arrows and color cues show under- or over-performance.
🔹 PivotTable Compatibility: Designed with Excel PivotTables and Charts for seamless flexibility.
🔹 Automated Trend Charts: Track KPI performance over time with MTD/YTD graphs.
🔹 Side-by-Side Comparisons: Compare Actual vs Target and Actual vs Previous Year in one view.
🔹 Zero Extra Cost: No add-ons or licenses needed — all within Excel! 💯
📦 What’s Inside the Customer Service KPI Dashboard
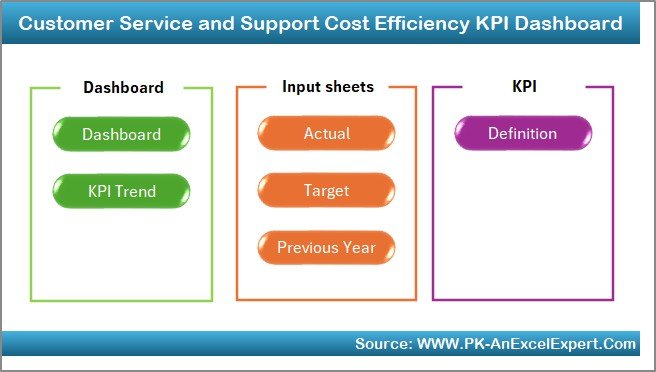
This Excel template is neatly structured into 7 powerful worksheets:
-
Home Sheet: A clickable index page with navigation buttons to each sheet.
-
Dashboard Sheet: Your command center — track all KPIs with trends, comparisons, and visual cues.
-
KPI Trend Sheet: Select any KPI to analyze monthly progress via charts and summaries.
-
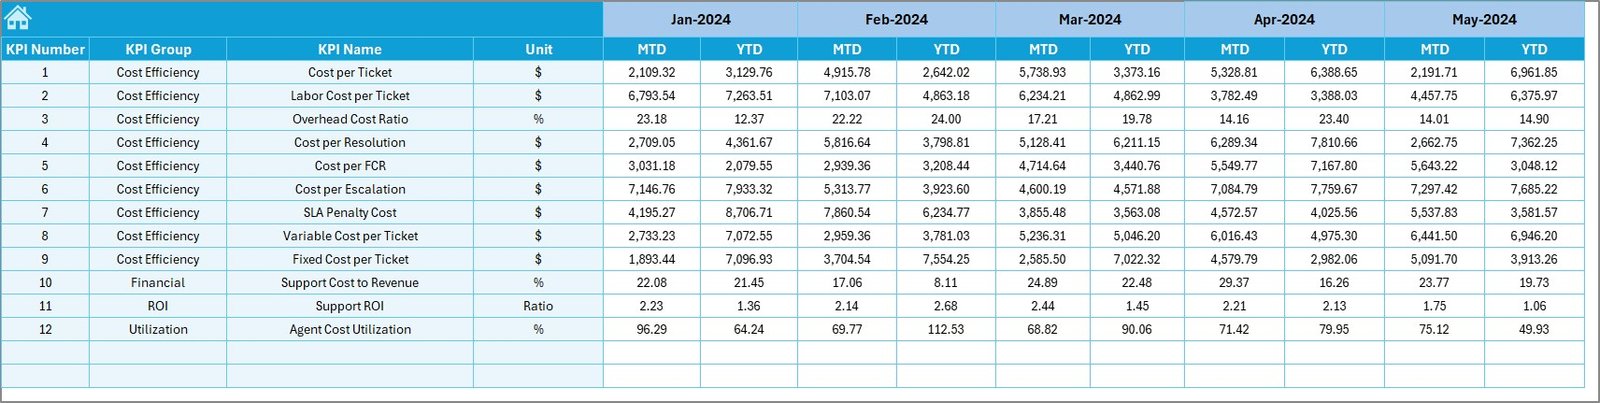
Actual Numbers Input Sheet: Log your monthly MTD and YTD performance with ease.
-
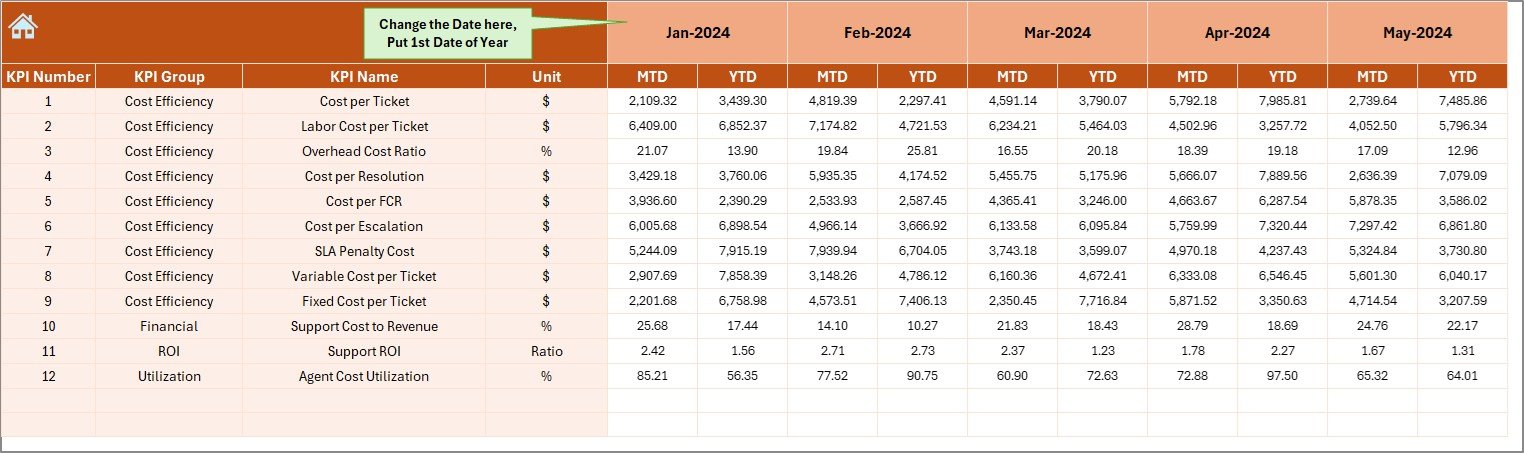
Target Sheet: Set monthly MTD and YTD goals to compare actual outcomes.
-
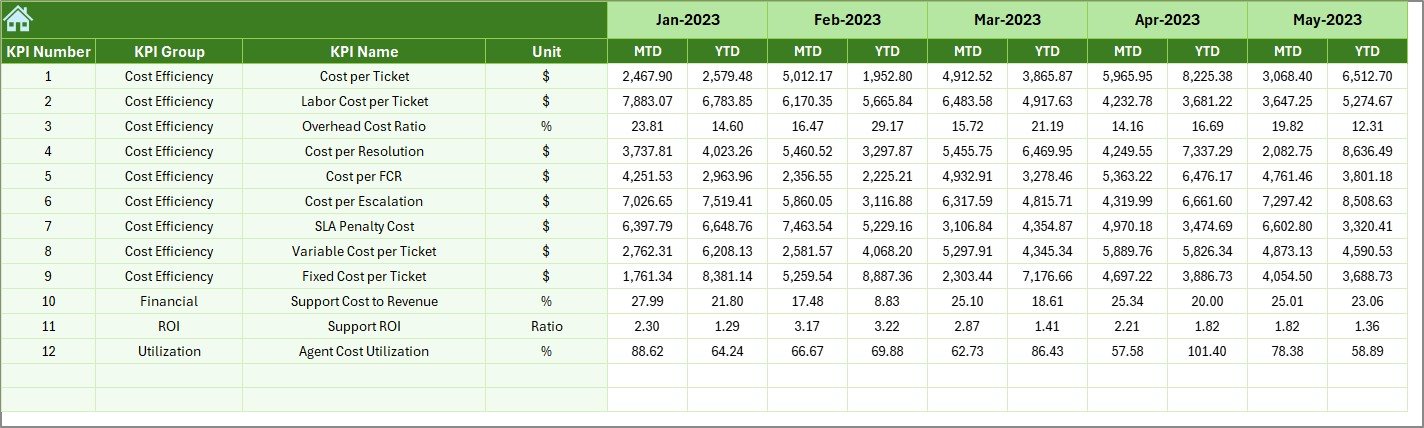
Previous Year Sheet: Input last year’s data to analyze YoY trends.
-
KPI Definition Sheet: Define your KPIs, units, formulas, and whether they are LTB or UTB.
🛠️ How to Use the Customer Service KPI Dashboard
-
Input Monthly Data in the “Actual Numbers” sheet.
-
Define KPI Targets in the “Target” sheet for the full year.
-
Enter Previous Year Data to enable comparisons.
-
Select a Month from the dropdown in the Dashboard to auto-refresh charts.
-
Review Trends in the KPI Trend sheet to guide decision-making.
-
Update Regularly to maintain a real-time view of performance and costs.
No macros, no coding. Just Excel. Just results! 💼
👥 Who Can Benefit from This Dashboard
💼 Customer Support Managers – Monitor KPIs to drive efficiency.
📈 Operations Leaders – Optimize support cost vs output.
💰 Finance Teams – Gain better forecasting and cost transparency.
🧑💼 Executives – Get high-level insights for strategy decisions.
🧑💻 Support Agents – Use for self-review and performance tracking (optional).
📊 SMEs & Startups – An affordable, scalable solution for KPI monitoring.
Whether you’re running a helpdesk, call center, or omnichannel support, this dashboard gives you the clarity and control you need.
🔗 Click here to read the Detailed blog post
🔗 Visit our YouTube channel to learn step-by-step video tutorials


Reviews
There are no reviews yet.