Customer feedback is one of the most powerful drivers of business growth. Reviews, ratings, surveys, complaints, and suggestions reveal what customers truly think about your products and services. However, when feedback data remains scattered across survey tools, Excel files, emails, or CRM exports, teams struggle to extract meaningful insights. Decisions slow down, service gaps remain hidden, and customer dissatisfaction increases.
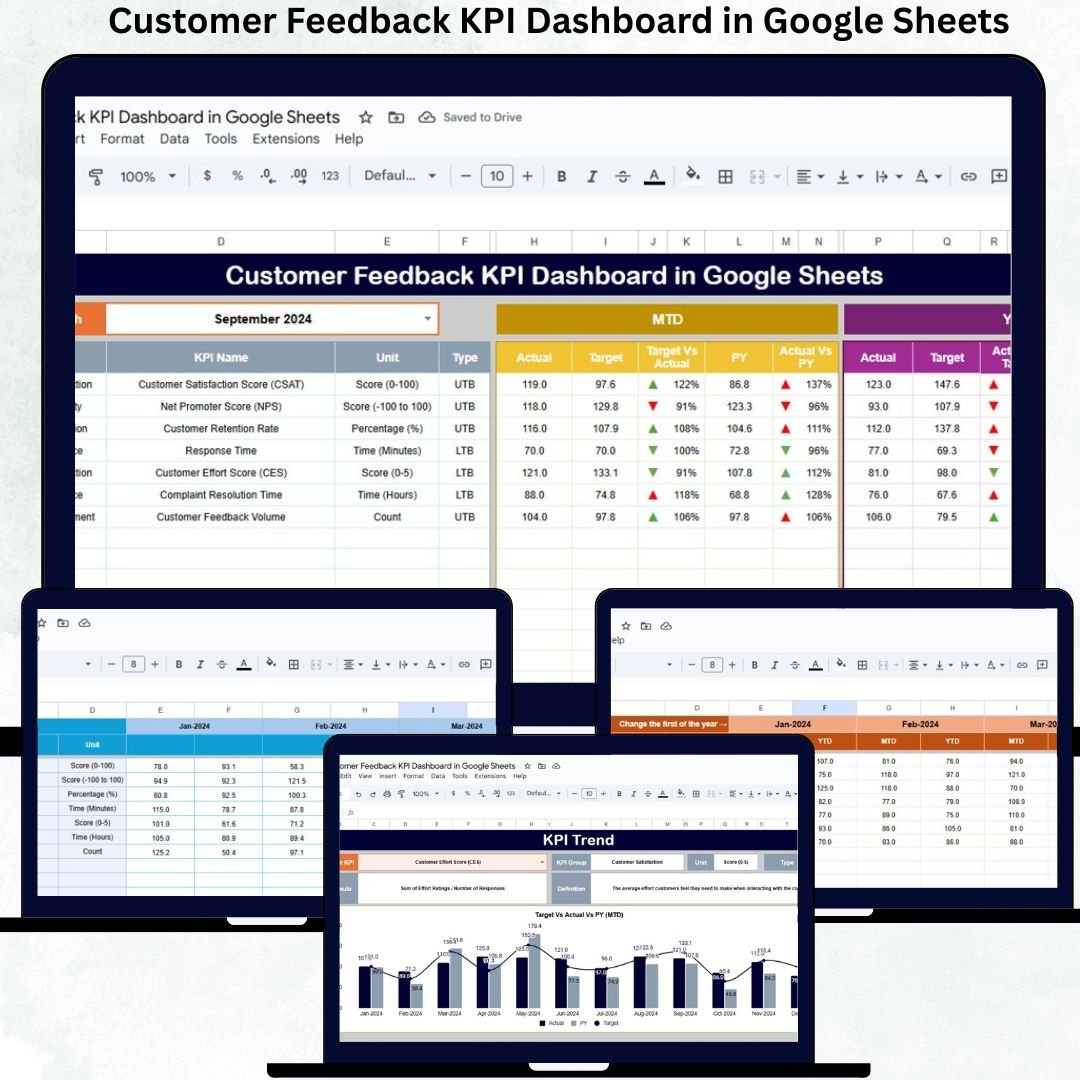
The Customer Feedback KPI Dashboard in Google Sheets solves this challenge by converting raw feedback data into clear, measurable KPIs. This ready-to-use dashboard allows organizations to track customer satisfaction, monitor complaint trends, evaluate response efficiency, and measure improvement over time. Because it works entirely in Google Sheets, teams can collaborate in real time without expensive analytics or CX tools.
🚀 Key Features of the Customer Feedback KPI Dashboard
✅ Centralized customer feedback performance tracking
✅ MTD and YTD KPI monitoring
✅ Target vs actual comparison
✅ Previous year benchmarking
✅ Trend analysis for every KPI
✅ Clear KPI definitions for consistency
✅ Automated calculations
✅ Fully built in Google Sheets
This dashboard turns customer opinions into data-driven decisions.
📊 What’s Inside the Customer Feedback KPI Dashboard
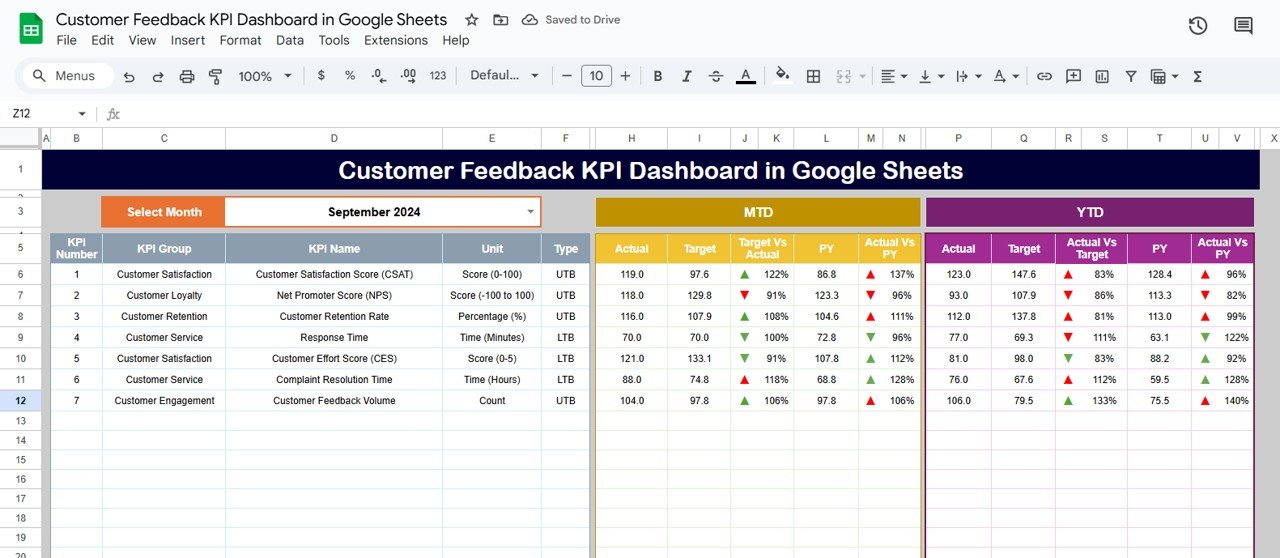
🧭 Dashboard Sheet Tab – Main Overview
This is the executive-level control panel.
At the top, you select the Month from a dropdown in cell D3. Instantly, the dashboard refreshes all values.
MTD (Month-to-Date) Section Includes:
-
MTD Actual
-
MTD Target
-
MTD Previous Year
-
Target vs Actual
-
Previous Year vs Actual
YTD (Year-to-Date) Section Includes:
-
YTD Actual
-
YTD Target
-
YTD Previous Year
-
Target vs Actual
-
Previous Year vs Actual
Conditional formatting with green and red arrows highlights performance improvement or decline, helping leaders understand customer sentiment at a glance.
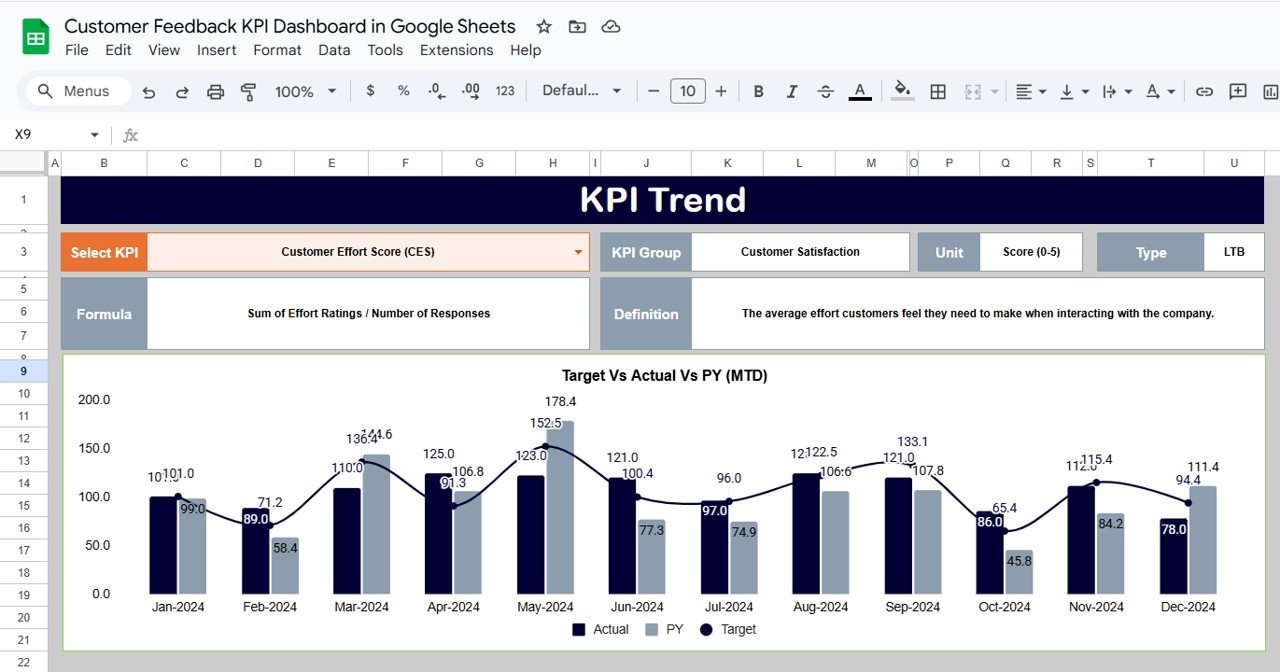
📈 KPI Trend Sheet Tab – Deep KPI Analysis
This sheet enables detailed KPI-level insight.
You select a KPI from the dropdown in cell C3, and the sheet displays:
-
KPI Group
-
KPI Unit
-
KPI Type (Upper the Better / Lower the Better)
-
KPI Formula
-
KPI Definition
A month-wise trend chart shows how customer experience metrics change throughout the year. This helps teams identify recurring issues, seasonality patterns, and improvement impact.
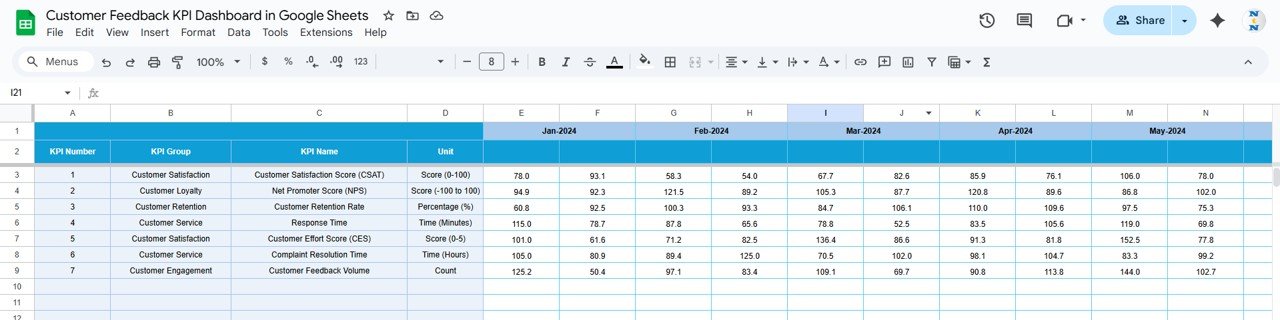
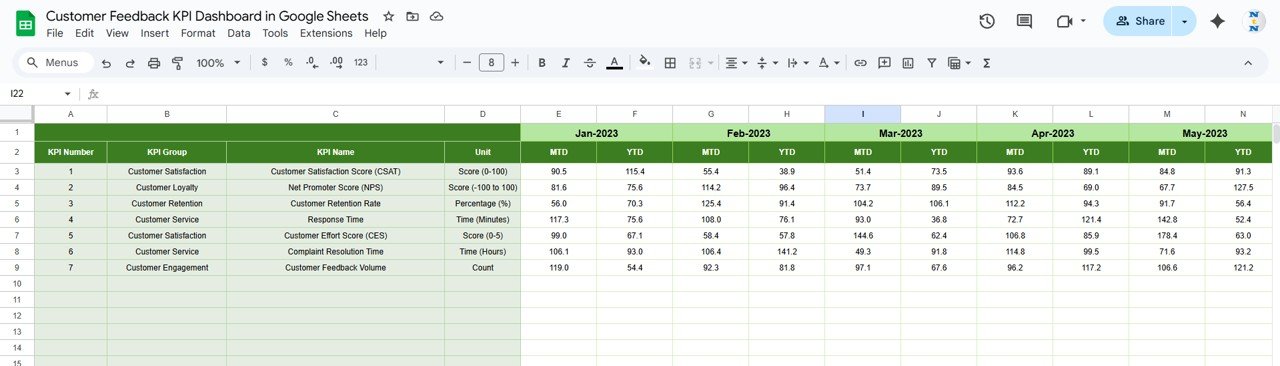
🧮 Actual Number Sheet Tab
This is the data input sheet for real performance values.
-
Enter MTD Actual and YTD Actual numbers
-
Select the first month of the year in cell E1
-
All dashboard visuals update automatically
This sheet acts as the data foundation of the dashboard.
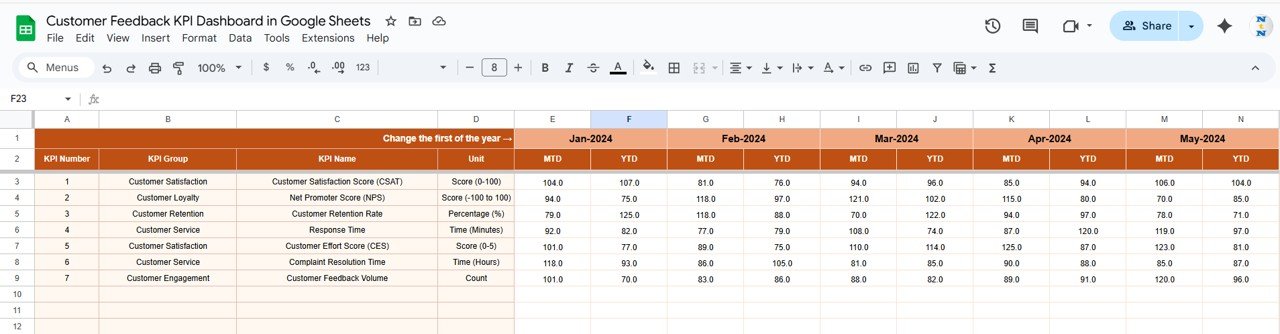
🎯 Target Sheet Tab
This sheet stores performance goals for each KPI:
-
Monthly (MTD) targets
-
Annual (YTD) targets
Targets help teams align feedback performance with customer experience objectives and service benchmarks.
⏳ Previous Year Number Sheet Tab
This sheet holds last year’s performance values.
It supports:
-
Year-over-year comparison
-
Long-term improvement measurement
-
Repeating issue identification
Leadership can clearly see whether customer experience is improving over time.
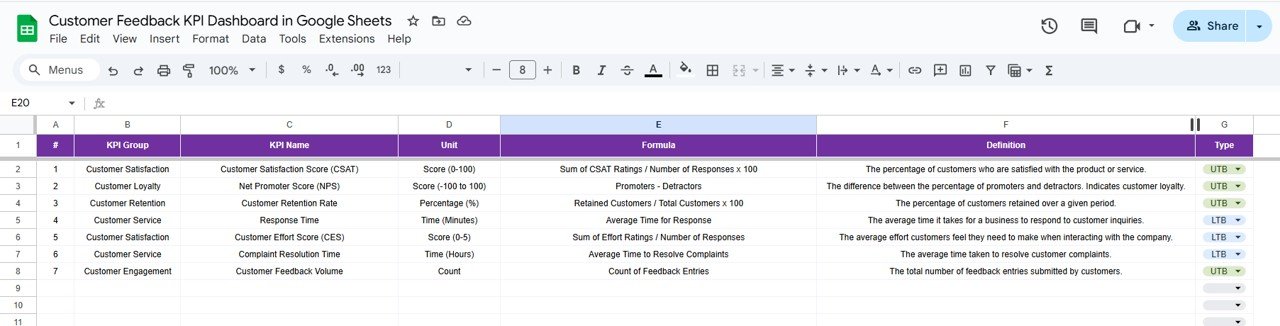
📚 KPI Definition Sheet Tab
This governance sheet ensures everyone understands each KPI clearly.
It contains:
-
KPI Name
-
KPI Group
-
Unit
-
Formula
-
Definition
-
KPI Type (LTB / UTB)
This eliminates confusion and ensures consistent reporting across teams.
⚙️ How to Use the Customer Feedback KPI Dashboard
1️⃣ Enter actual feedback performance data
2️⃣ Set monthly and yearly targets
3️⃣ Review KPI trends and comparisons
4️⃣ Identify declining or improving metrics
5️⃣ Take corrective action based on insights
No technical or coding knowledge required.
👥 Who Can Benefit from This Dashboard
-
📞 Customer Support Teams
-
🎯 Customer Experience (CX) Teams
-
📣 Marketing Teams
-
🧩 Quality & Service Teams
-
🧑💼 Business Leaders & Management
Perfect for startups, service companies, product businesses, and enterprises.
✅ Advantages of the Customer Feedback KPI Dashboard
✔ Centralized customer voice tracking
✔ Faster issue identification
✔ Improved service quality
✔ Better customer retention
✔ Clear department-wide visibility
✔ Easy reporting in Google Sheets
🔧 Opportunities for Improvement
You can extend the dashboard by adding:
-
Survey tool integration
-
Sentiment analysis scoring
-
Product or service-wise feedback tracking
-
SLA alerts for delayed responses
-
Advanced analytics using Apps Script
✅ Best Practices
-
Update feedback data regularly
-
Analyze trends, not individual months
-
Set realistic customer experience targets
-
Act quickly on negative feedback
-
Share insights across departments
-
Maintain KPI definitions consistently
✅ Conclusion
The Customer Feedback KPI Dashboard in Google Sheets helps organizations transform customer opinions into measurable performance insights. By tracking satisfaction, complaint handling, and service improvement metrics, teams make faster and smarter decisions. Because the dashboard is simple, flexible, and collaborative, it becomes a powerful tool for delivering consistent and improved customer experiences—without complexity.
Click here to read the Detailed blog post
Watch the step-by-step video tutorial:


Reviews
There are no reviews yet.