

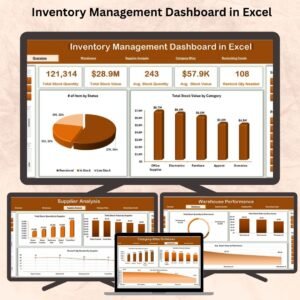
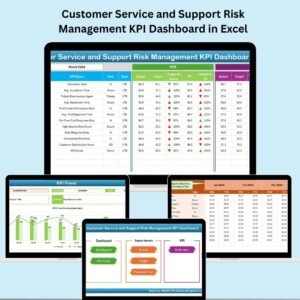
Struggling to manage your support inventory and track KPIs with clarity? Say goodbye to complex spreadsheets and hello to our CS and Support Inventory Management KPI Dashboard in Excel—a powerful tool built to bring structure, insight, and performance optimization to your CS and support operations.
This ready-to-use Excel dashboard is your go-to solution for monitoring inventory turnover, fulfillment timelines, product availability, and more—all with interactive visuals, automated trends, and user-friendly navigation. Whether you manage spare parts, returns, or SLA performance, this template ensures you’re always in control.
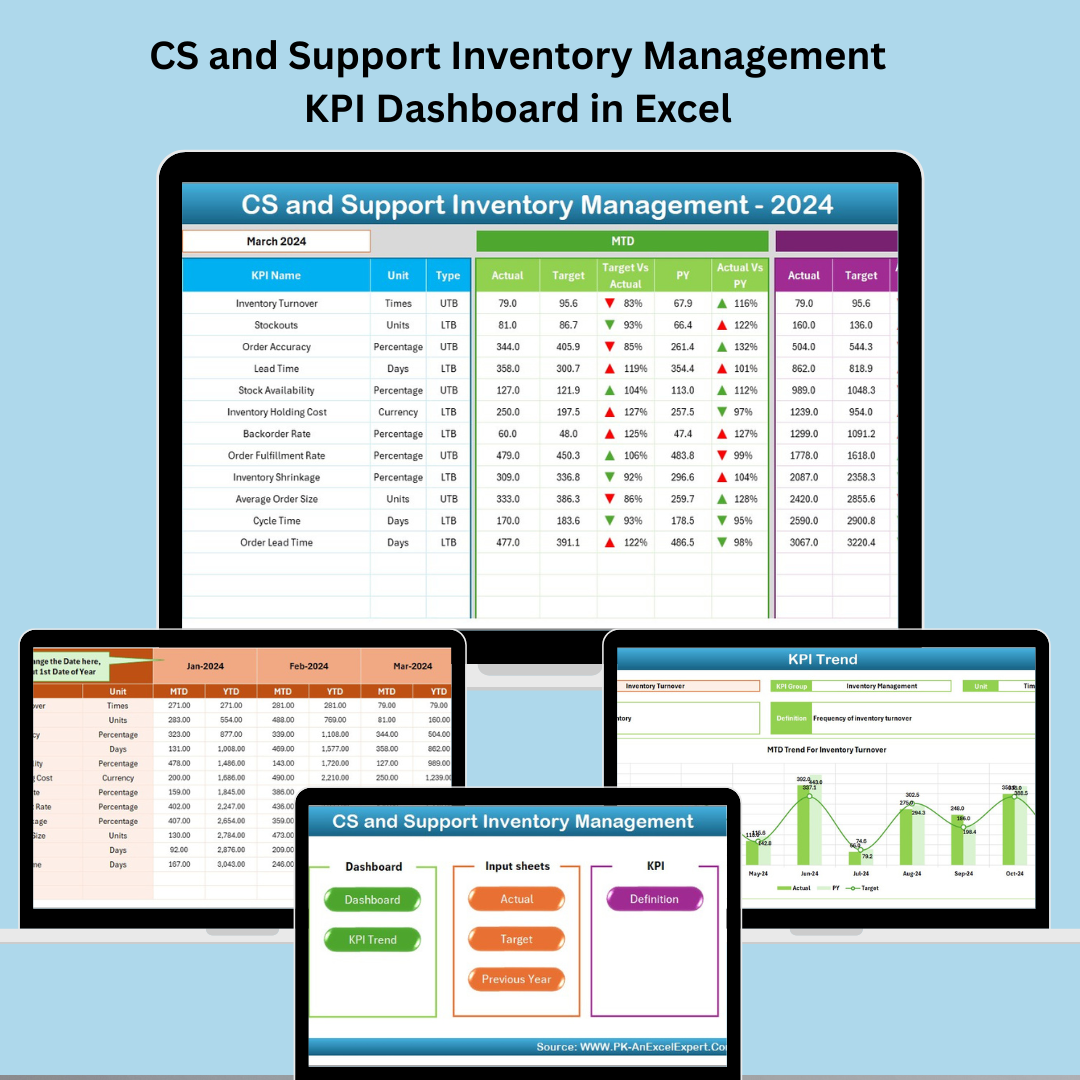
✨ Key Features of Customer Service and Support Inventory Dashboard
🏠 Home Sheet – Your Navigation Hub

-
🖱️ 6 clickable buttons to access each sheet
-
🎯 Easy navigation ensures a smooth user experience
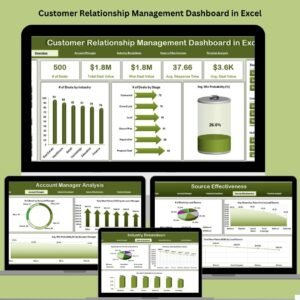
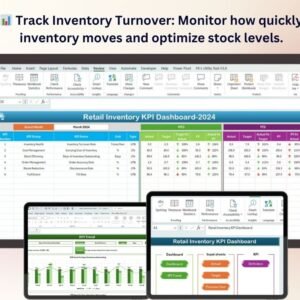
📊 Dashboard Sheet – Visualize KPIs Instantly
-
📅 Select a month from the dropdown
-
🔄 View MTD & YTD data: Actual, Target, and PY
-
🟢🔴 Conditional formatting with trend arrows for Target vs. Actual and PY comparisons
📈 KPI Trend Sheet – Monitor Performance Over Time
-
📌 Pick a KPI and view trend charts for MTD and YTD
-
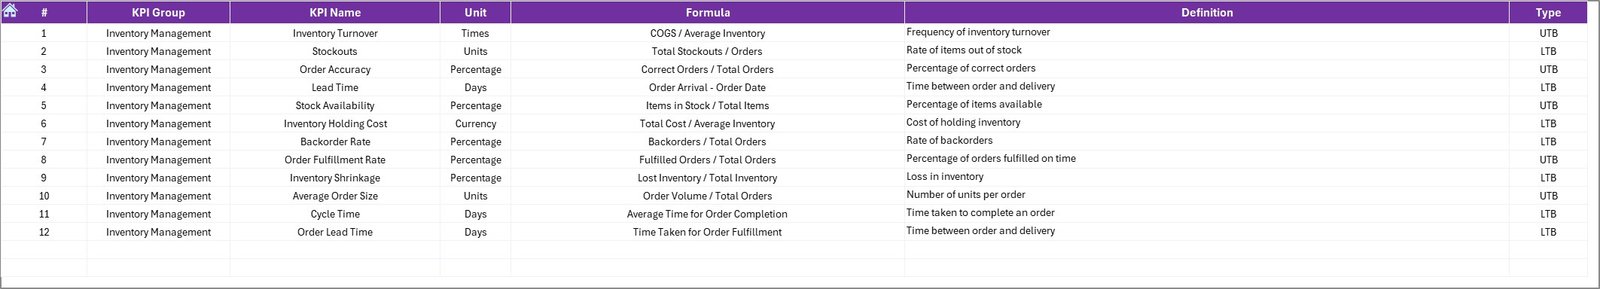
📋 Displays KPI Group, Unit, Formula, Type (LTB or UTB), and Definition
-
📉 Analyze long-term shifts and performance trends
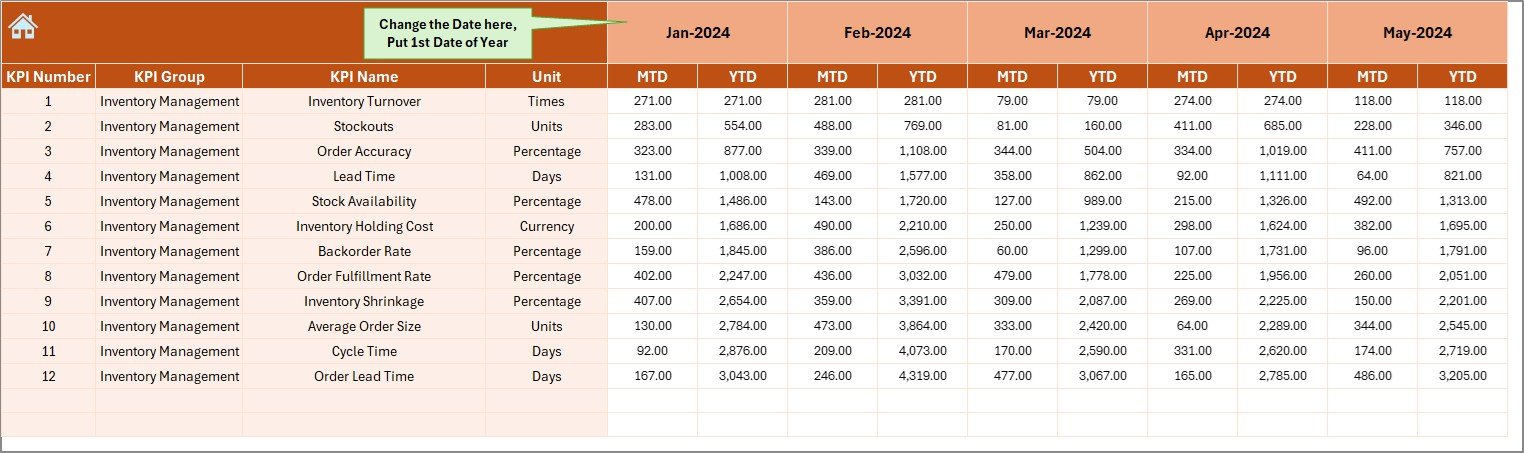
📝 Actual Numbers Input Sheet – Real-Time Data Capture
-
🗓️ Set your starting fiscal month (cell E1)
-
📥 Input actuals for each month — updates dashboard automatically
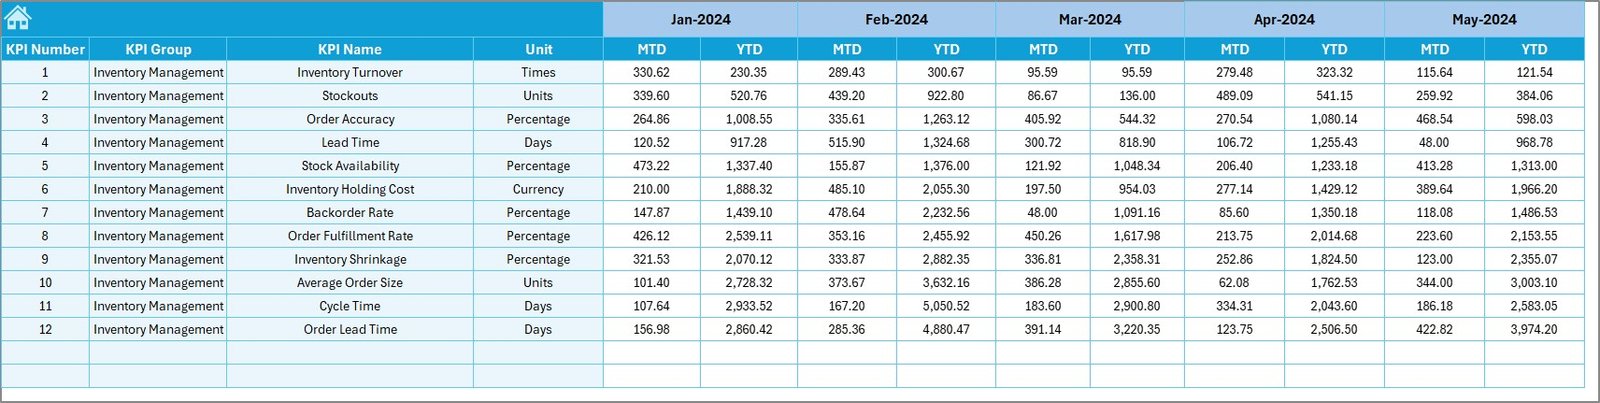
🎯 Target Sheet – Set Monthly & Annual Goals
-
🎯 Define MTD and YTD targets per KPI
-
📏 Clear comparison foundation for success metrics
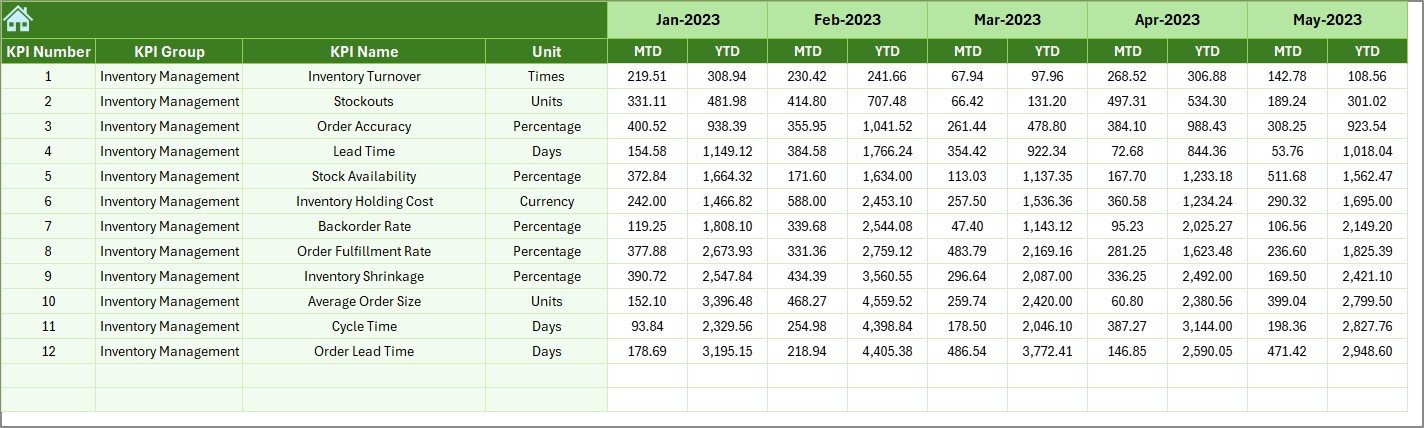
📆 Previous Year Number Sheet – Benchmark Against the Past
-
📊 Record last year’s data for accurate comparisons
-
🕵️ Track improvements or declines year-over-year
📚 KPI Definition Sheet – Maintain Clarity
-
✅ Add KPI Name, Group, Unit, Formula, Definition, and Type
-
📖 A complete reference guide for team-wide alignment
📂 What’s Inside the Template?
Your download includes 7 interconnected Excel sheets:
-
Home (Navigation)
-
Dashboard (Performance Visualization)
-
KPI Trend (Detailed Analytics)
-
Actual Numbers Input (Current Data Entry)
-
Target Sheet (Goal Setting)
-
Previous Year Numbers (Historical Reference)
-
KPI Definition (KPI Metadata)
All are structured to provide instant updates, reduce manual work, and support accurate decision-making.
🛠️ How to Use the Dashboard
-
⚙️ Start by defining your KPIs in the KPI Definition sheet
-
📆 Input previous year’s data
-
🎯 Set targets in the Target sheet
-
🧾 Add this month’s actuals in the Actual Numbers Input sheet
-
📈 Use the Dashboard and Trend sheets to visualize data instantly
-
🔍 Repeat monthly for continuous improvement tracking
This template is easy to set up, use, and scale—no coding, no Power BI needed!
👥 Who Can Benefit from This Dashboard?
🛠️ Support Operations Teams – Track service fulfillment and stock readiness
📦 Inventory Managers – Monitor levels, avoid stockouts, and reduce costs
📈 CS Executives – Gain real-time KPI visibility across the org
🔍 Business Analysts – Visualize gaps and opportunities in inventory planning
💼 SMEs & Enterprises – Works for businesses of any size or sector
If you’re managing parts, tools, replacements, or customer return logistics—this tool is built for you.
🔗 Click here to read the Detailed blog post
📺 Visit our YouTube channel to learn step-by-step video tutorials


Reviews
There are no reviews yet.