

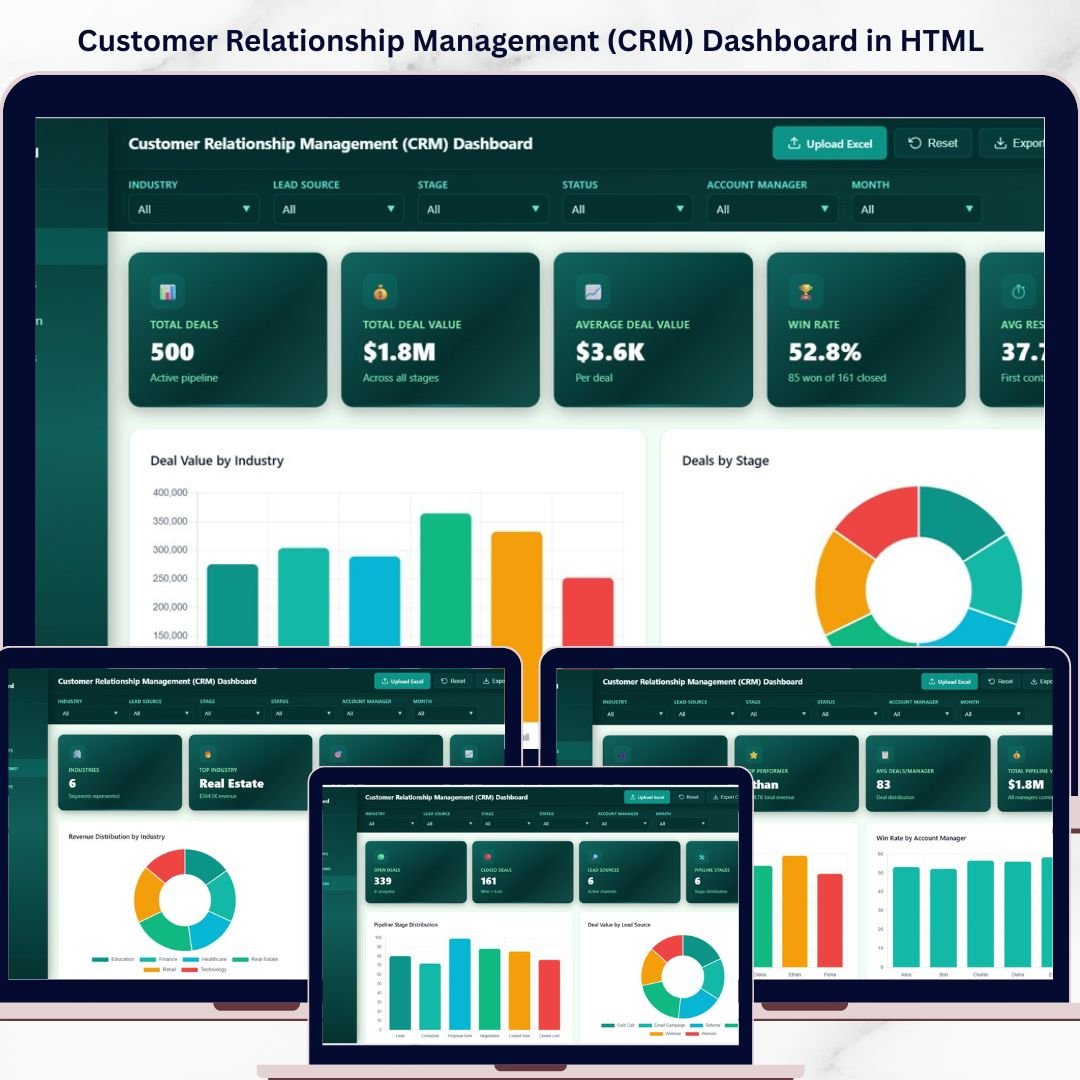



CRM Dashboard in HTML is a professionally designed, interactive, and browser-based analytics template built for sales managers, CRM administrators, account executives, and business leaders who want to monitor deal pipelines, track win rates, analyze account manager performance, and identify revenue opportunities from a single centralized interface. If your customer relationship data is scattered across spreadsheets and disconnected CRM tools, this HTML Dashboard brings everything together into one stunning, filterable, and responsive analytics platform that works instantly in any web browser.
Tracking CRM performance effectively is the key competitive advantage that separates high-growth sales teams from stagnant ones. This Customer Relationship Management (CRM) Dashboard in HTML consolidates all your critical deal data into one dynamic reporting hub. Simply open the file, explore interactive charts, apply filters by industry, lead source, account manager, or deal stage, and uncover the insights that drive better deal closure rates and higher revenue.
🔑 Key Features of CRM Dashboard in HTML
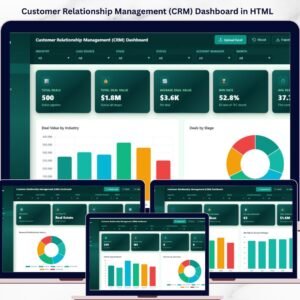
📊 Comprehensive KPI Monitoring — Track essential CRM metrics including Total Deals, Total Deal Value, Average Deal Value, Win Rate, and Avg Response Time all from dynamic KPI cards on the overview page. This dashboard includes 5 interactive pages covering overview analytics, account manager performance, industry breakdown, pipeline and lead sources, and a detailed data view.
📈 Interactive Charts and Visualizations — Analyze CRM performance through dynamic charts such as Deal Value by Industry showing revenue distribution across sectors, Deals by Stage revealing pipeline health, Deal Value by Month tracking revenue trends over time, Deals by Lead Source identifying effective acquisition channels, and Avg Win Probability by Industry measuring conversion potential across segments.
🎯 Smart Filters and Slicers — Instantly filter your data by industry, lead source, account manager, deal stage, and time period to drill down into the exact insights you need for strategic planning and pipeline optimization.
🖥️ Browser-Based — No Software Needed — This dashboard runs entirely inside your web browser. No need to install Excel, Power BI, or any other tool. Just open the HTML file and start analyzing your CRM data immediately.
🎨 Professional SaaS-Style Design — Enjoy a clean, modern, and premium design that looks like an enterprise-grade analytics dashboard application — not a basic spreadsheet.
🔄 Multi-Tab Navigation — Switch between multiple dashboard pages like Overview, Account Managers, Industry Breakdown, Pipeline and Sources, and Data View using smooth tab-based navigation.
📱 Responsive Layout — The dashboard is optimized to work beautifully on desktops, tablets, and mobile devices so you can check your CRM metrics anywhere.
💾 Data Explorer with Export — Access a detailed data table with search functionality, sortable columns, pagination, and CSV export options for deeper analysis and reporting.
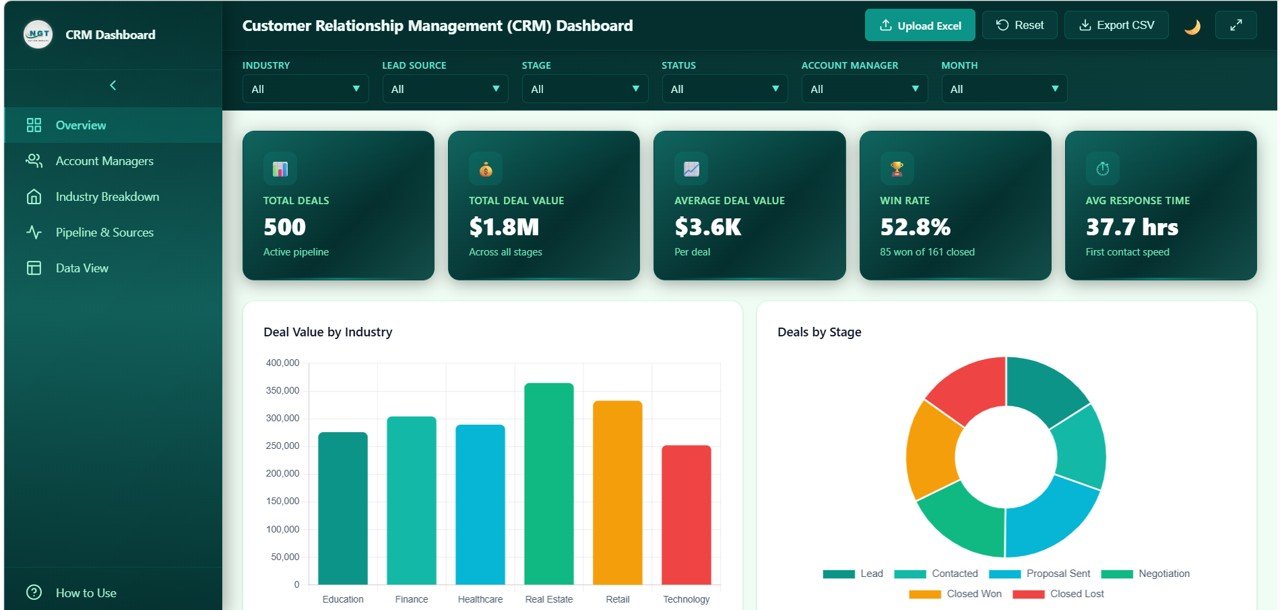 Customer Relationship Management (CRM) Dashboard
📦 What’s Inside the CRM Dashboard in HTML
This dashboard template includes five interactive pages, each designed to give you deep insights into different dimensions of CRM performance:
📌 Overview Page — High-level KPI cards showing Total Deals, Total Deal Value, Average Deal Value, Win Rate, and Avg Response Time. Charts include Deal Value by Industry displaying revenue distribution across business sectors, Deals by Stage breaking down the sales pipeline health, Deal Value by Month revealing revenue trends over time, Deals by Lead Source identifying which acquisition channels bring the most opportunities, and Avg Win Probability by Industry comparing conversion potential across industry segments. Multiple slicers allow filtering for instant targeted analysis.
📌 Account Managers Page — Deep-dive analysis showing Deal Value by Account Manager revealing which team members generate the most revenue, Win Rate by Account Manager comparing closing effectiveness across the sales team, Avg Response Time by Account Manager measuring responsiveness and engagement speed, Stage Distribution by Account Manager showing pipeline allocation per team member, and Avg Deal Value by Account Manager identifying who handles the highest-value opportunities.
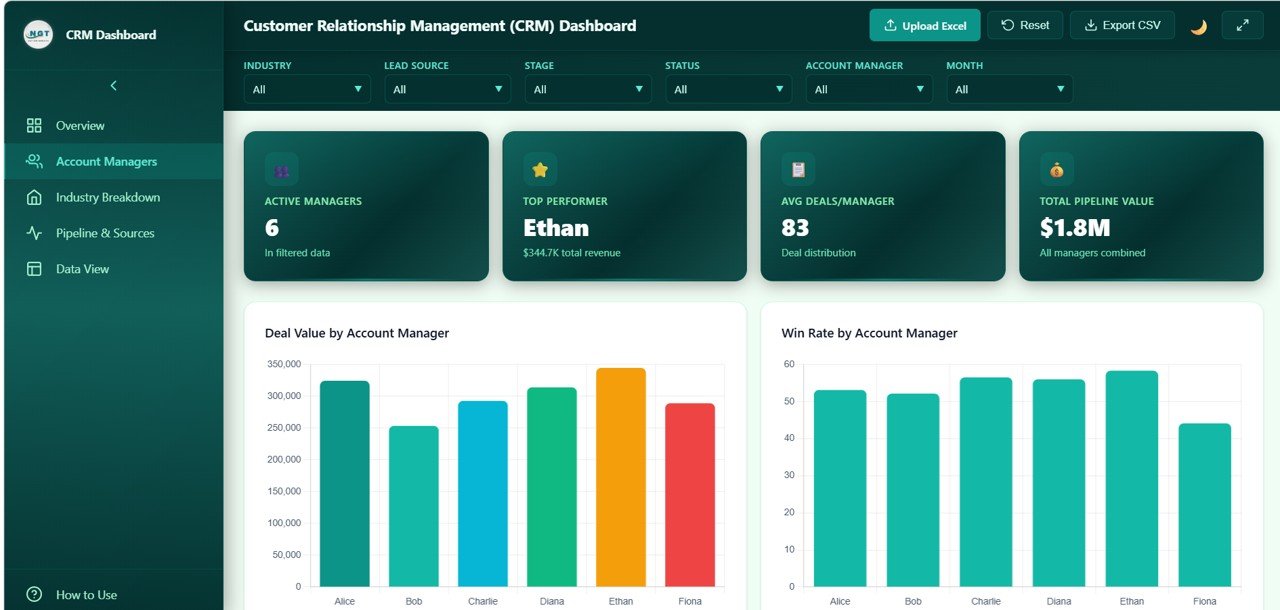 Account Managers
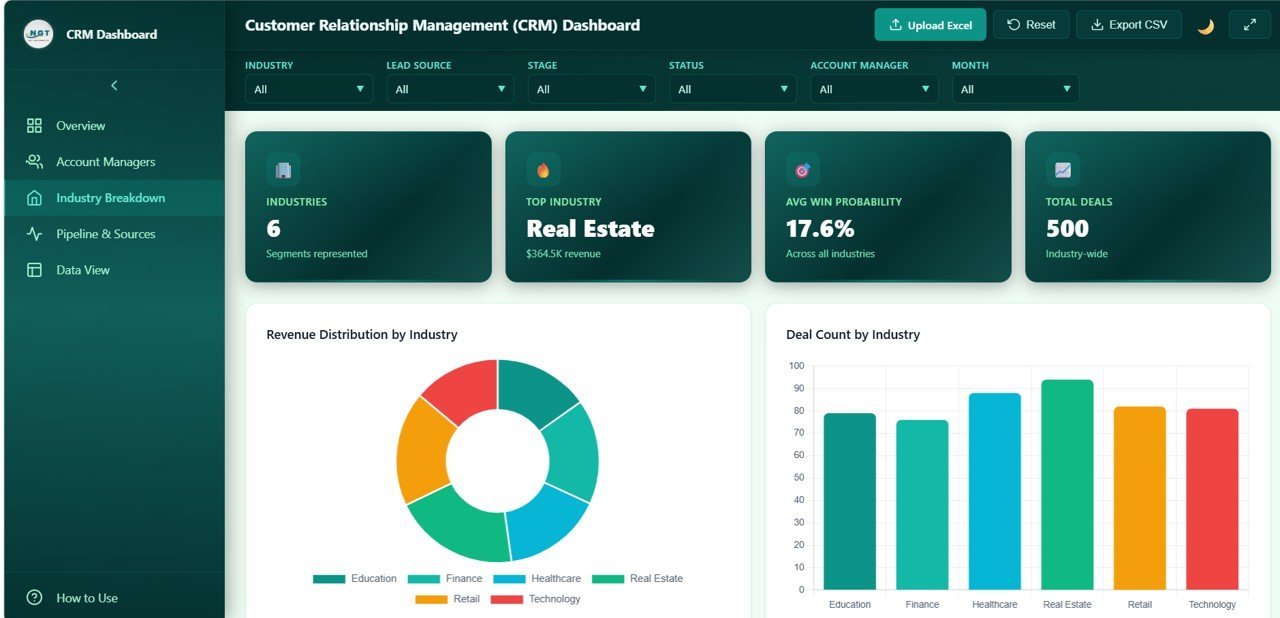
📌 Industry Breakdown Page — Sector-level analytics showing Revenue Distribution by Industry revealing where the biggest deal values are concentrated, Deal Count by Industry measuring opportunity volume per sector, Win Rate by Industry comparing conversion success across verticals, Avg Response Time by Industry tracking engagement speed per sector, and Avg Deal Value by Industry identifying the most lucrative business segments.
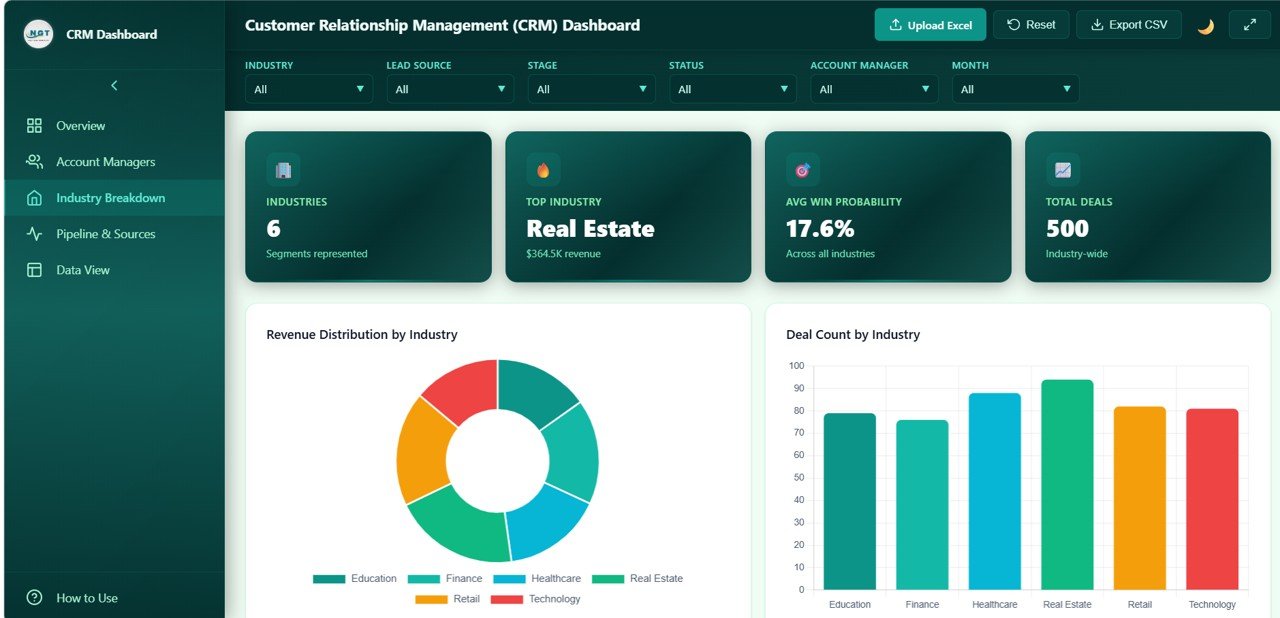 Industry Breakdown
📌 Pipeline and Sources Page — Pipeline health and lead source effectiveness analysis showing Pipeline Stage Distribution visualizing how deals flow through the sales funnel, Deal Value by Lead Source identifying which channels generate the highest-value deals, Win Rate by Lead Source measuring which acquisition methods produce the best conversions, Monthly Deals by Status tracking how new, won, and lost deals change over time, and Avg Response Time by Lead Source revealing which channels demand faster engagement.
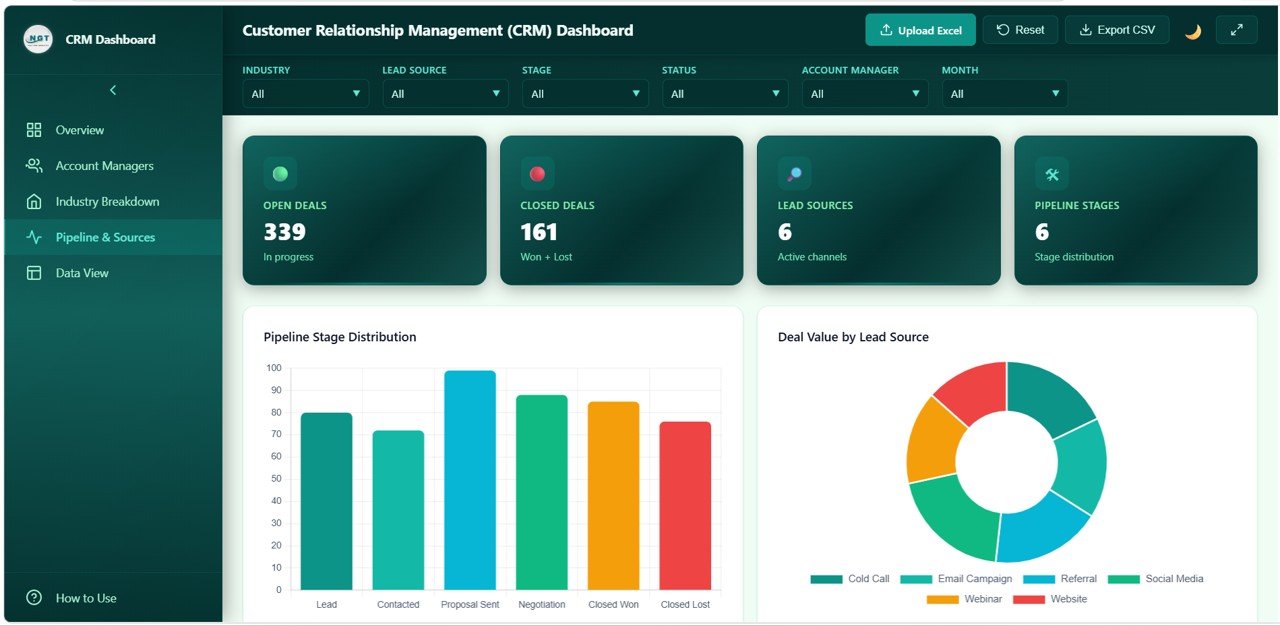 Pipeline and Sources
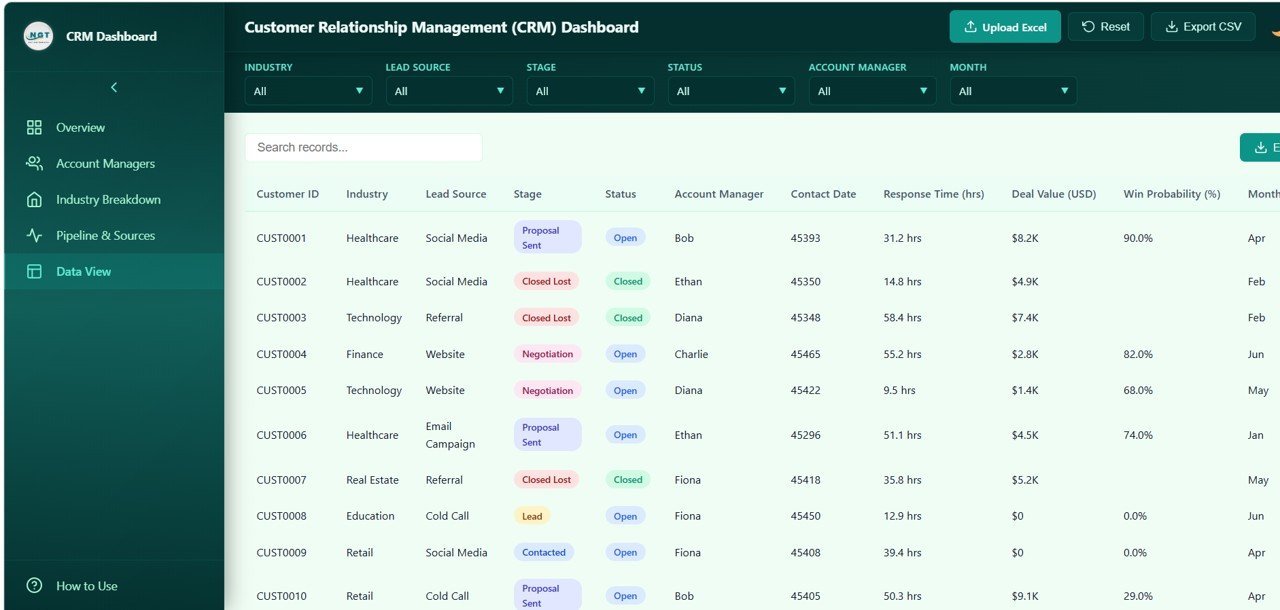
📌 Data View Page — A detailed data table page where you can view all records with search, sort, and pagination features. You can also export the filtered data to CSV for further analysis and auditing.
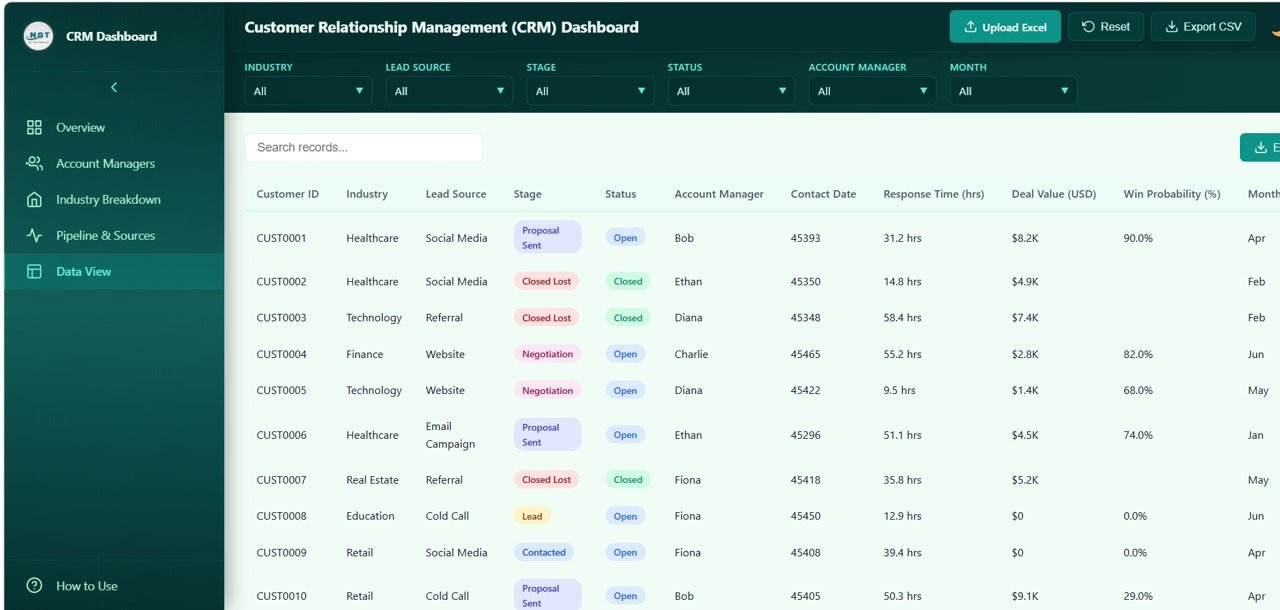 Data View
⚙️ How to Use the CRM Dashboard in HTML
1️⃣ Download the Template — Purchase and download the ZIP file containing the HTML dashboard.
2️⃣ Extract and Open — Unzip the file and open the HTML file in any modern browser like Chrome, Firefox, Edge, or Safari.
3️⃣ Explore the Dashboard — Navigate through the five tabs (Overview, Account Managers, Industry Breakdown, Pipeline and Sources, Data View) to explore different analytical views.
4️⃣ Customize Your Data — Replace the sample data with your actual CRM deal and pipeline data to get real-time sales insights.
5️⃣ Apply Filters — Use the built-in slicers and filters to narrow down your analysis by industry, lead source, account manager, deal stage, and date range.
6️⃣ Export and Share — Export detailed data from the Data View page and share the dashboard file with your team for collaborative decision making.
👥 Who Can Benefit from This CRM Dashboard in HTML
📈 Sales Managers — Monitor deal pipelines, win rates, account manager performance, and revenue trends from a single view.
📊 CRM Administrators — Track data quality, lead source effectiveness, and pipeline health across the entire organization.
💼 Business Development Executives — Analyze deal value distribution, industry opportunities, and conversion probabilities for strategic planning.
🎓 Students and Educators — Use this as a learning tool or project submission for data analytics and business intelligence courses.
📞 Account Managers — Evaluate personal performance metrics including response time, deal value, and win rates to improve sales effectiveness.
🏢 Marketing Teams — Leverage lead source and industry data to optimize marketing spend and campaign targeting for better ROI.
❓ Frequently Asked Questions
What KPIs does the CRM Dashboard in HTML track?
The CRM Dashboard in HTML tracks 5 key performance indicators including Total Deals, Total Deal Value, Average Deal Value, Win Rate, and Average Response Time across 5 interactive dashboard pages.
Do I need coding skills to use this CRM dashboard?
No. Simply download the ZIP file, extract it, and open the HTML file in any modern browser. Replace the sample data with your own CRM data and all charts update automatically.
Can I filter the dashboard by account manager or industry?
Yes. The dashboard includes smart slicers that let you instantly filter data by industry, lead source, account manager, deal stage, and time period for focused analysis.
What is the best CRM dashboard template for tracking sales pipelines?
The CRM Dashboard in HTML is one of the best templates for tracking sales pipelines because it includes pipeline stage distribution, deal value by lead source, win rate analysis, and monthly deal status tracking across 5 interactive pages.
Can I export data from this dashboard?
Yes. The Data View page includes search, sort, pagination, and CSV export functionality so you can extract filtered records for further analysis and reporting.
🔗 Explore Related Templates
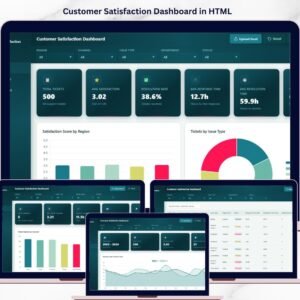
📊 Customer Satisfaction Dashboard in HTML — Track CSAT, resolution time, and feedback trends with interactive analytics.
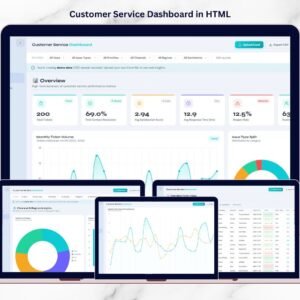
📞 Customer Service Dashboard in HTML — Monitor tickets, response times, agent performance, and satisfaction metrics.
📈 Business Development Dashboard in Google Sheets — Track revenue, profit, and sales channel performance in Google Sheets.
📖 Click here to read the Detailed Blog Post
🎥 Visit our YouTube channel to learn step-by-step video tutorials
👉 YouTube.com/@NextGenTemplates
Watch the step-by-step video tutorial:
Compatibility and Requirements
- Runs in a web browser such as Chrome, Firefox, Edge or Safari. No Excel, Power BI or other software is needed.
- You get a ZIP file that you extract before opening the HTML file.
- Charts, slicers and the Data View table are built into the dashboard pages.
More Questions About This Template
Which pages does the dashboard have?
Five pages: Overview, Account Managers, Industry Breakdown, Pipeline and Sources, and Data View.
Does it work on a phone or tablet?
Yes. The layout is responsive and works on desktops, tablets and mobile devices.
Do I need Excel or Power BI to open it?
No. Open the HTML file in a web browser. Excel and Power BI are not required.
Is there an Excel, Google Sheets or Power BI version?
Yes. See the Customer Relationship Management Dashboard in Excel, the Google Sheets version and the Power BI version.
Related CRM Templates
- Customer Relationship Management Dashboard in Excel: the same CRM topic in Excel
- Customer Relationship Management Dashboard in Power BI: the Power BI edition
- Customer Relationship Management Dashboard in Google Sheets: the Google Sheets edition
- CRM KPI Dashboard in Google Sheets: a KPI view of your CRM data
Browse all HTML dashboards and HTML templates.

Reviews
There are no reviews yet.