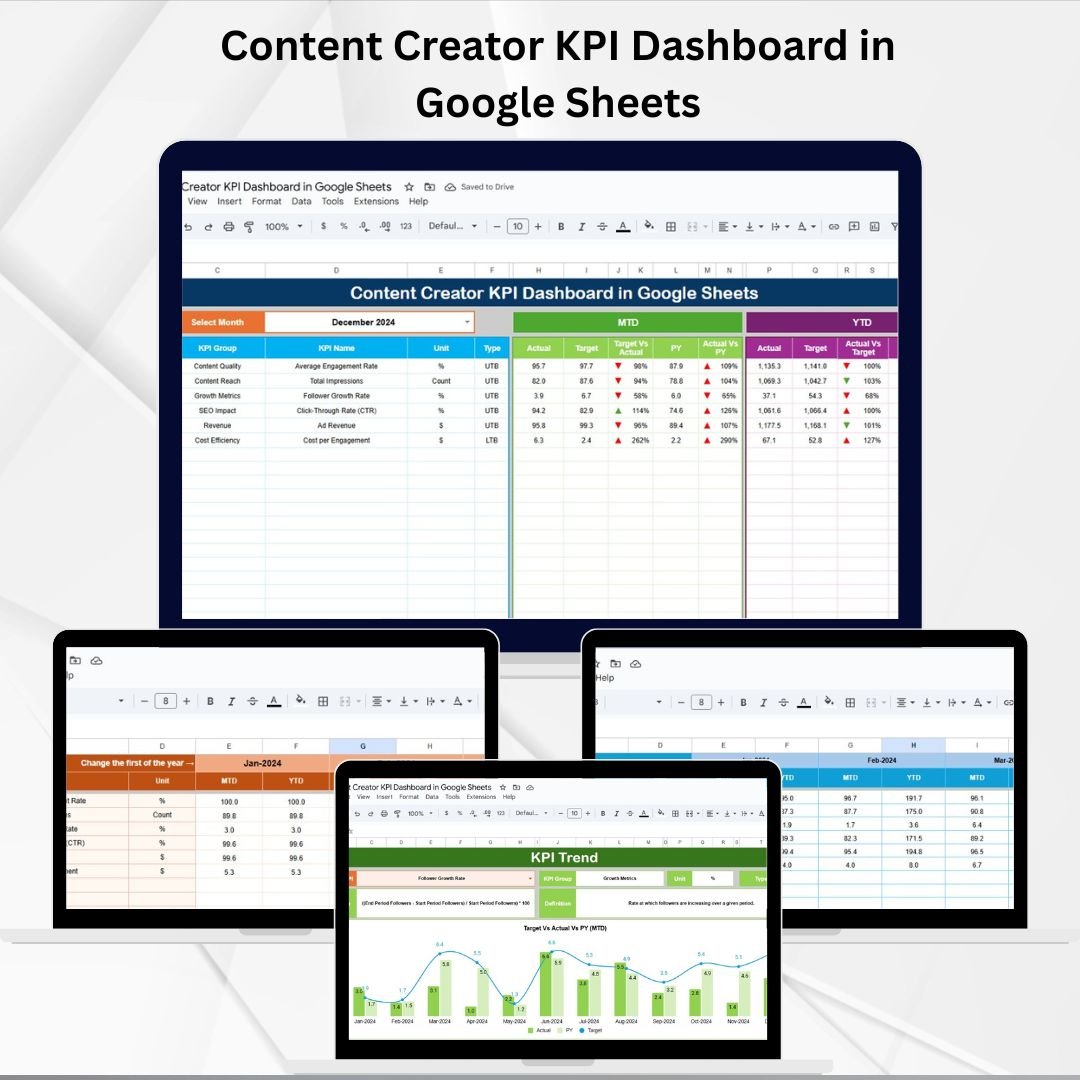
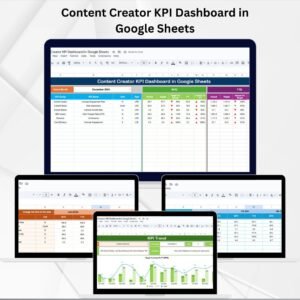
Content creators fuel digital marketing, brand visibility, and online engagement. But without a structured way to measure performance, it’s difficult to know whether your content is driving growth or falling short. That’s where the Content Creator KPI Dashboard in Google Sheets comes in — a ready-to-use, cloud-based solution for tracking, analyzing, and optimizing content creator performance.Content Creator KPI Dashboard in Google Sheets
This interactive dashboard consolidates all key performance indicators (KPIs) in one place, making it easier for marketing managers, social media teams, and content strategists to monitor output, evaluate ROI, and identify trends that improve content strategy. 🚀Content Creator KPI Dashboard in Google Sheets
🔑 Key Features of Content Creator KPI Dashboard in Google Sheets
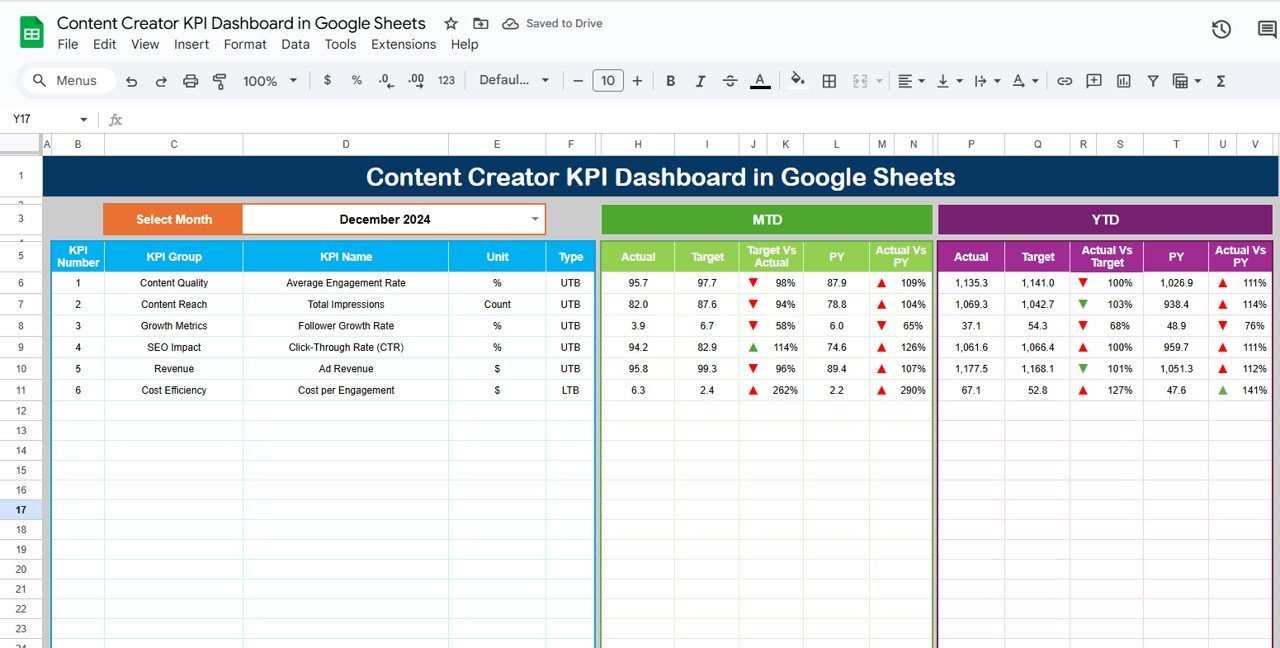
📊 Dashboard Tab (Overview)
-
Choose any month via a drop-down selector.
-
Instantly view MTD (Month-to-Date) and YTD (Year-to-Date) metrics.
-
Compare Actual vs Target and Previous Year vs Actual.
-
Conditional formatting (up/down arrows, color coding) highlights progress.
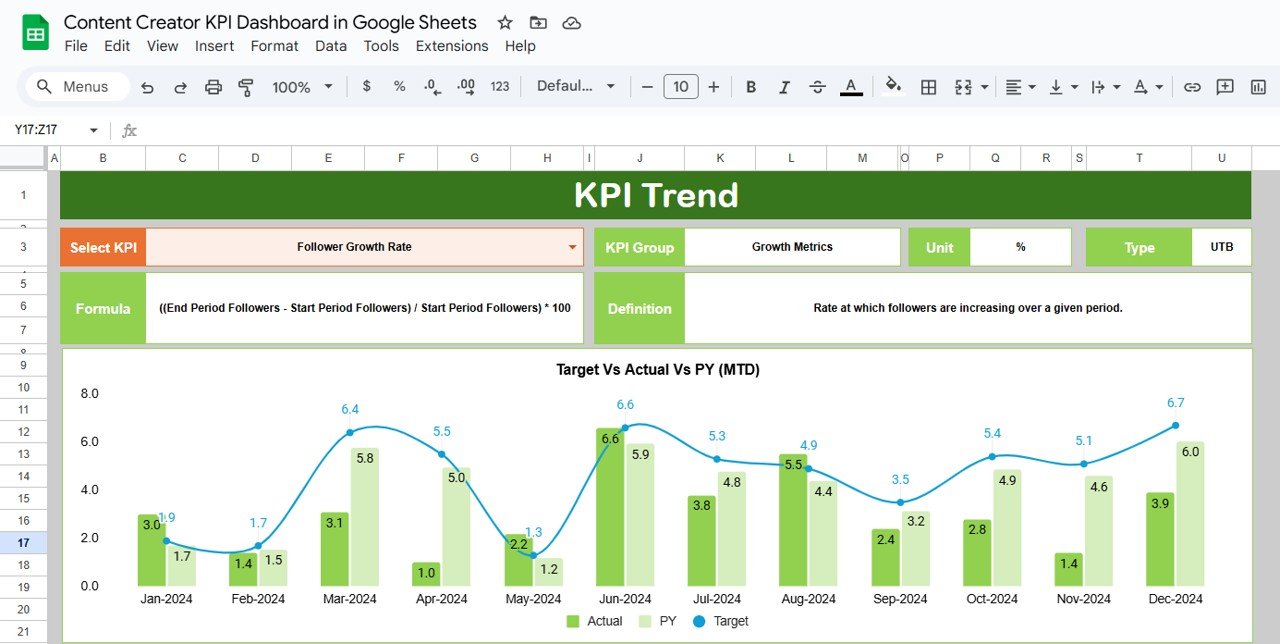
📈 KPI Trend Tab (Deeper Insights)
-
Select a KPI from a drop-down to analyze trends.
-
Includes KPI Group, Unit, Formula, and Definition.
-
Tracks Upper-the-Better (UTB) and Lower-the-Better (LTB) KPIs.
-
Great for identifying long-term performance patterns.
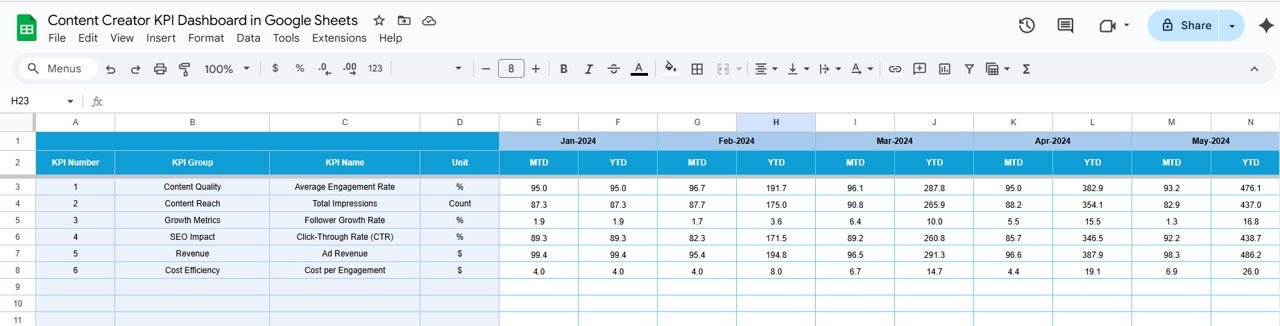
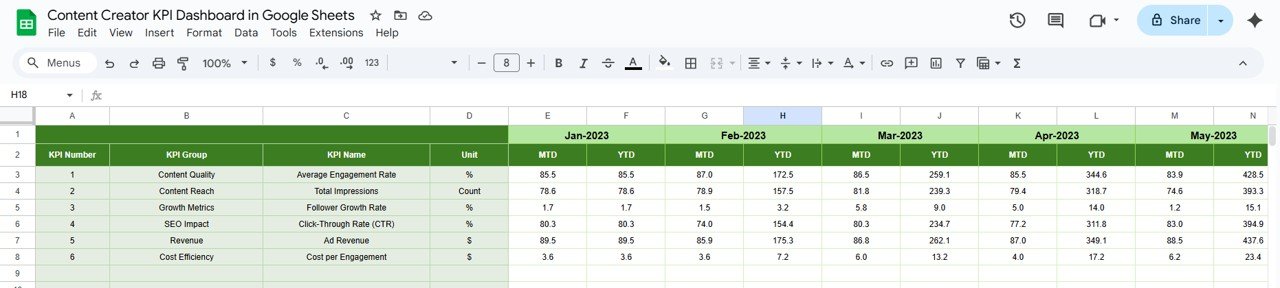
🧾 Actual Numbers Tab
-
Enter MTD and YTD actual values for each KPI.
-
Feeds directly into the Dashboard and Trend tabs.
-
Month selector makes period-based reporting seamless.
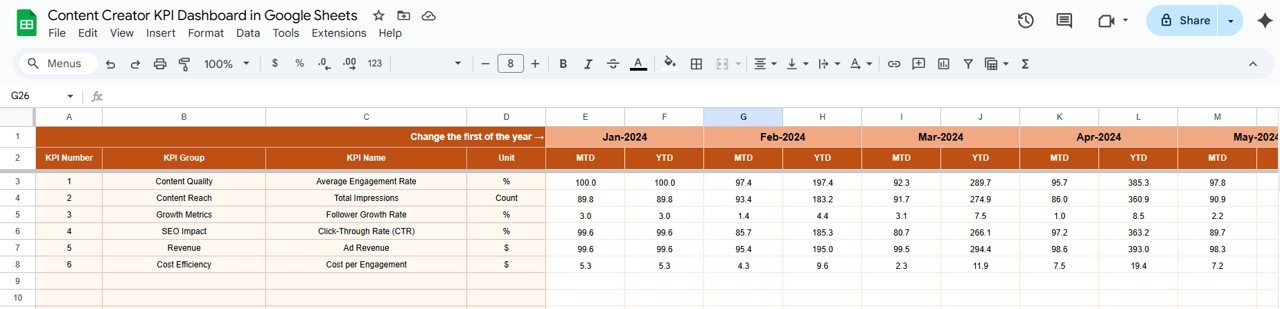
🎯 Target Numbers Tab
-
Define monthly and YTD targets.
-
Compare against actuals to measure performance gaps.
📉 Previous Year Tab
-
Store past-year values to benchmark growth or declines.
-
PY vs Actual comparisons add context to performance.
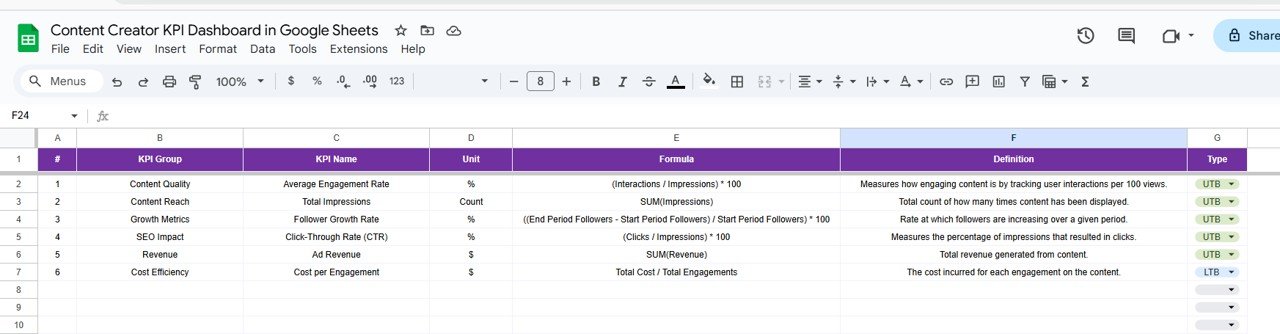
📚 KPI Definition Tab
-
Master reference sheet with KPI name, group, unit, formula, and definition.
-
Ensures consistency and shared understanding across teams.
📦 What’s Inside the Dashboard?
When you download, you’ll receive:
✅ 6 Pre-Built Tabs (Dashboard, KPI Trend, Actual, Target, Previous Year, KPI Definition)
✅ Pre-defined KPIs for content creators (output, engagement, reach, errors, conversions)
✅ Built-in formulas & conditional formatting
✅ Sample data for instant testing
✅ Cloud-based access – real-time collaboration on Google Sheets
✅ Customizable structure to add your own KPIs and charts
📊 Example KPIs You Can Track
-
📌 Content Published – Posts, blogs, or videos created (UTB)
-
👍 Engagement Rate – Likes, shares, comments per content piece (UTB)
-
👀 Reach / Impressions – Total audience reached (UTB)
-
❌ Content Error Rate – % of content with errors (LTB)
-
⏱ Average Time to Publish – Time from idea to publication (LTB)
-
🎯 Conversion Rate – Leads or sales per content (UTB)
👥 Who Can Benefit from This Dashboard?
📢 Marketing Managers – Measure ROI of content creation.
📱 Social Media Teams – Track engagement and reach across platforms.
📝 Content Creators – Monitor personal output and quality.
📊 Content Strategists – Identify trends to improve planning.
💼 Agencies – Share transparent reports with clients.
🧾 How to Use the Content Creator KPI Dashboard
-
📥 Download and copy the file to your Google Drive.
-
📝 Enter actuals in the Actual Numbers Tab.
-
🎯 Fill monthly and YTD benchmarks in the Target Tab.
-
📊 Review progress in the Dashboard Tab for quick insights.
-
📈 Use the KPI Trend Tab for deep analysis.
-
🔁 Compare with the Previous Year Tab for growth tracking.
-
⚡ Customize KPIs or visuals to align with your strategy.
With its plug-and-play setup, you’ll be ready to track and report in minutes. 🚀
🔗 Click here to read the Detailed blog post
Watch the step-by-step video Demo:


Reviews
There are no reviews yet.