Construction sites are high-risk zones. Workers operate heavy machinery. Teams work at heights. Materials move constantly. One small mistake can cause serious injury, project delays, or financial penalties.
Yet many construction companies still rely on scattered Excel sheets and manual reports to track safety. Construction Safety KPI Scorecard in Excel This leads to missed warning signs, poor target comparison, and delayed corrective actions.
If you truly want to protect your workforce and maintain compliance, you need a structured system.
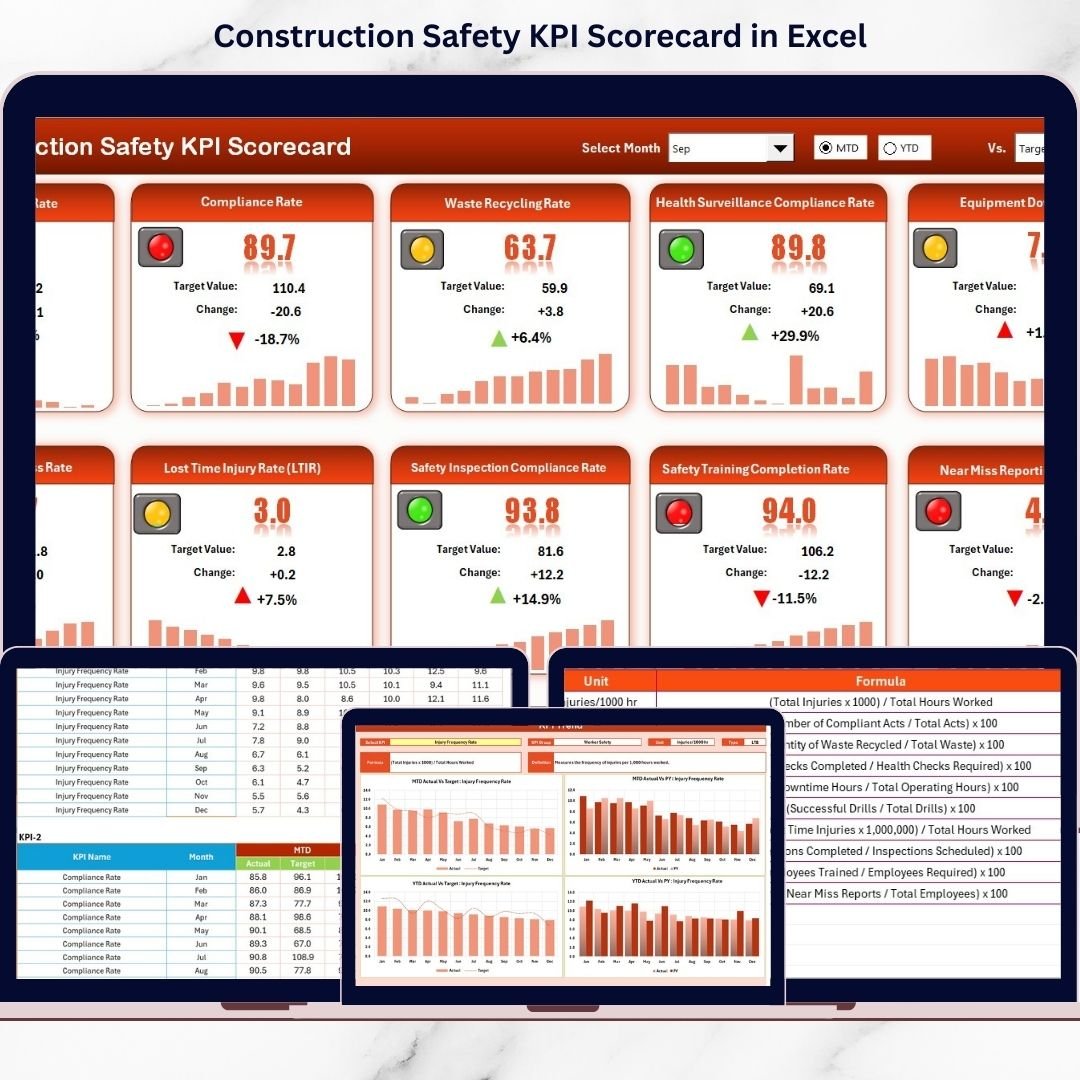
Introducing the Construction Safety KPI Scorecard in Excel — a ready-to-use, powerful safety performance tracking tool designed specifically for construction projects.
Construction Safety KPI Scorecard in Excel This Excel-based scorecard allows you to monitor accident rates, lost time injuries, safety compliance, training hours, near-miss reports, and more — all in one interactive dashboard.
Stop reacting to accidents. Start preventing them. 🦺📊
🏗️ Key Feature of Construction Safety KPI Scorecard in Excel
This template is built to give construction managers instant visibility into site safety performance.
✅ Centralized Safety Dashboard
View all safety KPIs in one organized scorecard.
📅 Month Selection Dropdown
Switch between months and instantly refresh results.
📊 MTD & YTD Tracking
Analyze Month-to-Date and Year-to-Date performance easily.
🎯 Actual vs Target vs Previous Year Comparison
Identify gaps and measure safety improvements quickly.
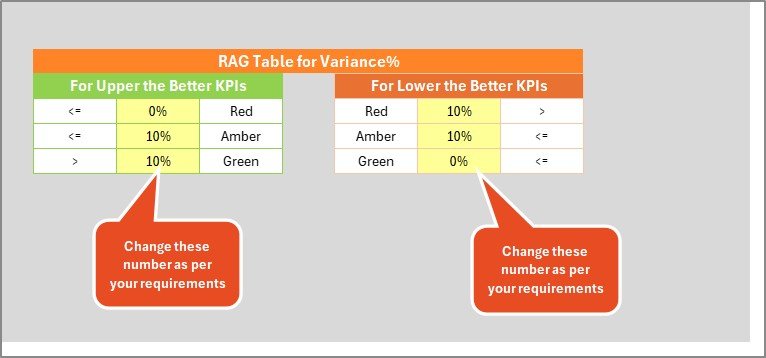
🚦 Visual Safety Indicators
Color signals, conditional formatting, and arrows show performance direction immediately.
📈 KPI Trend Analysis Sheet
Select any KPI and view detailed monthly trend charts.
📝 Structured Data Entry System
Enter actual and target values in a clean Input Data Sheet.
📘 KPI Definition Standardization
Maintain clear formulas and definitions for consistency across sites.
This is not just a spreadsheet — it is your safety control center.
📦 What’s Inside the Construction Safety KPI Scorecard in Excel
This ready-to-use Excel file includes 4 powerful worksheets:
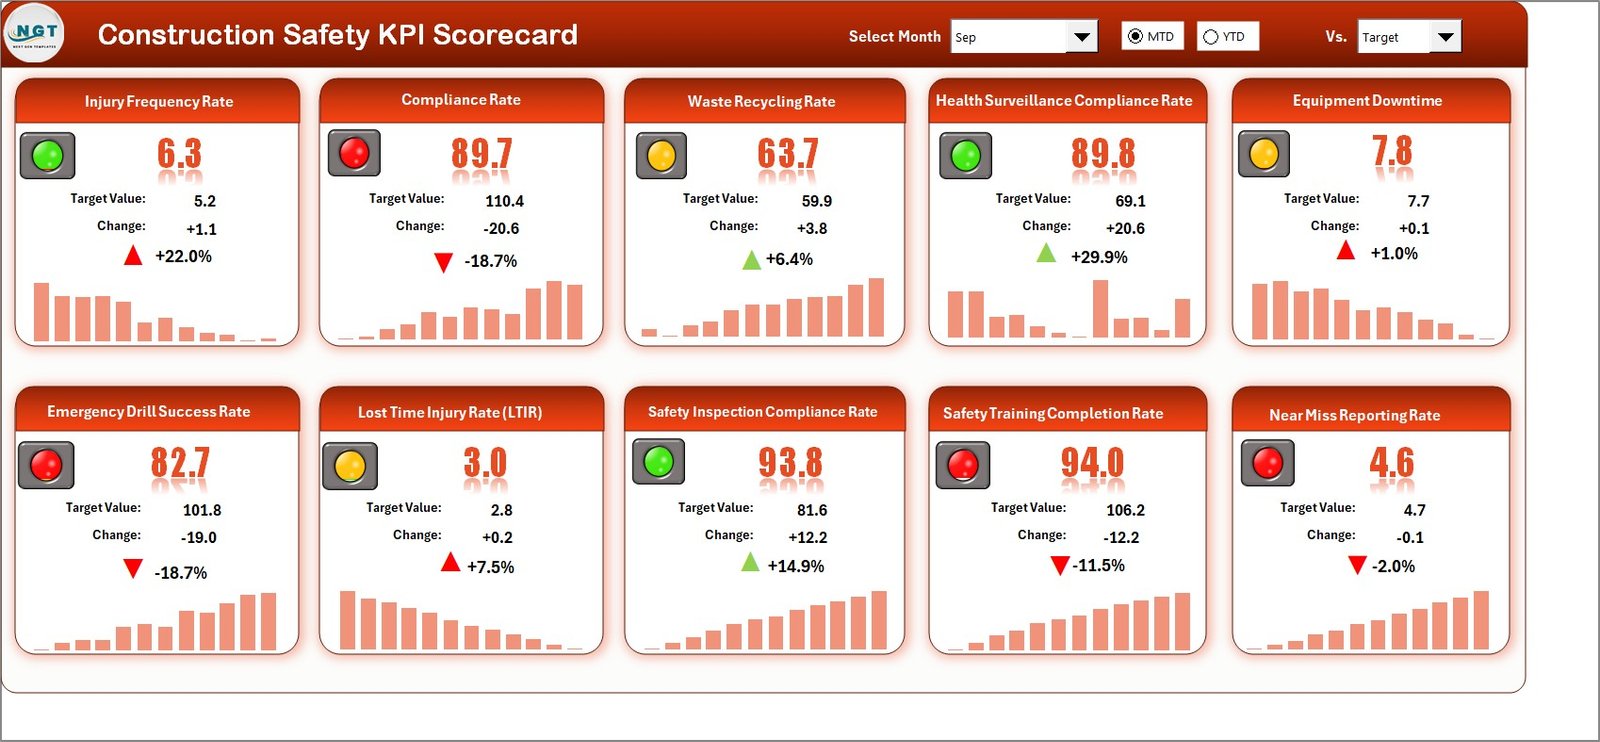
🦺 1. Scorecard Sheet
The main dashboard displaying all safety KPIs in one place. Select Month, MTD, or YTD and the dashboard updates automatically.
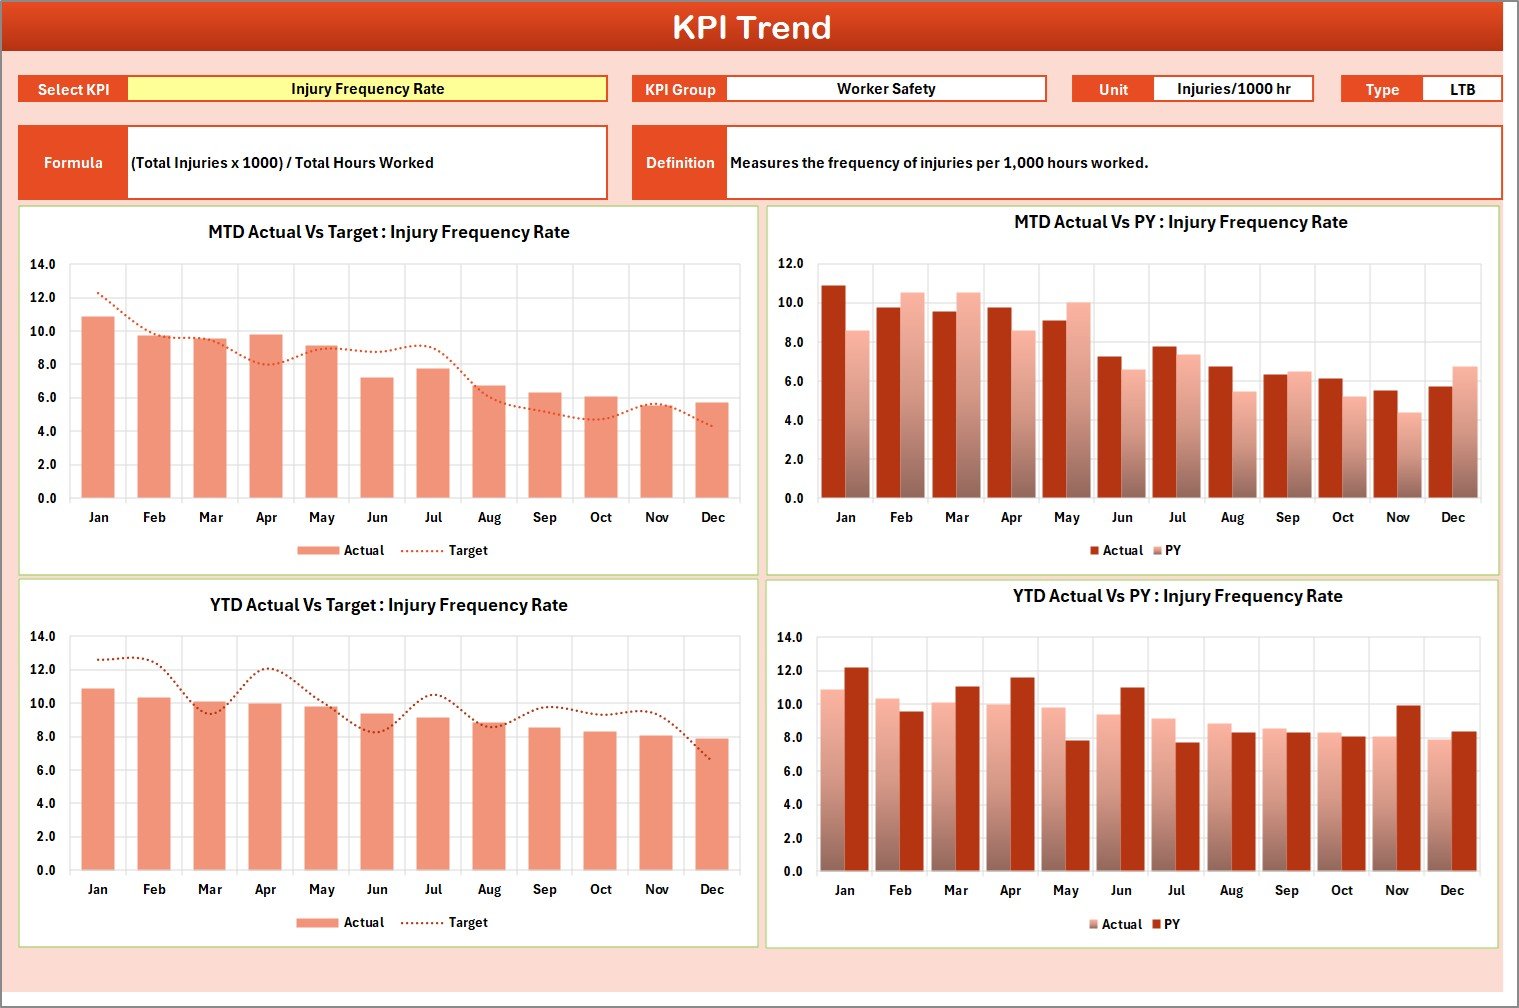
📊 2. KPI Trend Sheet
Choose any KPI from the dropdown (Cell C3) and analyze detailed MTD and YTD trends. View KPI group, unit, formula, and definition instantly.
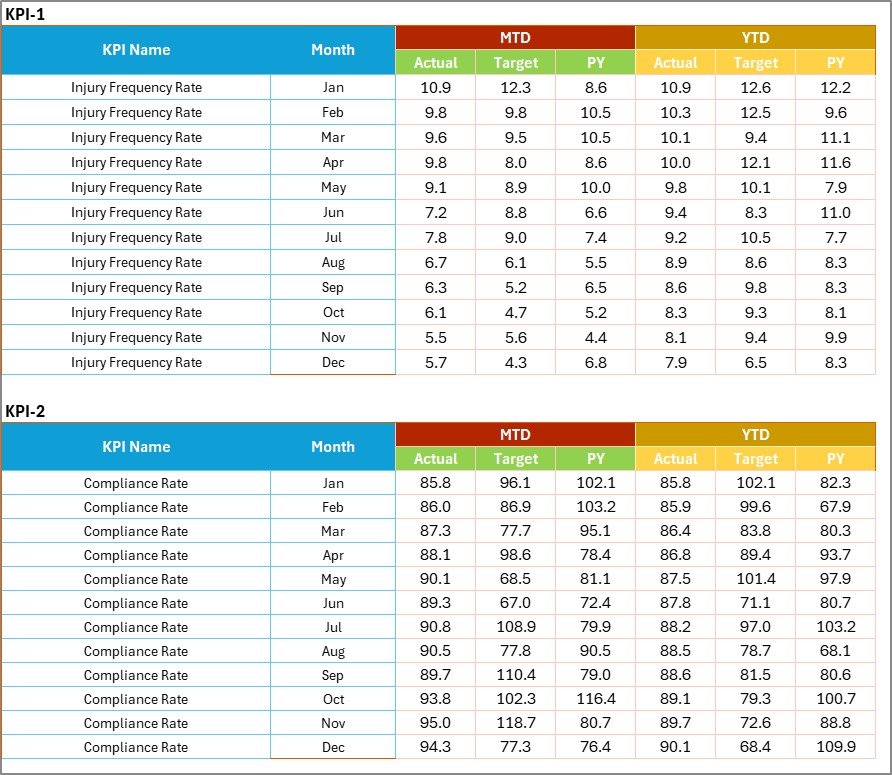
📝 3. Input Data Sheet
Enter monthly safety data, targets, and compliance results. Once updated, the dashboard refreshes automatically.
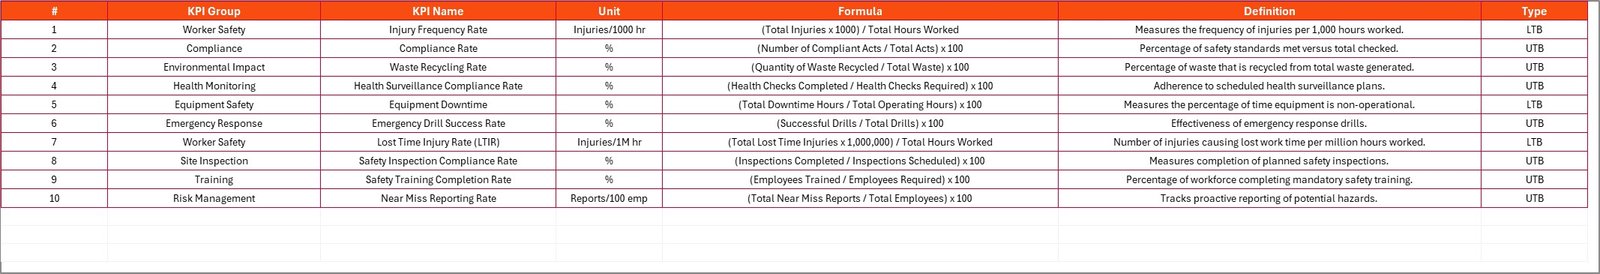
📘 4. KPI Definition Sheet
Define KPI name, group, unit, formula, and explanation to ensure clarity and consistency.
Everything is structured. Everything is automated. Everything is practical.
⚙️ How to Use the Construction Safety KPI Scorecard in Excel
Using this template is simple and straightforward:
1️⃣ Enter monthly safety data in the Input Data Sheet.
2️⃣ Select the desired month from the Scorecard dropdown.
3️⃣ Review MTD and YTD performance comparisons.
4️⃣ Analyze detailed trends from the KPI Trend Sheet.
5️⃣ Take corrective action where needed.
No advanced Excel knowledge required. Basic Excel skills are enough.
Within minutes, you can track:
-
Total Recordable Incident Rate (TRIR)
-
Lost Time Injury Frequency Rate (LTIFR)
-
Near Miss Reports
-
Safety Audit Scores
-
PPE Compliance Rate
-
Safety Training Hours
-
Corrective Action Closure Rate
Make safety measurable. Make performance accountable.
👷 Who Can Benefit from This Construction Safety KPI Scorecard in Excel
This template is ideal for:
🏗️ Construction Companies
🏢 Infrastructure & Civil Contractors
🛠️ Industrial Project Managers
🚧 Site Supervisors
📋 Safety Officers
🏭 Engineering Firms
📊 Compliance & Risk Management Teams
Whether you manage a small site or multiple large projects, this scorecard adapts to your needs.
Construction safety cannot rely on guesswork. It requires structured monitoring and proactive action.
When you use this KPI scorecard regularly, you:
✔ Detect risk trends early
✔ Reduce accident frequency
✔ Strengthen regulatory compliance
✔ Improve worker awareness
✔ Protect company reputation
✔ Minimize financial losses
Instead of reacting to incidents, you build a culture of prevention.
This Construction Safety KPI Scorecard in Excel transforms raw safety data into clear, actionable insights. It helps you build safer sites, stronger teams, and more successful projects.
If safety is your priority — this scorecard is your solution.
Click hare to read the Detailed blog post
Visit our YouTube channel to learn step-by-step video tutorials
👉 https://www.youtube.com/@PKAnExcelExpert