
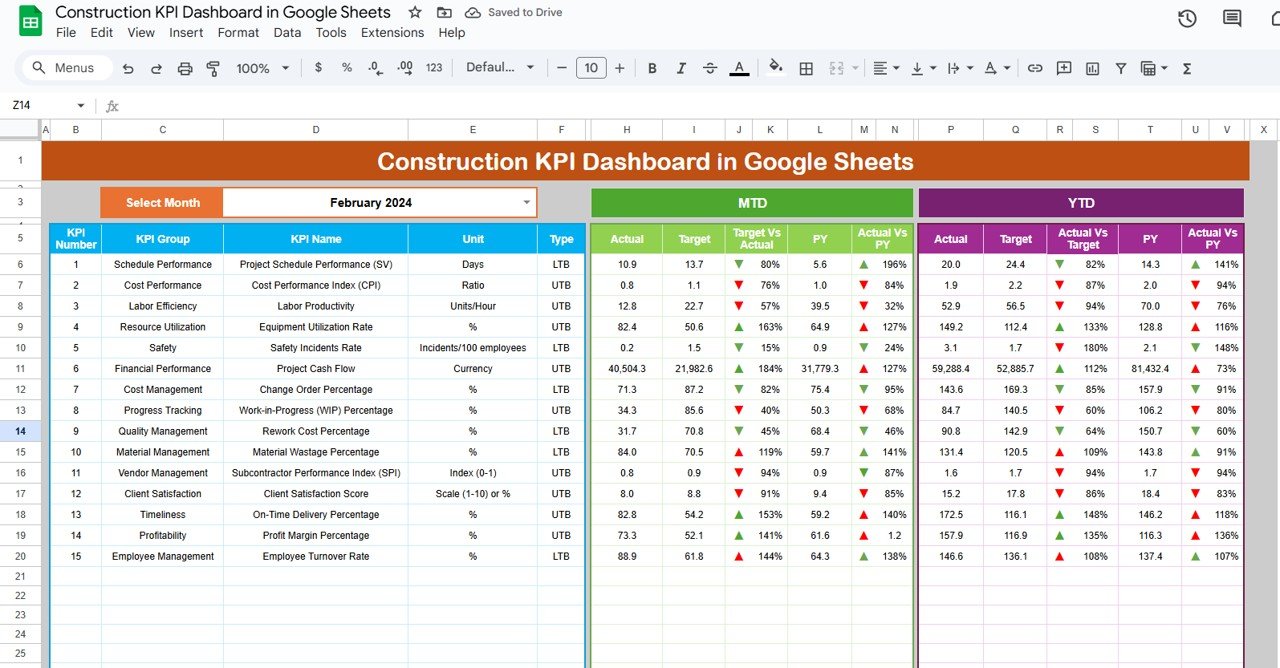
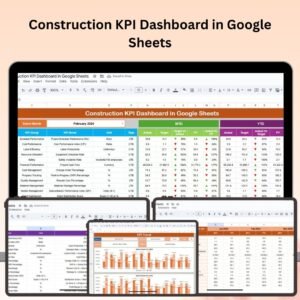
The Construction KPI Dashboard in Google Sheets is a powerful tool designed for construction managers, project coordinators, and business owners who want to track, analyze, and optimize key performance indicators (KPIs) in their construction projects. This easy-to-use dashboard provides real-time insights into essential metrics like project progress, budget management, resource allocation, safety performance, and more.
Whether you’re managing a single project or overseeing multiple construction sites, this Google Sheets dashboard allows you to streamline your project management efforts, improve decision-making, and ensure that projects are completed on time and within budget.

Key Features of the Construction KPI Dashboard in Google Sheets:
🏗 Project Progress Tracking
Track the completion status of tasks, milestones, and phases to monitor overall project progress. Stay on top of deadlines and identify any delays early.
💰 Budget and Cost Management
Monitor your project budget, track expenses, and compare actual costs with planned costs to ensure that your projects stay within financial limits.
🔨 Resource Allocation and Utilization
Analyze labor, equipment, and material usage to optimize resource allocation. Ensure that all resources are used efficiently to maximize productivity.
⚠️ Safety and Compliance Metrics
Track safety incidents, compliance checks, and worker safety KPIs to ensure that all construction sites meet legal requirements and maintain a safe working environment.
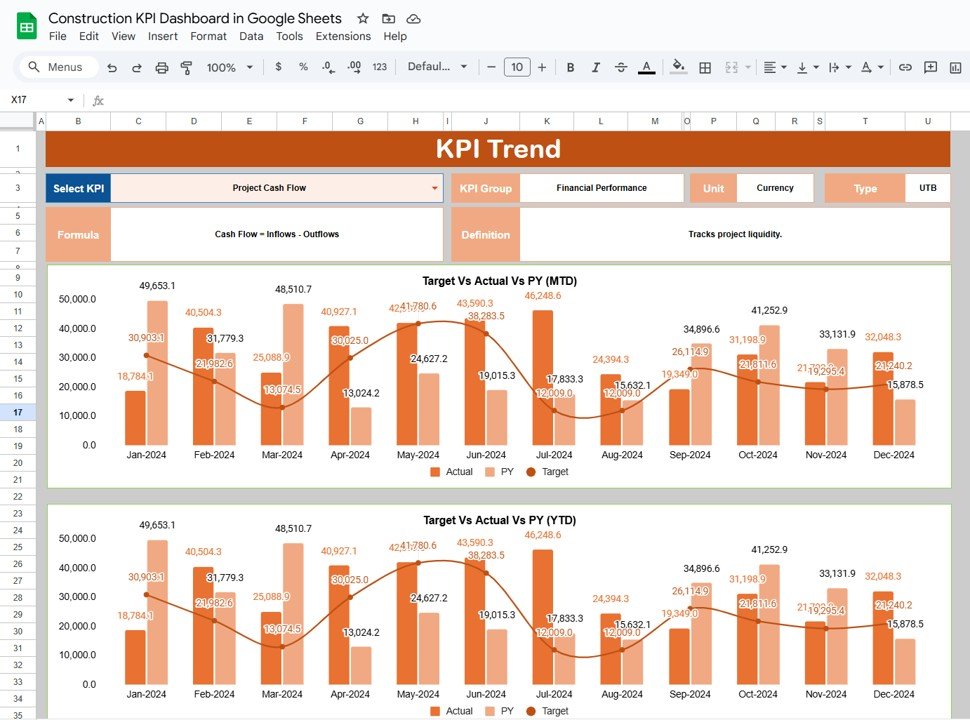
📅 Customizable Reporting
Create tailored reports to present your project performance metrics to stakeholders, contractors, and clients, making communication simple and efficient.
🚀 Why You’ll Love the Construction KPI Dashboard in Google Sheets:
✅ Comprehensive Project Tracking – Track multiple construction projects simultaneously, including project phases, task completion, and overall progress.
✅ Real-Time Budget Monitoring – Track and compare actual expenses against the budget in real time to avoid overspending and ensure profitability.
✅ Optimize Resource Usage – Improve resource management by tracking material, labor, and equipment usage, ensuring efficient allocation and minimizing waste.
✅ Ensure Safety Compliance – Track safety incidents and monitor safety KPIs to maintain a safe working environment and comply with legal regulations.
✅ Customizable and User-Friendly – This Google Sheets dashboard is easy to customize, so you can adjust it to suit your specific project needs. It’s also simple to navigate, even for beginners.
✅ Make Informed Decisions – Use real-time data to make informed decisions and keep your projects on track, within budget, and in line with safety regulations.
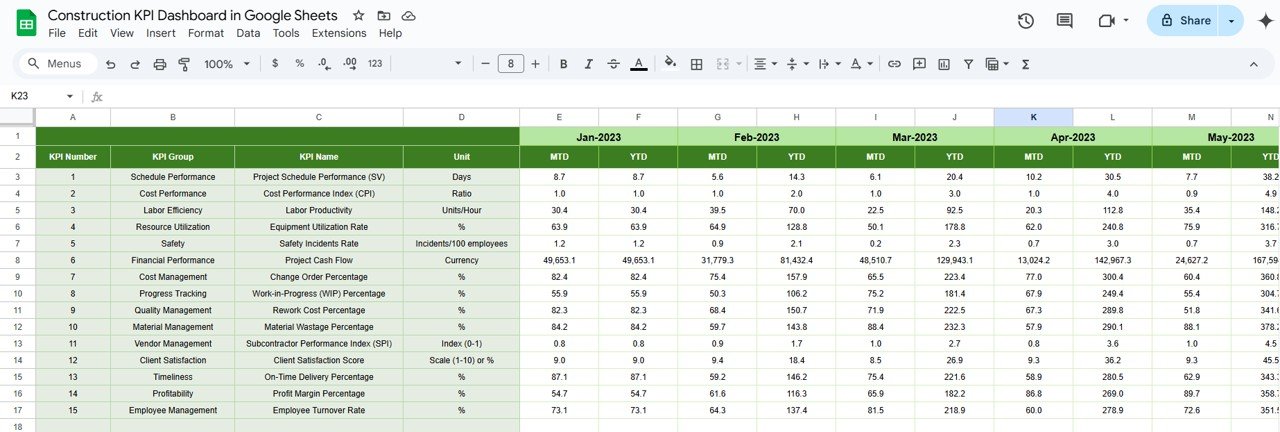
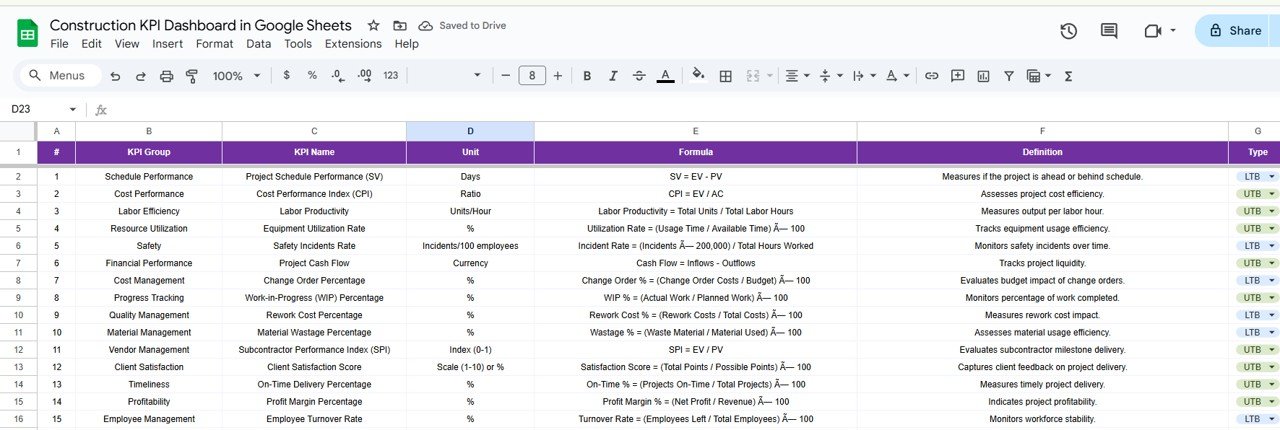
What’s Inside the Construction KPI Dashboard in Google Sheets:
- Project Milestones Tracker: Track the completion of key project milestones and deadlines to monitor overall progress.
- Budget and Cost Tracking: Monitor budget allocations, compare planned vs. actual expenses, and stay on top of costs throughout the project.
- Resource Allocation: Analyze labor, material, and equipment usage to ensure optimal resource distribution.
- Safety Performance: Track safety incidents, OSHA compliance, and other key safety metrics to maintain a safe work environment.
- Custom Reports and Dashboards: Create visual reports and dashboards to easily communicate project performance to stakeholders.
How to Use the Construction KPI Dashboard in Google Sheets:
1️⃣ Download the Template – Instantly access your Google Sheets template upon purchase.
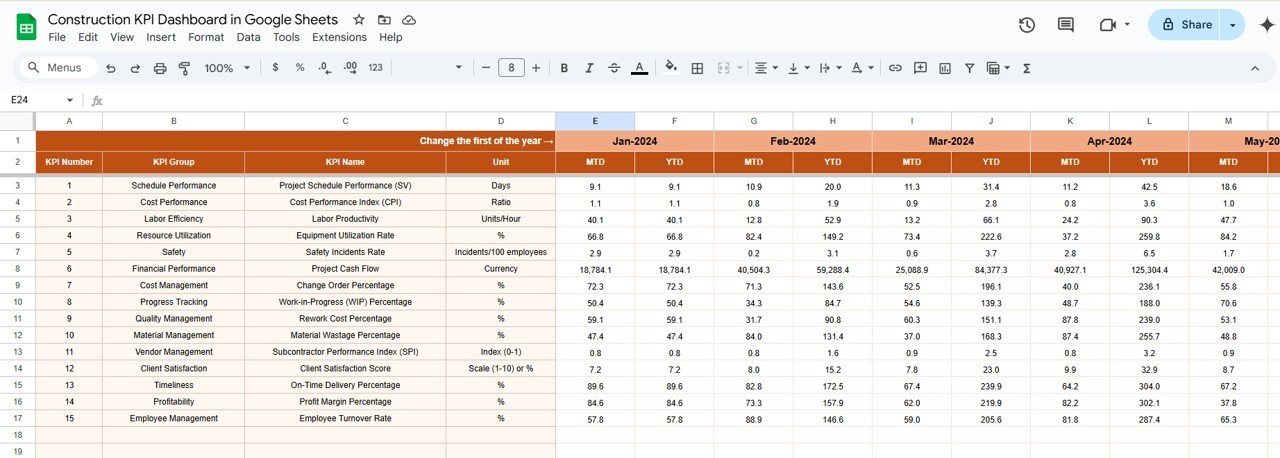
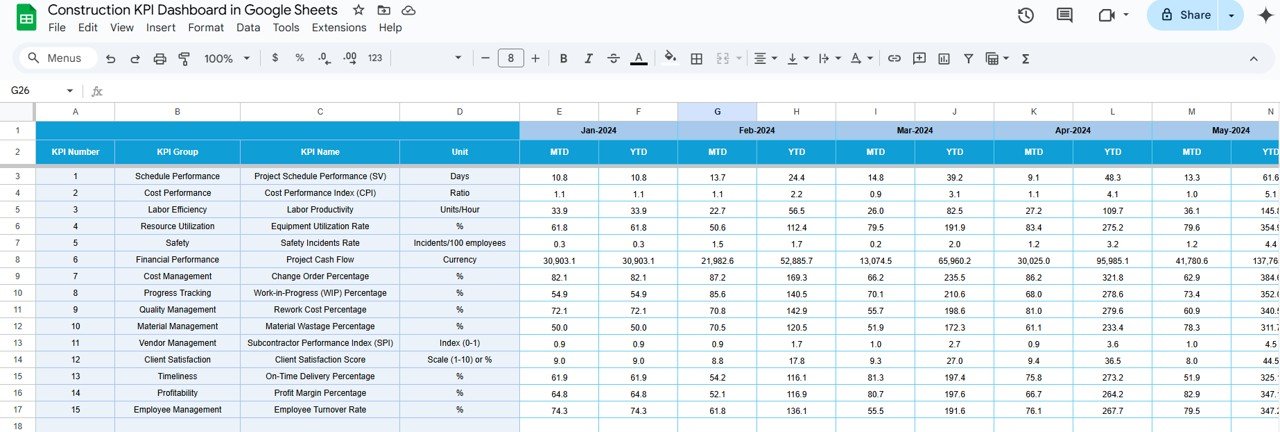
2️⃣ Input Project Data – Enter your project milestones, cost details, resource usage, and safety metrics into the dashboard.
3️⃣ Monitor Key Metrics – Track KPIs such as task completion, budget, resource allocation, and safety performance.
4️⃣ Analyze and Adjust – Use the real-time insights to make data-driven decisions, optimize resource usage, and adjust timelines or budgets as needed.
5️⃣ Generate Reports – Create customized reports and share them with stakeholders, clients, or project teams to showcase progress and performance.
Who Can Benefit from the Construction KPI Dashboard in Google Sheets:
- Construction Managers
- Project Coordinators
- General Contractors
- Site Supervisors
- Business Owners in the Construction Industry
- Project Owners and Stakeholders
- Budget Analysts
- Safety Officers
The Construction KPI Dashboard in Google Sheets is the ideal tool for anyone managing construction projects, from small renovations to large-scale developments. It helps streamline operations, ensure projects stay within budget, and maintain a high level of safety and efficiency.
Click here to read the Detailed blog post
https://neotechnavigators.com/construction-kpi-dashboard-in-google-sheets/
Visit our YouTube channel to learn step-by-step video tutorials
Youtube.com/@PKAnExcelExpert


Reviews
There are no reviews yet.