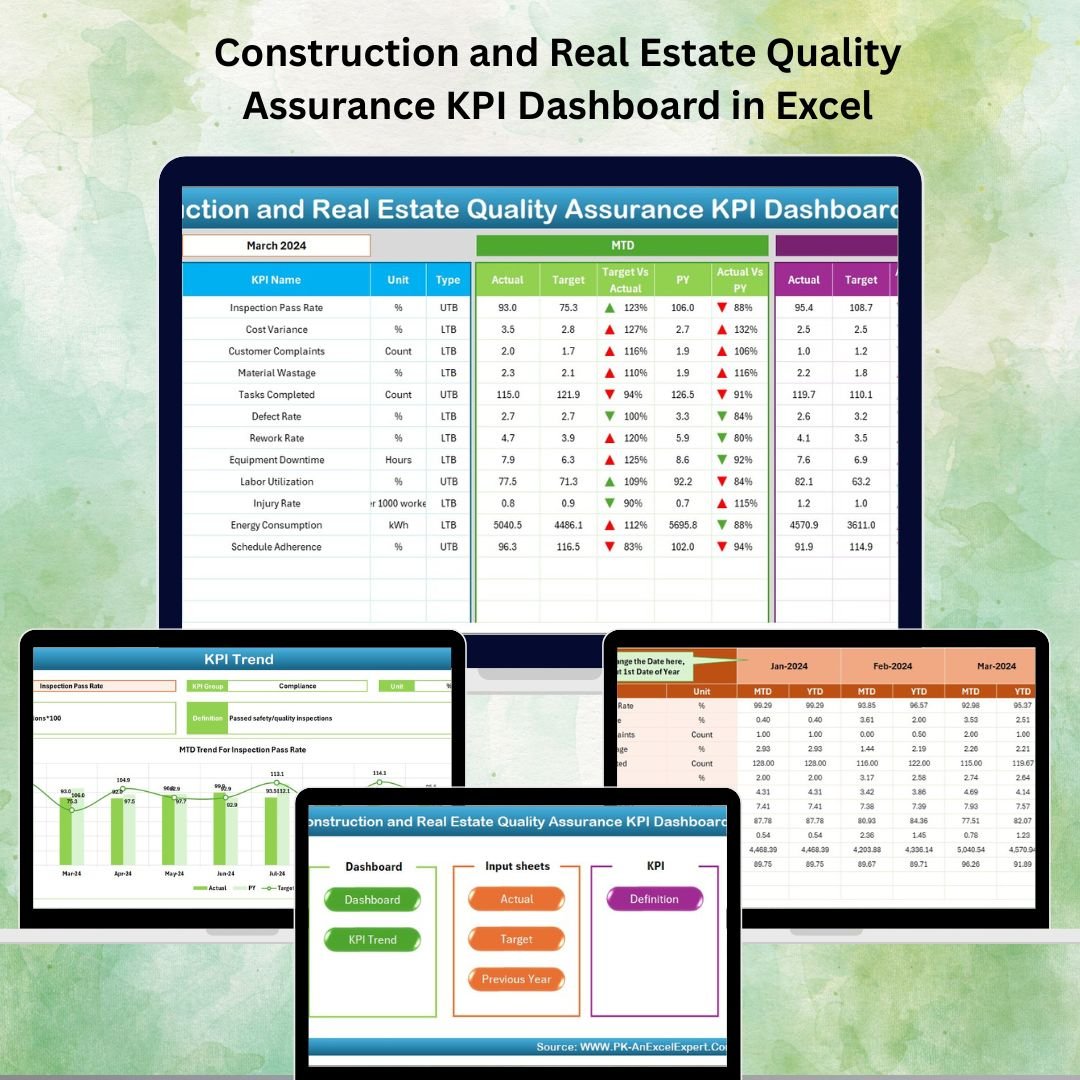
In the construction and real estate industry, quality is non-negotiable. Yet, many professionals still rely on scattered data, manual tracking, and outdated reports. It’s time to modernize your approach with our Construction and Real Estate Quality Assurance KPI Dashboard in Excel — a fully interactive, Excel-based tool that puts all your quality metrics at your fingertips.
Whether you’re a project manager, quality control officer, or real estate developer, this dashboard helps you ensure your projects stay compliant, efficient, and top-quality.
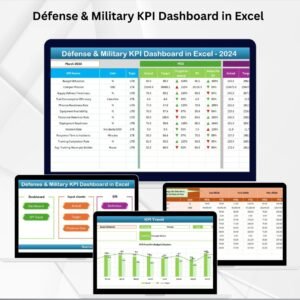
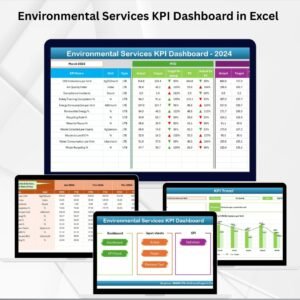
✨ Key Features of Construction and Real Estate Quality Assurance KPI Dashboard
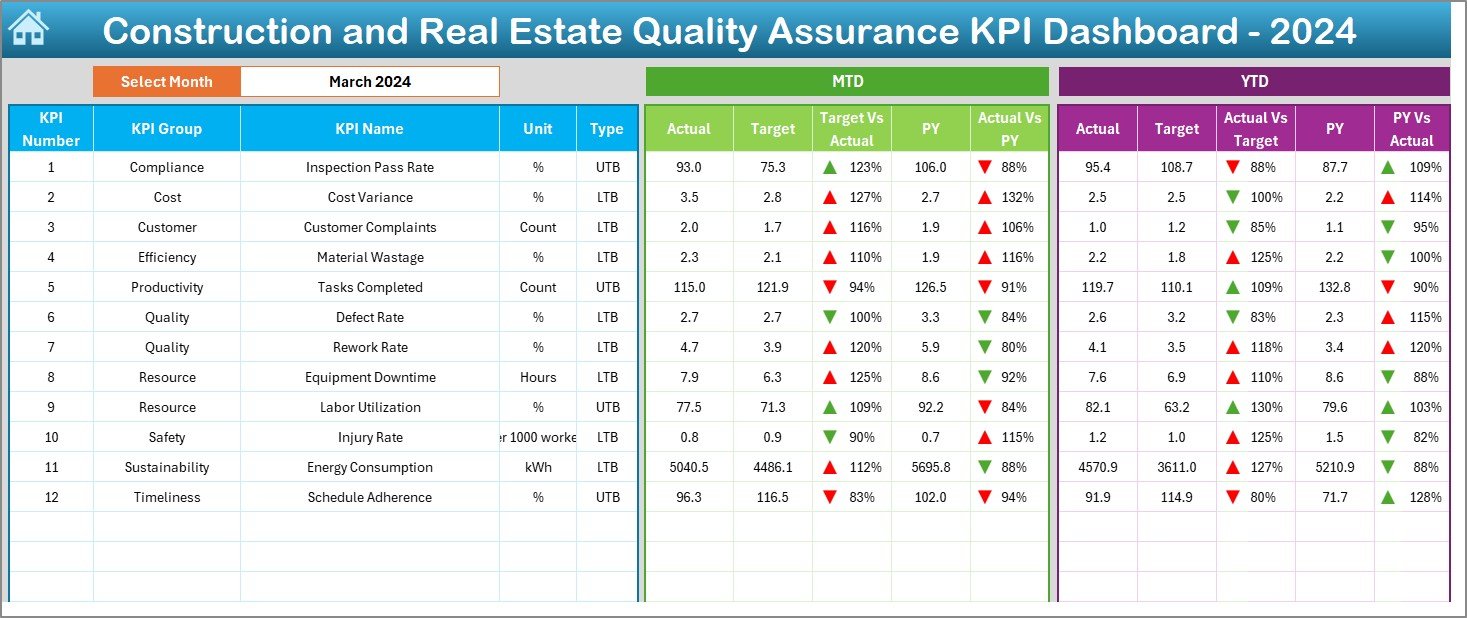
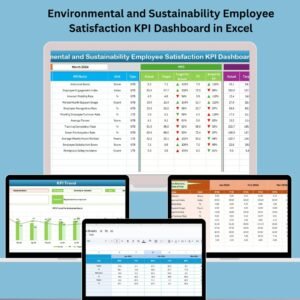
📊 Interactive Dashboard
-
View MTD and YTD metrics instantly.
-
Analyze Actual vs Target and Previous Year.
-
Auto-updates based on month selection.
-
Visual up/down arrows for performance tracking.
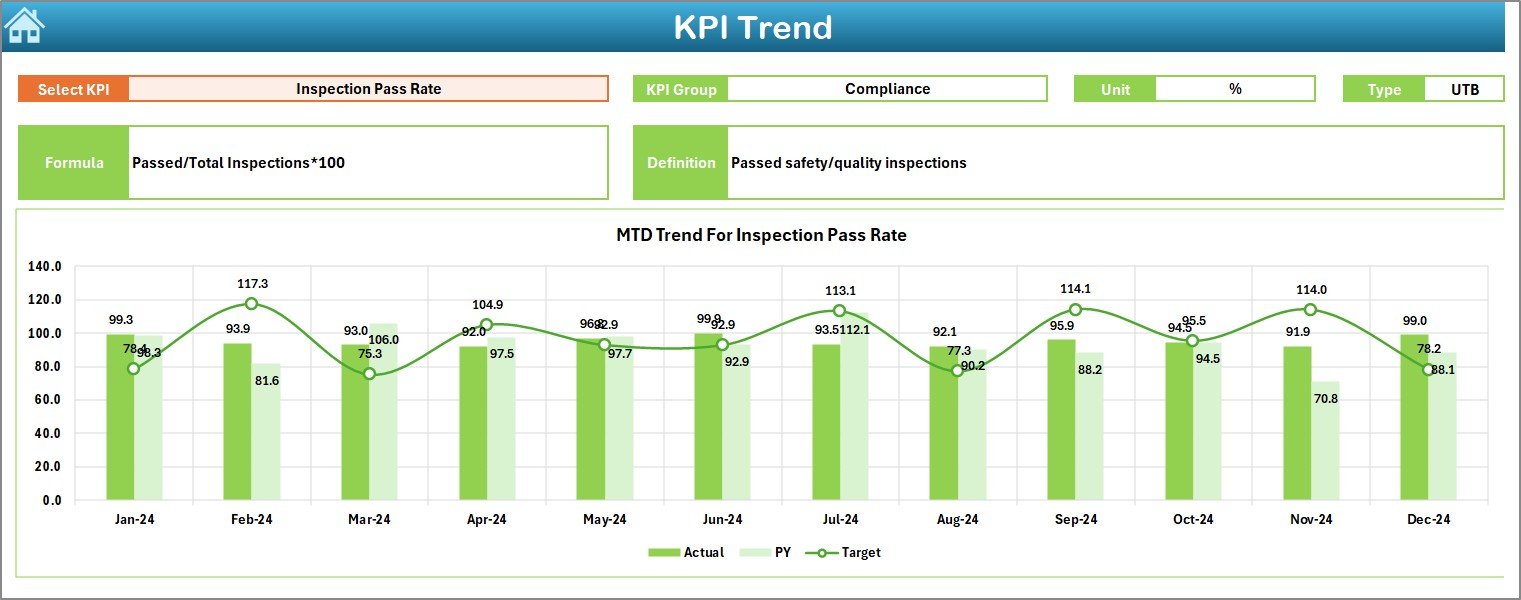
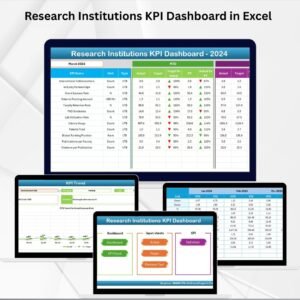
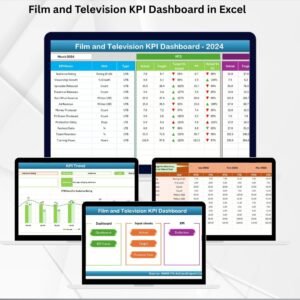
📈 KPI Trend Visualization
-
Select any KPI from a dropdown.
-
Track progress using dynamic line charts.
-
Easily compare Actual, Target, and Previous Year metrics.
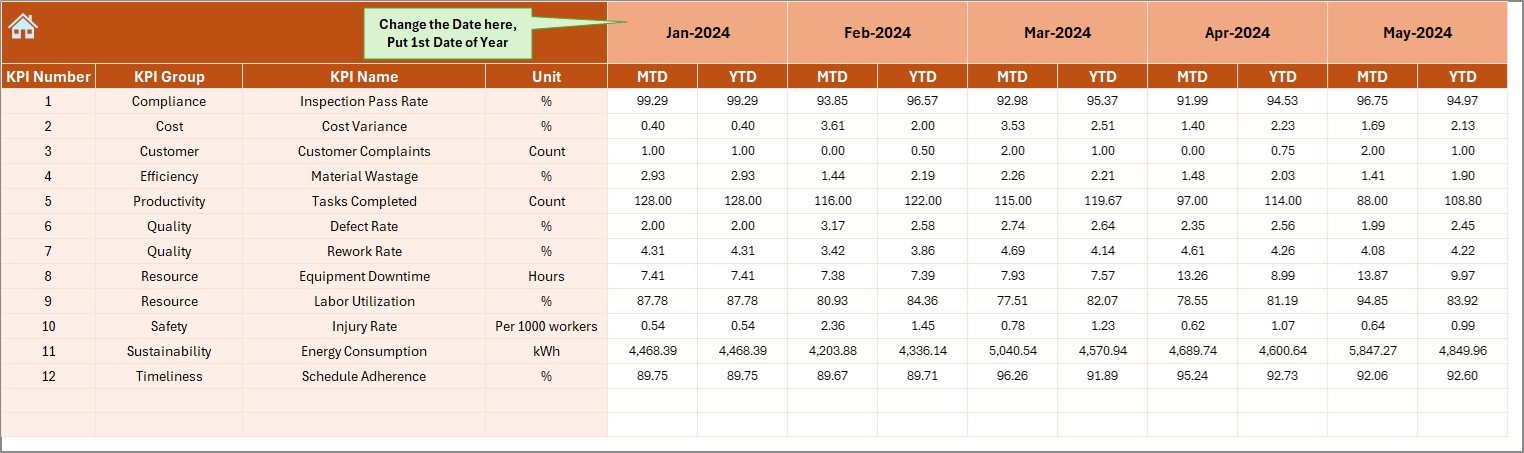
📥 Data Input & Control
-
Separate sheets for Actuals, Targets, and Previous Year data.
-
Clean structure for MTD and YTD tracking.
-
Flexible KPI management with full control.
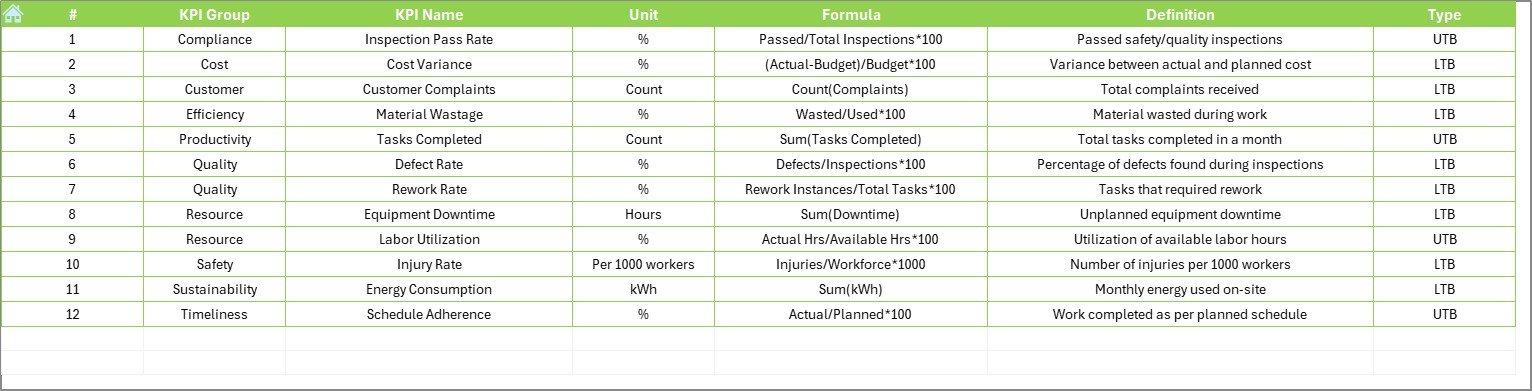
📘 KPI Reference Guide
-
Built-in KPI Definition sheet with formulas, units, and types.
-
Easy for your team to understand and maintain consistency.
📂 Excel-Powered Simplicity
-
No macros or VBA needed.
-
Works offline, shareable, and lightweight.
-
100% editable and customizable to your business needs.
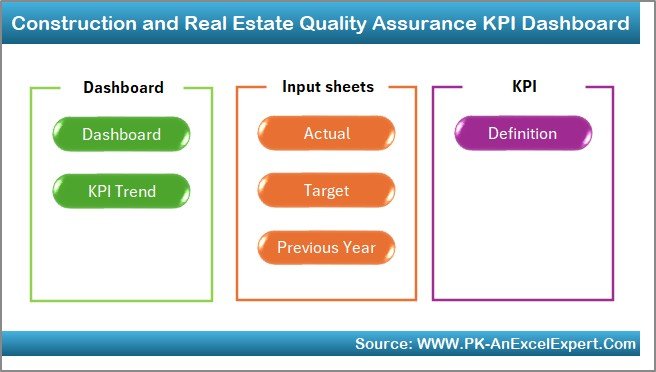
📦 What’s Inside the Construction Quality Dashboard?
Here’s what you get in this powerful Excel template:
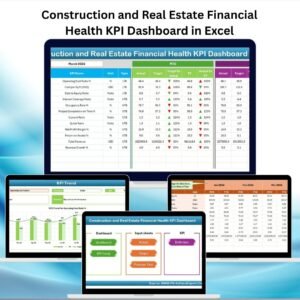
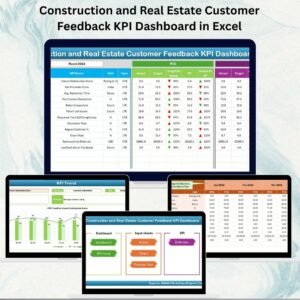
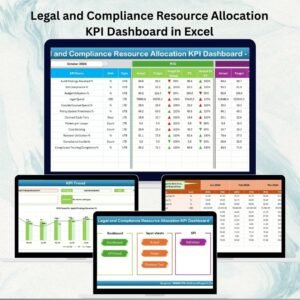
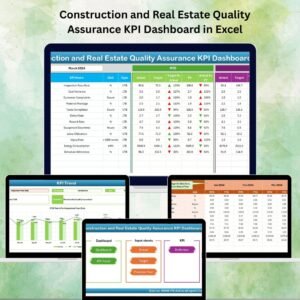
1️⃣ Home Sheet – Navigation panel with clickable buttons to all other sheets.
2️⃣ Dashboard Sheet – The visual heart of the template with auto-updating KPI cards and charts.
3️⃣ KPI Trend Sheet – Analyze performance for any KPI with dropdown filters and line graphs.
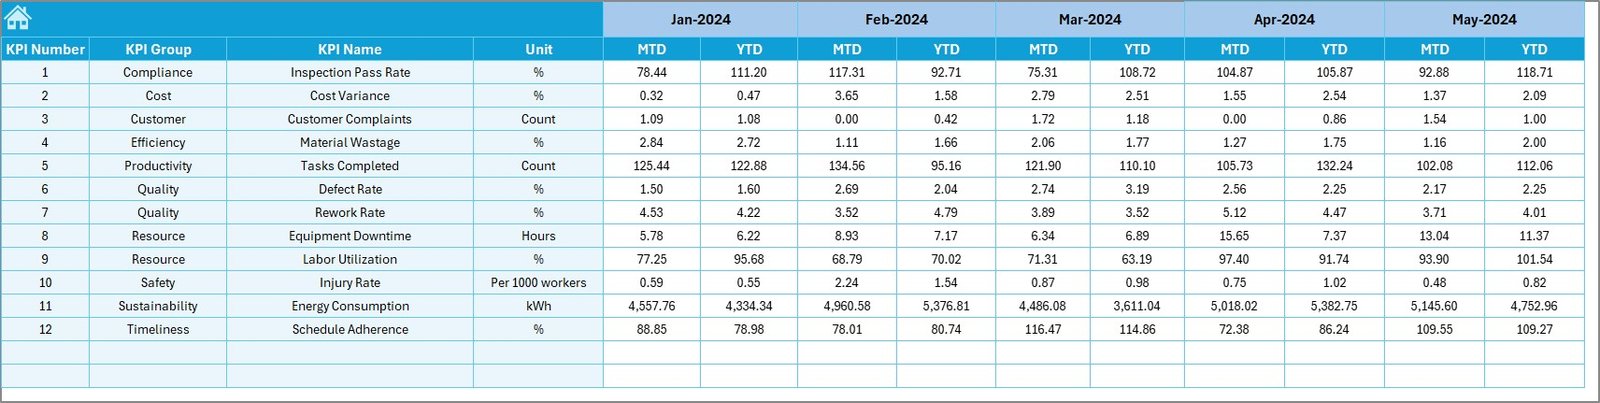
4️⃣ Actual Numbers Input Sheet – Record monthly performance for all KPIs.
5️⃣ Target Sheet – Set your expected benchmarks for MTD and YTD values.
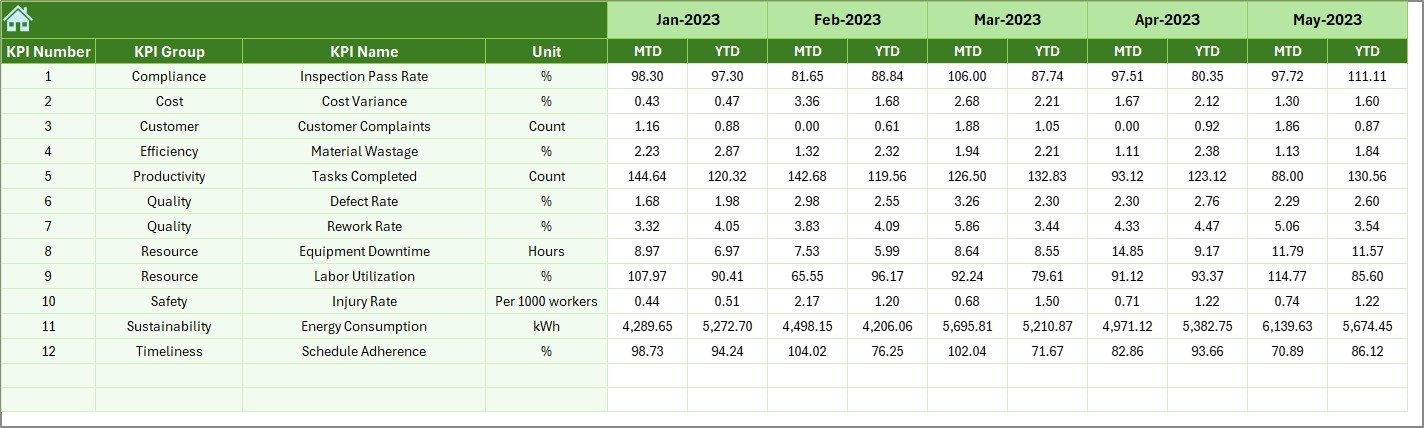
6️⃣ Previous Year Numbers Sheet – Input last year’s results for direct YoY comparisons.
7️⃣ KPI Definition Sheet – All your KPIs, formulas, and definitions in one place.
🛠️ How to Use the Quality Assurance Dashboard
📅 Set Your Fiscal Start Month
Start from any month using a dropdown in the Actual Numbers sheet.
🎯 Define Targets Clearly
Input your monthly expectations in the Target sheet.
📊 Track Actuals Every Month
Update the Actual Numbers Input sheet with real-time results.
📈 Visualize Your Progress
Review trends and performance in the Dashboard and KPI Trend tabs.
🔍 Compare With Last Year
Add Previous Year data to measure growth or decline.
📘 Refer to KPI Definitions
Keep everyone aligned using the KPI Definition tab.
👷 Who Can Benefit from This Dashboard?
This Excel-based KPI dashboard is a must-have for anyone in the construction or real estate field:
-
🧱 Construction Project Managers
-
🏢 Real Estate Developers
-
🔍 Quality Assurance Teams
-
🧑🔧 Site Engineers
-
🔐 Compliance & Safety Officers
-
🧾 Internal Auditors
-
🛠️ Facility Managers
Whether you manage one site or multiple projects, this tool helps you ensure consistency, spot issues early, and improve overall quality.
🔗 Click here to read the Detailed blog post
📺 Visit our YouTube channel to learn step-by-step video tutorials


Reviews
There are no reviews yet.