Managing multiple construction projects or real estate assets can be chaotic without the right tools. If you’re tired of scattered spreadsheets, confusing reports, and missed targets—this dashboard is your game-changer!
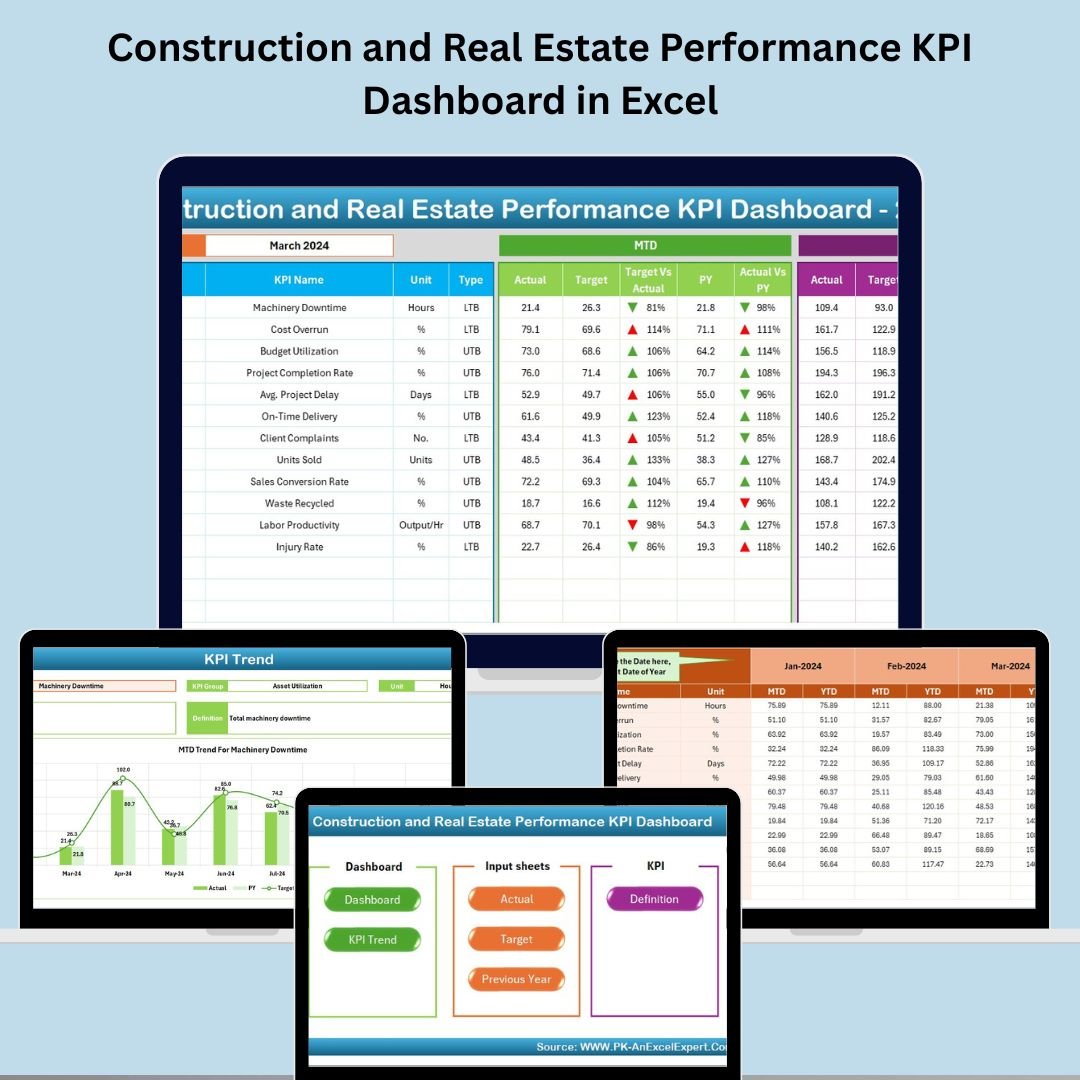
Introducing the Construction and Real Estate Performance KPI Dashboard in Excel —a powerful, ready-to-use Excel tool designed to help managers, developers, engineers, and consultants monitor KPIs, track trends, and make smarter, data-driven decisions—all from one central place.
Let’s explore why this dashboard is a must-have for your operations 👇
🛠️ Key Features of Construction and Real Estate KPI Dashboard in Excel
✅ All-in-One Centralized Dashboard

Switching between tabs is over! The Home sheet acts as your navigation control panel, giving you quick access to Dashboard, KPI Trend, Input Sheets, and more.
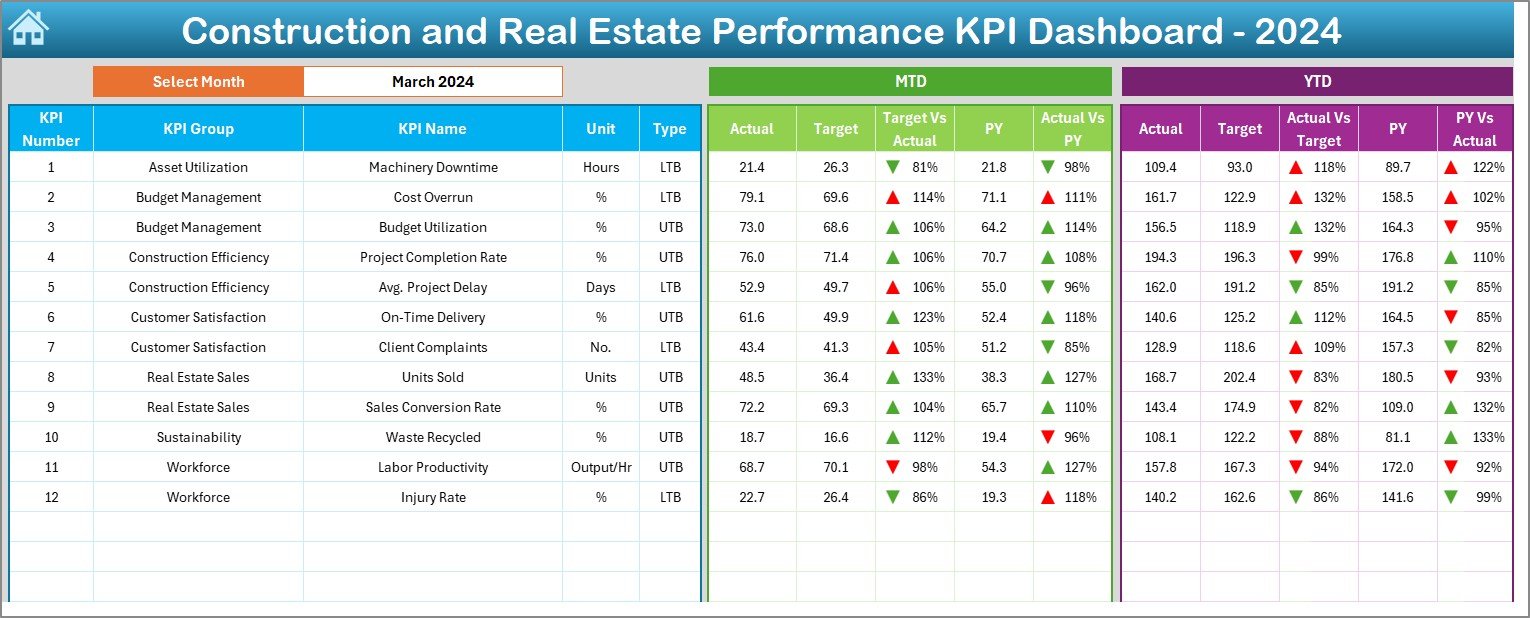
📊 Dynamic Dashboard with MTD/YTD Analysis
Choose any month and instantly see how your projects are performing with Month-To-Date (MTD) and Year-To-Date (YTD) Actual, Target, and Previous Year numbers.
🔻 Visual Performance Indicators
Spot progress or problems in seconds using up/down arrows, conditional formatting, and color-coded highlights.
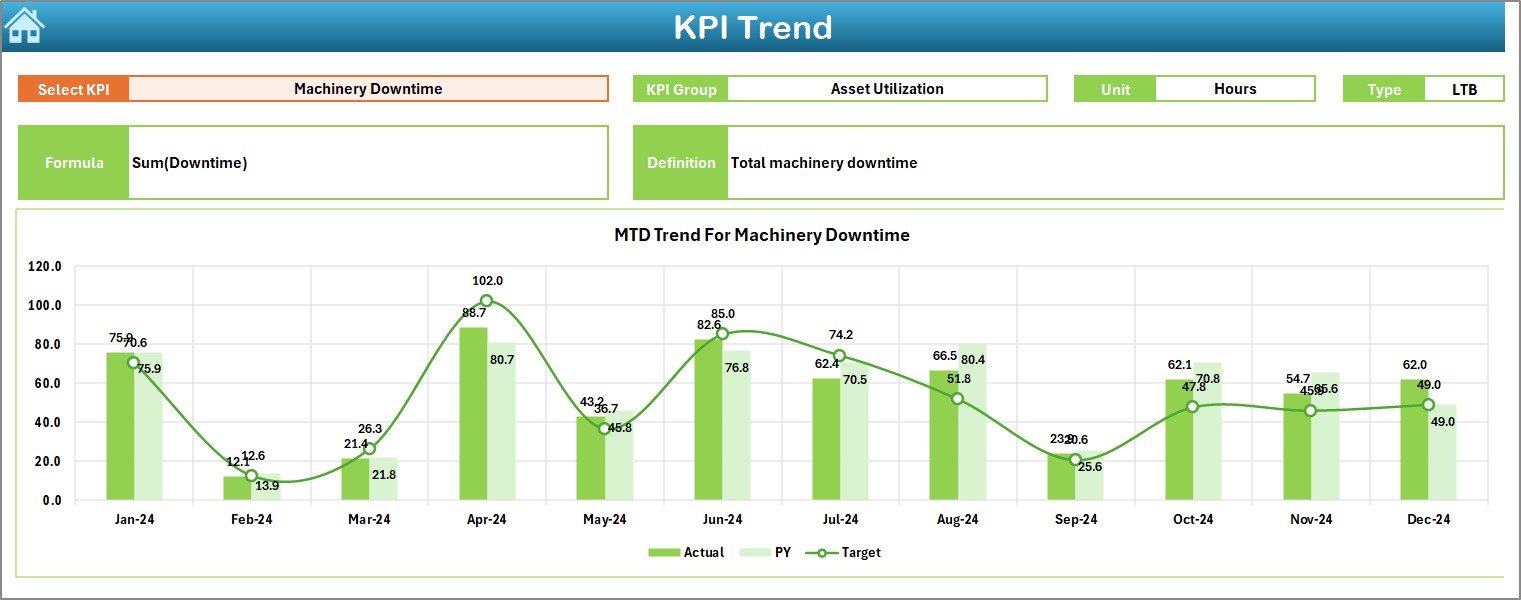
📈 KPI Trend Analysis
Drill into individual KPIs using trend charts that clearly show movement over time for both MTD and YTD metrics.
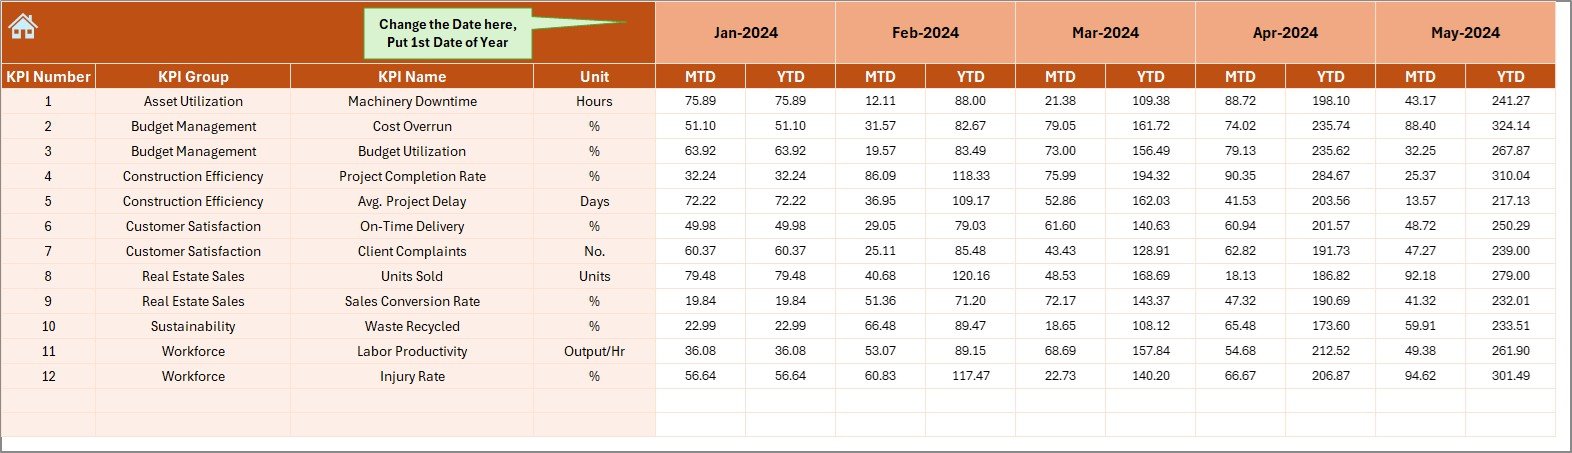
📥 Simple Data Entry
Enter Actuals, Targets, and Previous Year values in predefined sheets—no complex formulas required!
🔄 Auto-Updating Charts
Once you enter the data, charts across sheets update instantly. No manual refresh needed!
📦 What’s Inside the Construction and Real Estate KPI Dashboard
This Excel template comes packed with 7 professionally designed worksheet tabs:
🏠 Home Sheet
Acts as a navigation hub with buttons to access each sheet directly.
📊 Dashboard Sheet
Displays KPI cards for the selected month with visuals comparing Actual vs Target and Previous Year. Includes MTD & YTD data.
📈 KPI Trend Sheet
Dropdown to select a KPI and view trend lines along with definitions, formulas, and type (UTB or LTB).
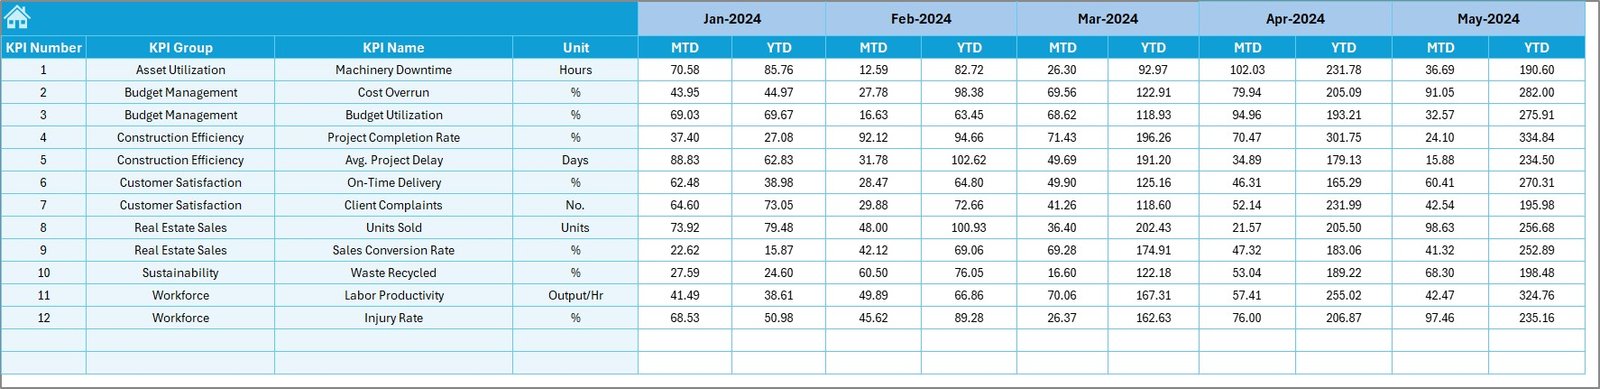
🧾 Actual Numbers Input Sheet
Enter your actuals for MTD and YTD values. The E1 cell lets you set the starting month of the year.
🎯 Target Sheet
Input your planned targets for every KPI, month by month.
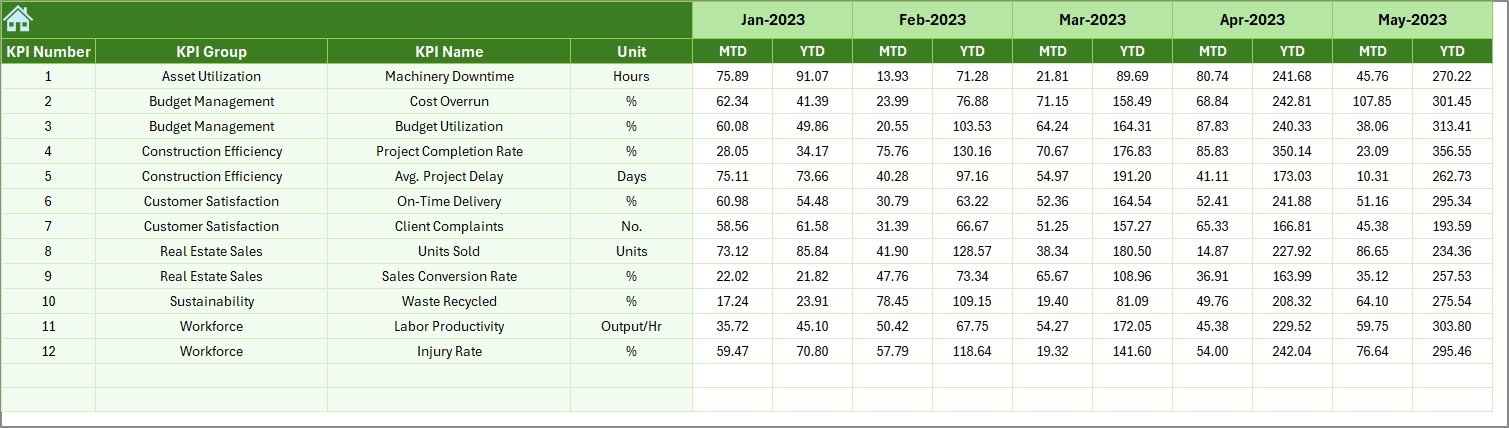
🕓 Previous Year Numbers
Store historical data to compare year-over-year performance.
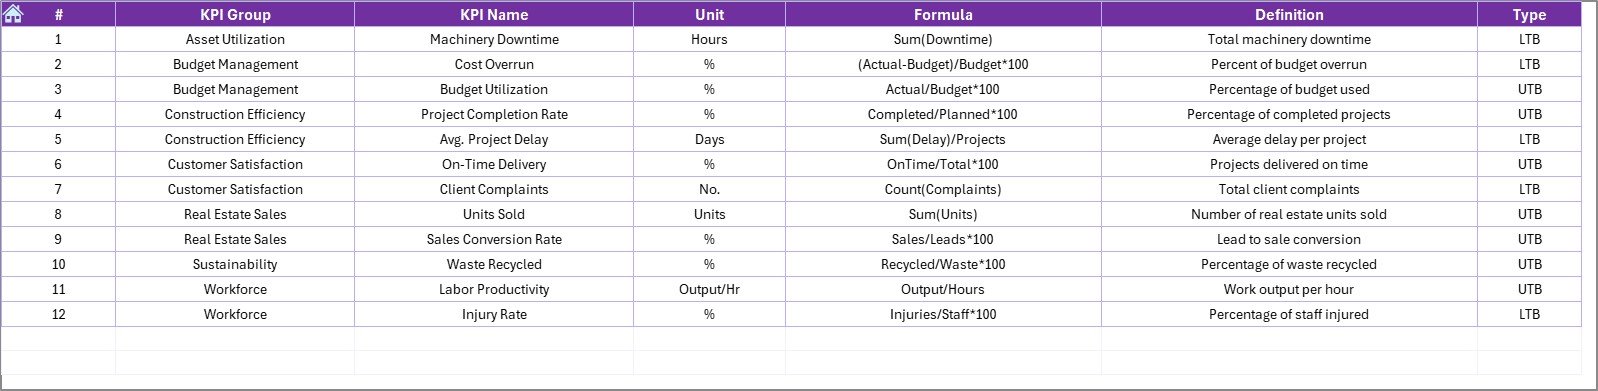
📚 KPI Definition Sheet
Maintain a well-documented list of all your KPIs with units, formulas, and explanations.
📌 How to Use the Dashboard
✔️ Step 1: Enter actual values in the Actual Numbers Input tab
✔️ Step 2: Set monthly goals in the Target Sheet
✔️ Step 3: Input last year’s data in the Previous Year Sheet
✔️ Step 4: Select KPIs in the Trend Sheet to see performance charts
✔️ Step 5: Open the Dashboard Tab, select the month from D3, and visualize your full KPI story!
👥 Who Can Benefit from This Dashboard?
✅ Construction Project Managers – Track budget variance, safety metrics, and timeline KPIs.
✅ Real Estate Developers – Monitor sales, cost per sq. ft., client satisfaction, and energy efficiency.
✅ Site Engineers & Contractors – Ensure you’re staying on schedule and within cost estimates.
✅ Business Analysts & Consultants – Provide clients with real-time, structured reports.
✅ SMEs & Startups – A cost-effective alternative to complex ERP systems.
🔥 Real Impact, Real Results
A real estate firm used this dashboard across 10 projects and achieved:
-
⬇️ 30% drop in safety incidents
-
📈 18% improvement in project timelines
-
💰 Better control over budget fluctuations
Why? Because everything they needed was in one Excel file.
✅ Built in Excel—No Complex Software Needed
🔹 Works on any Excel-enabled computer
🔹 No coding or VBA knowledge required
🔹 Fully customizable with your KPIs
🔹 One-time payment—no subscriptions
🛠️ Ideal for:
-
Construction & Real Estate Firms
-
Infrastructure Projects
-
Renovation & Facility Managers
-
Property Consultants
-
PMOs & Freelancers
🔗 Click here to read the Detailed blog post
🎥 Visit our YouTube channel to learn step-by-step video tutorials


Reviews
There are no reviews yet.