


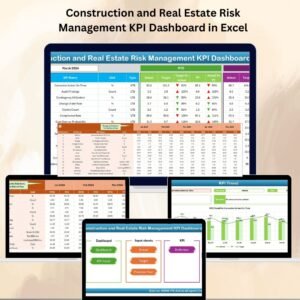
In the construction and real estate industry Construction and Real Estate Customer Feedback KPI Dashboard. Projects involve massive investments, long timelines, and high client expectations. A single communication gap can lead to delays, cost overruns, or even reputational loss. To avoid these pitfalls, you need a structured way to track, measure, and improve client feedback.
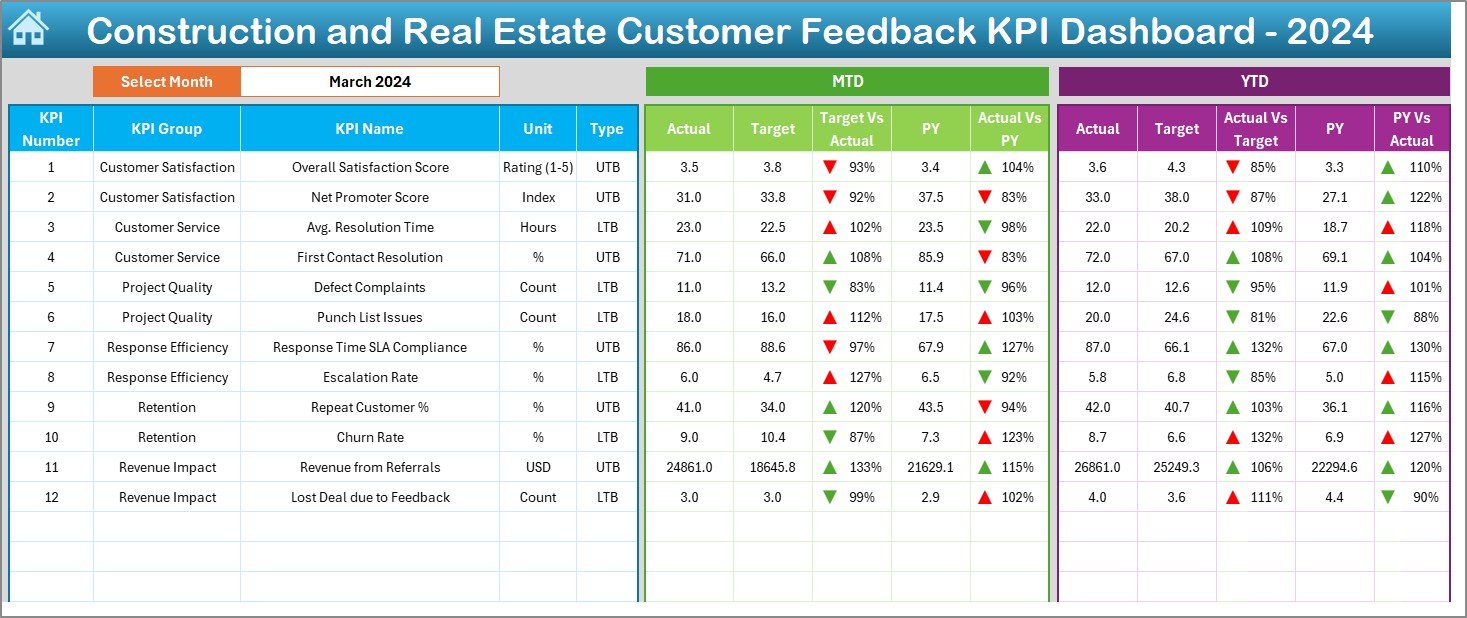
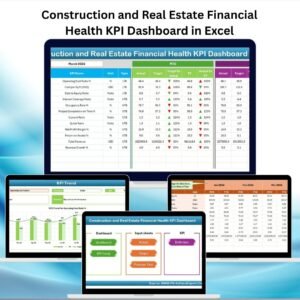
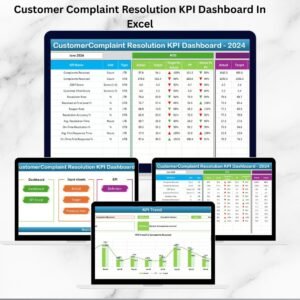
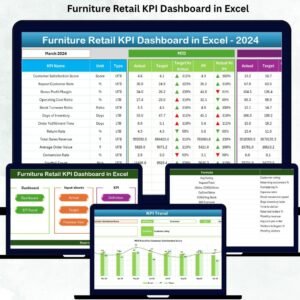
That’s why we created the Construction and Real Estate Customer Feedback KPI Dashboard in Excel — a powerful, ready-to-use tool that consolidates customer feedback into meaningful insights. With this dashboard, you can measure satisfaction, analyze trends, and compare Actuals vs Targets vs Previous Year data in real time.
Built entirely in Excel, this tool is easy to use, requires no additional software, and offers instant clarity on customer sentiment across projects.
🔑 Key Features of the Customer Feedback KPI Dashboard
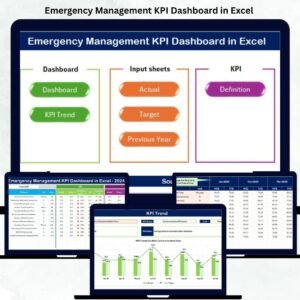
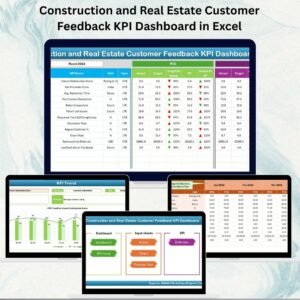
✨ 7 Pre-Built Worksheets – Includes Home, Dashboard, KPI Trend, Actual Numbers, Target, Previous Year, and KPI Definition.
✨ Real-Time Tracking – Monitor MTD and YTD results with automated variance analysis.
✨ Visual Insights – Green/red arrows and conditional formatting instantly highlight performance.
✨ Interactive Dashboard – Select months from drop-down menus and see instant updates.
✨ Comprehensive KPI Coverage – Track CSAT, NPS, resolution time, defect rate, repeat customers, and more.
✨ Excel-Based Solution – No need for new software, licensing, or complex setup.
✨ Self-Explanatory Design – KPI definitions, formulas, and units clearly documented.
✨ Scalable for Any Business Size – From small contractors to large developers, it adapts to your needs.
📦 What’s Inside the Dashboard
When you download this Excel dashboard, you get:
1️⃣ Home Sheet – Acts as an index with 6 navigation buttons for smooth access.
2️⃣ Dashboard Sheet – The central hub displaying KPIs, variance analysis, and YTD comparisons.
3️⃣ KPI Trend Sheet – Select a KPI and review detailed trends with Actual vs Target vs Previous Year charts.
4️⃣ Actual Numbers Input Sheet – Log monthly results with a simple, structured input system.
5️⃣ Target Sheet – Define your benchmarks by month and year.
6️⃣ Previous Year Sheet – Store historical data for YoY comparison.
7️⃣ KPI Definition Sheet – Document all KPIs with units, type (UTB/LTB), formulas, and definitions.
Everything is pre-connected, automated, and formatted — simply plug in your data and watch the insights unfold.
🛠️ How to Use the Customer Feedback KPI Dashboard
✔️ Step 1 – Enter Data: Record monthly actuals in the Actual Numbers sheet.
✔️ Step 2 – Add Targets: Define goals in the Target sheet.
✔️ Step 3 – Review KPIs: Use the Dashboard sheet to view MTD and YTD performance.
✔️ Step 4 – Compare: Instantly analyze Actual vs Target vs Previous Year values.
✔️ Step 5 – Monitor Trends: Use the KPI Trend sheet to track long-term patterns.
✔️ Step 6 – Take Action: Use insights to reduce complaints, improve timelines, and build trust.
No technical skills required — it’s plug-and-play.
👥 Who Can Benefit from This Dashboard
🏢 Construction Companies – Monitor delivery timelines and client satisfaction.
🏠 Real Estate Developers – Measure homebuyer feedback and referral potential.
🔨 Contractors – Identify common complaint areas and resolve issues faster.
📊 Consultants – Provide data-backed performance reports for clients.
💼 Project Managers – Track CSAT, NPS, and issue resolution KPIs for continuous improvement.
Whether you’re managing a single project or multiple portfolios, this dashboard helps you stay aligned with customer expectations.
Click here to read the Detailed blog post
Visit our YouTube channel to learn step-by-step video tutorials 👉 Youtube.com/@PKAnExcelExpert


Reviews
There are no reviews yet.