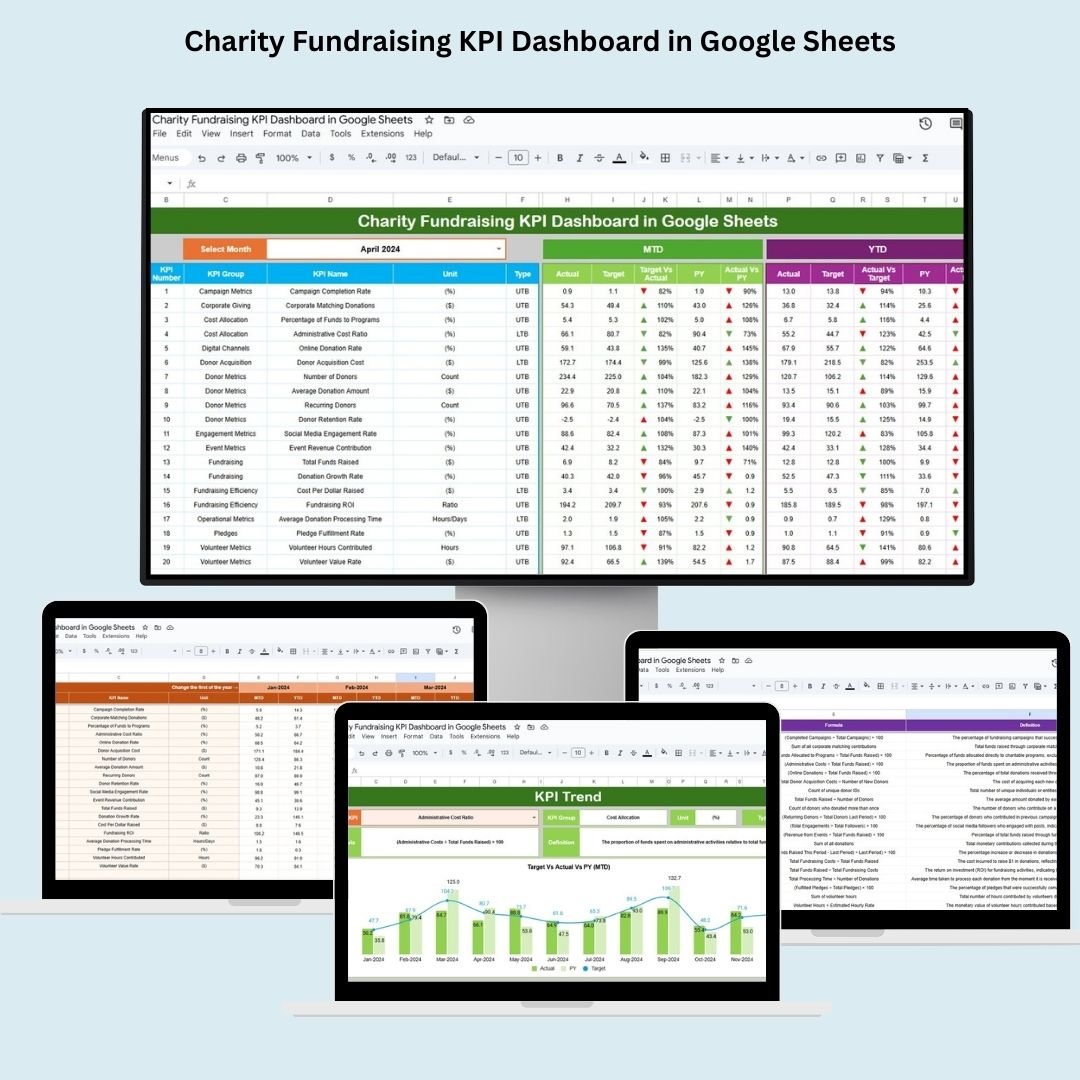
Managing fundraising campaigns is critical for any nonprofit. But with scattered data and unclear results, it’s easy to lose sight of what’s working and what’s not. That’s why we created the Charity Fundraising KPI Dashboard in Google Sheets — a fully customizable, easy-to-use, and data-driven dashboard that helps you monitor donation success, optimize performance, and maximize impact.
With real-time insights and clean visuals, this template empowers you to track fundraising KPIs like Total Donations, Donor Retention, and Fundraising ROI — all in one place!
✨ Key Features of the Dashboard
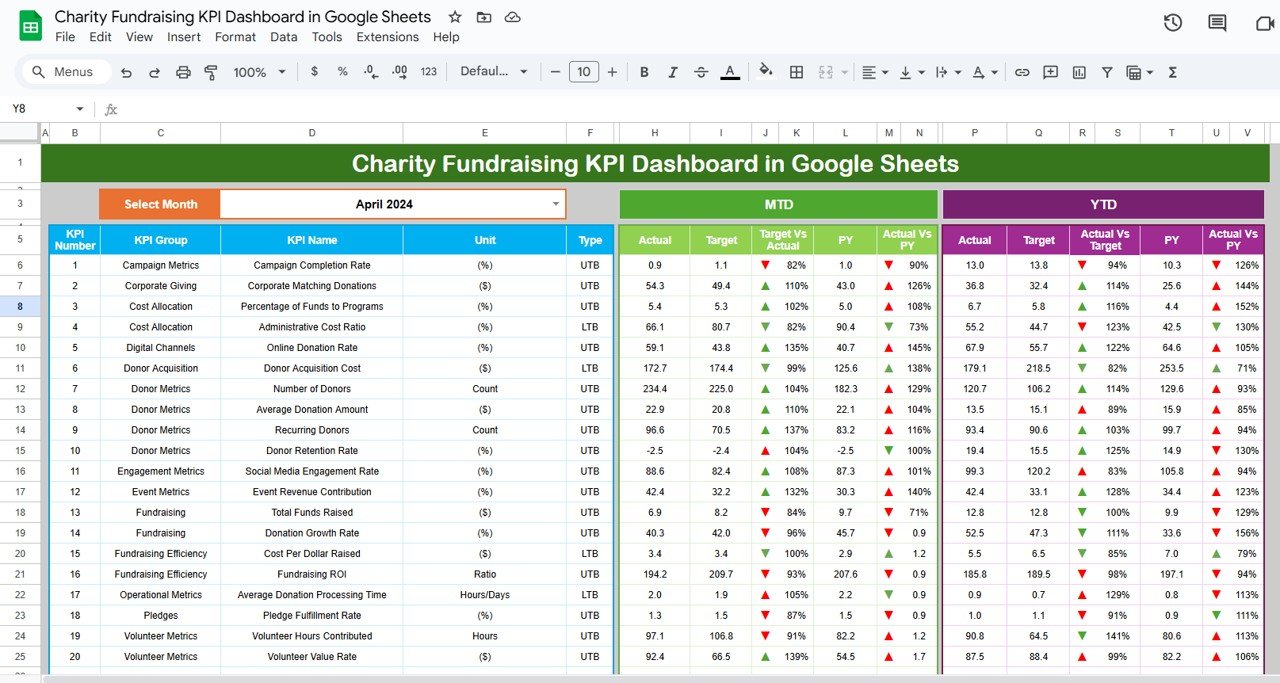
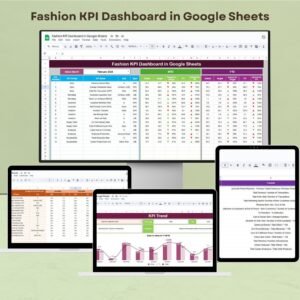
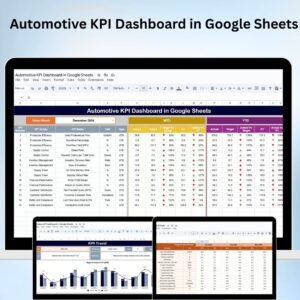
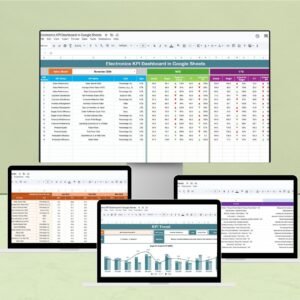
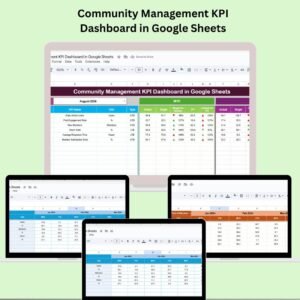
📊 Dashboard Sheet – At-a-Glance Fundraising Performance
-
🔽 Month Selector (D3): Switch between months and watch the dashboard auto-update
-
🧾 Metrics Shown:
-
MTD (Month-to-Date): Actual, Target, Previous Year
-
YTD (Year-to-Date): Actual, Target, Previous Year
-
-
📈 Visual indicators (Up/Down Arrows) highlight positive or negative trends
Perfect for sharing insights with donors, stakeholders, or internal teams.
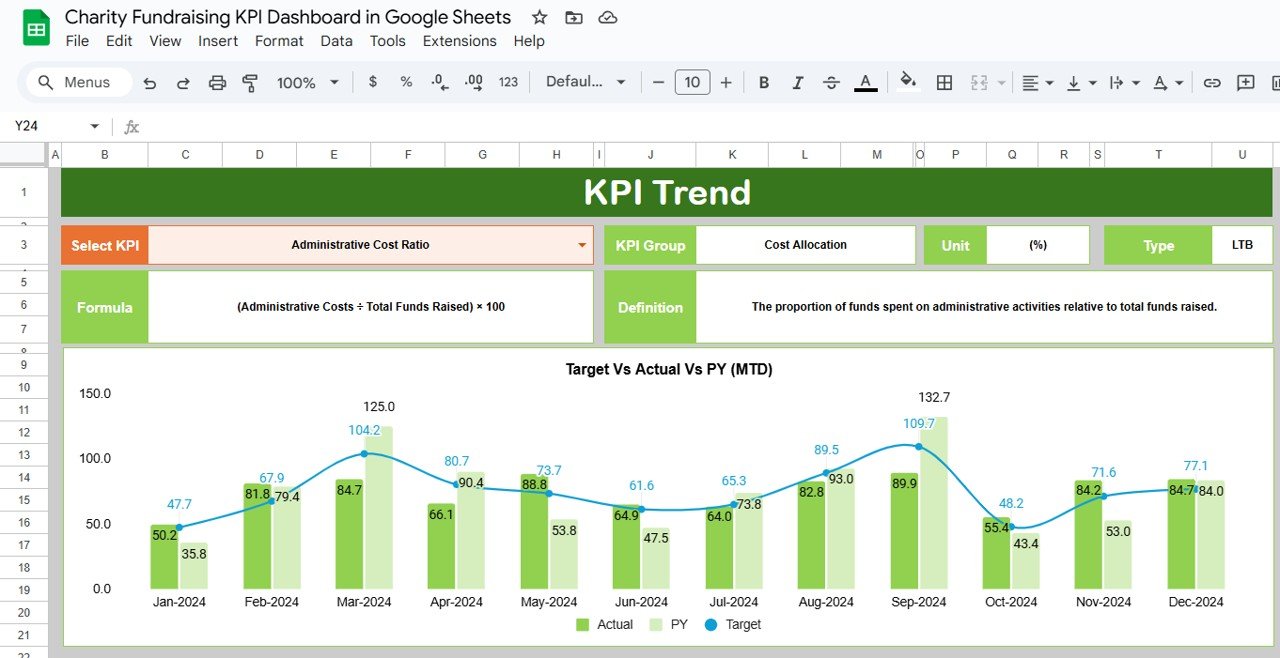
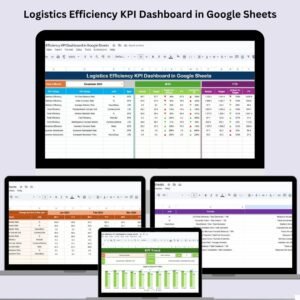
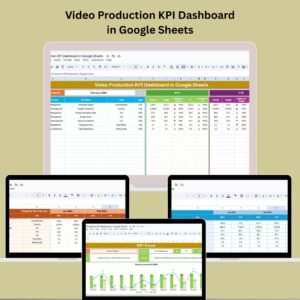
🔄 KPI Trend Sheet – Track Progress Over Time
-
🎯 Drop-down selection (C3) lets you choose any KPI
-
See full metadata: KPI Group, Unit, Type (LTB/UTB), Formula, and Definition
-
📉 Trend Charts show MTD and YTD values across months
Use it to make smarter campaign decisions and identify seasonal trends.
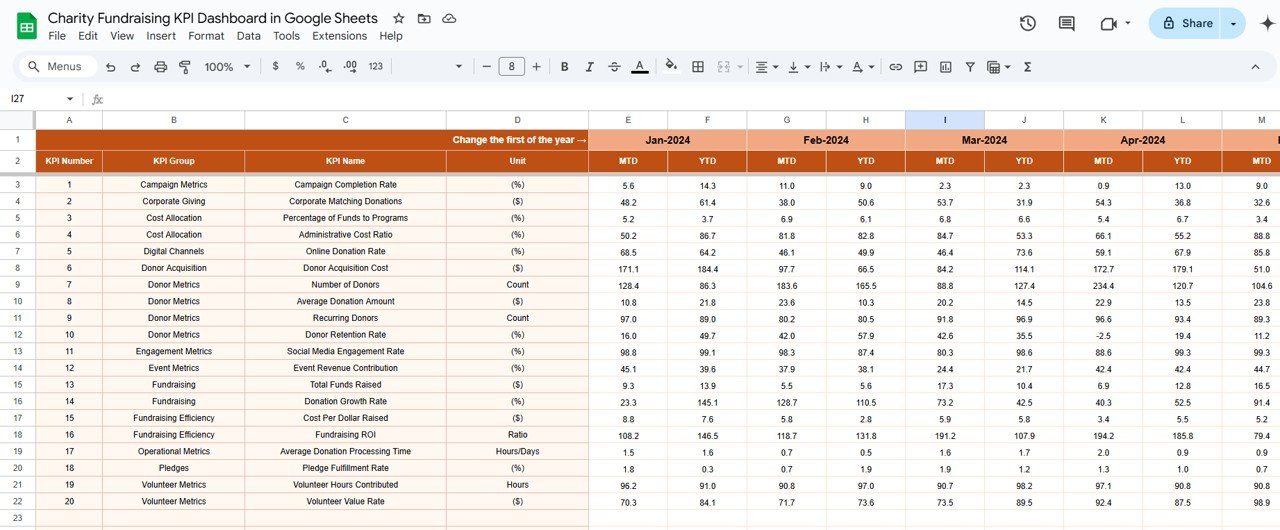
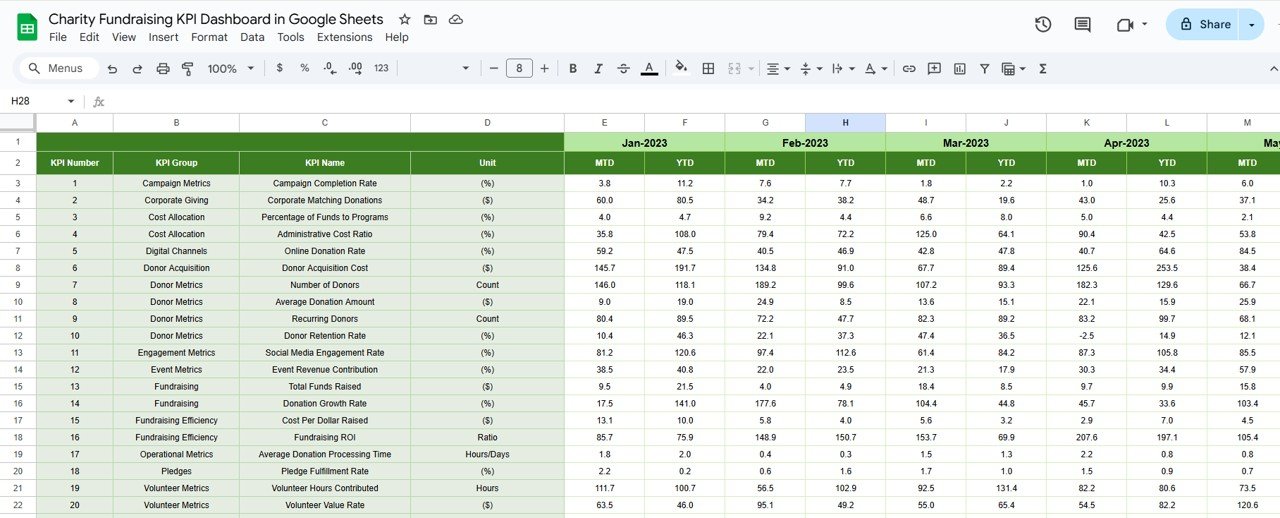
🧾 Actual Numbers Sheet – Simple, Clear Data Entry
-
📅 Change the tracking month in cell E1
-
📌 Input MTD & YTD values for each KPI
-
All visuals and charts auto-update — no formulas needed!
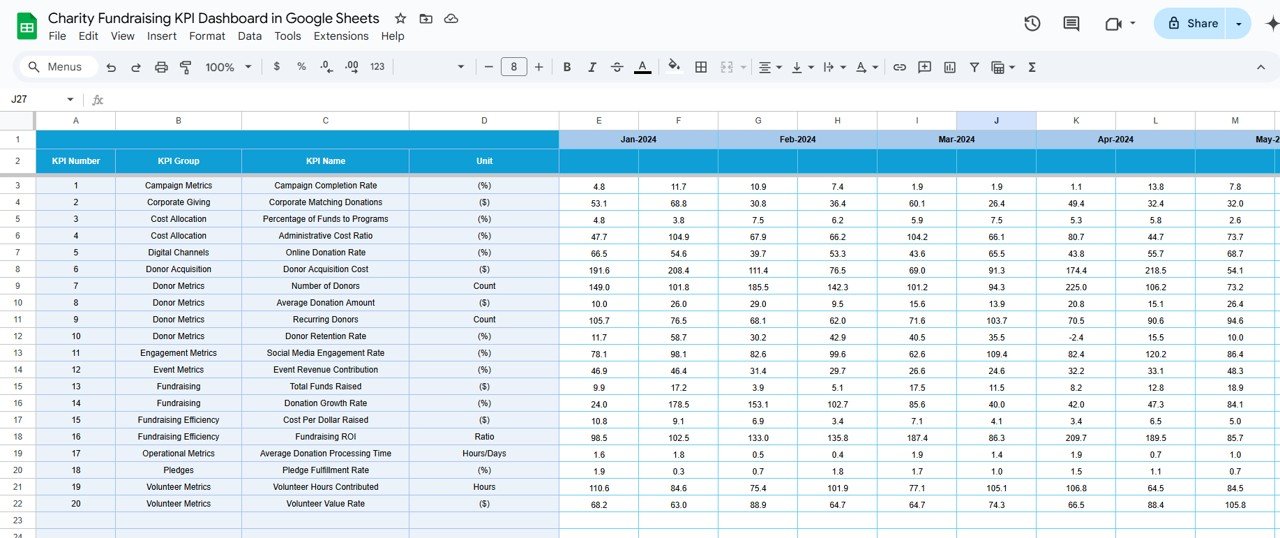
🎯 Target Sheet – Set and Track Fundraising Goals
-
Define MTD and YTD targets per KPI
-
Compare Actual vs. Target in real time
-
Helps measure campaign effectiveness
📆 Previous Year Sheet – YoY Comparisons
-
Record last year’s data and benchmark progress
-
Enables long-term planning and campaign retrospectives
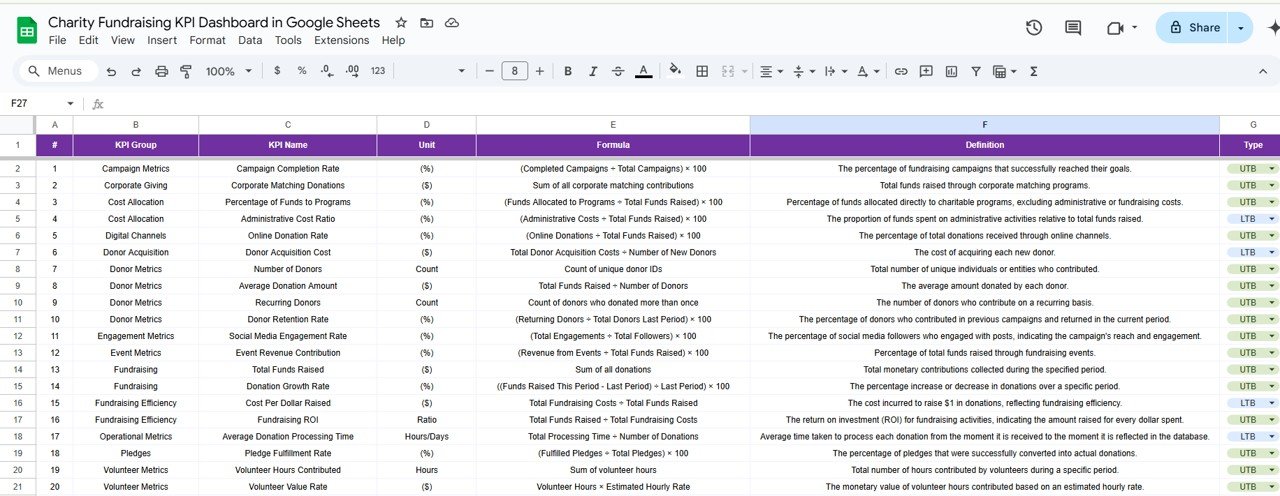
📘 KPI Definition Sheet – Shared Understanding Across Teams
-
Record the name, unit, formula, type, and definition of each KPI
-
🧠 Great for onboarding new team members or presenting to donors
🧠 Why Use a Fundraising KPI Dashboard?
Because when you measure impact, you improve it. This dashboard helps you:
💰 Increase Total Donations – Spot high-performing campaigns fast
📣 Boost Donor Engagement – Track Retention, Recurrence, and Satisfaction
📉 Reduce Fundraising Costs – See how every dollar works
📈 Improve Decision-Making – Real-time data leads to smarter actions
From strategic planning to donor reporting, this tool is your nonprofit’s fundraising command center.
✅ Advantages of This Dashboard
🔍 Real-Time Fundraising Tracking – Always know where you stand
🧾 Compare Target vs. Actual – Instantly spot underperformance
📅 Month-by-Month Visibility – Analyze campaigns over time
📈 Visual Reporting – Charts, arrows, and clean layouts
🧩 Fully Editable in Google Sheets – No complex software required
🤝 Team-Friendly – Share via Google Drive for collaborative input
💡 Perfect for Nonprofits, NGOs, Churches, and Fundraising Events
🧩 Best Practices for Use
✔️ Update your actuals monthly for fresh insights
✔️ Set realistic, mission-aligned fundraising targets
✔️ Use conditional formatting to highlight red flags
✔️ Focus on 5–7 core KPIs for clarity
✔️ Involve your team in tracking and improvement
✔️ Present dashboard visuals in board reports or donor pitches


Reviews
There are no reviews yet.