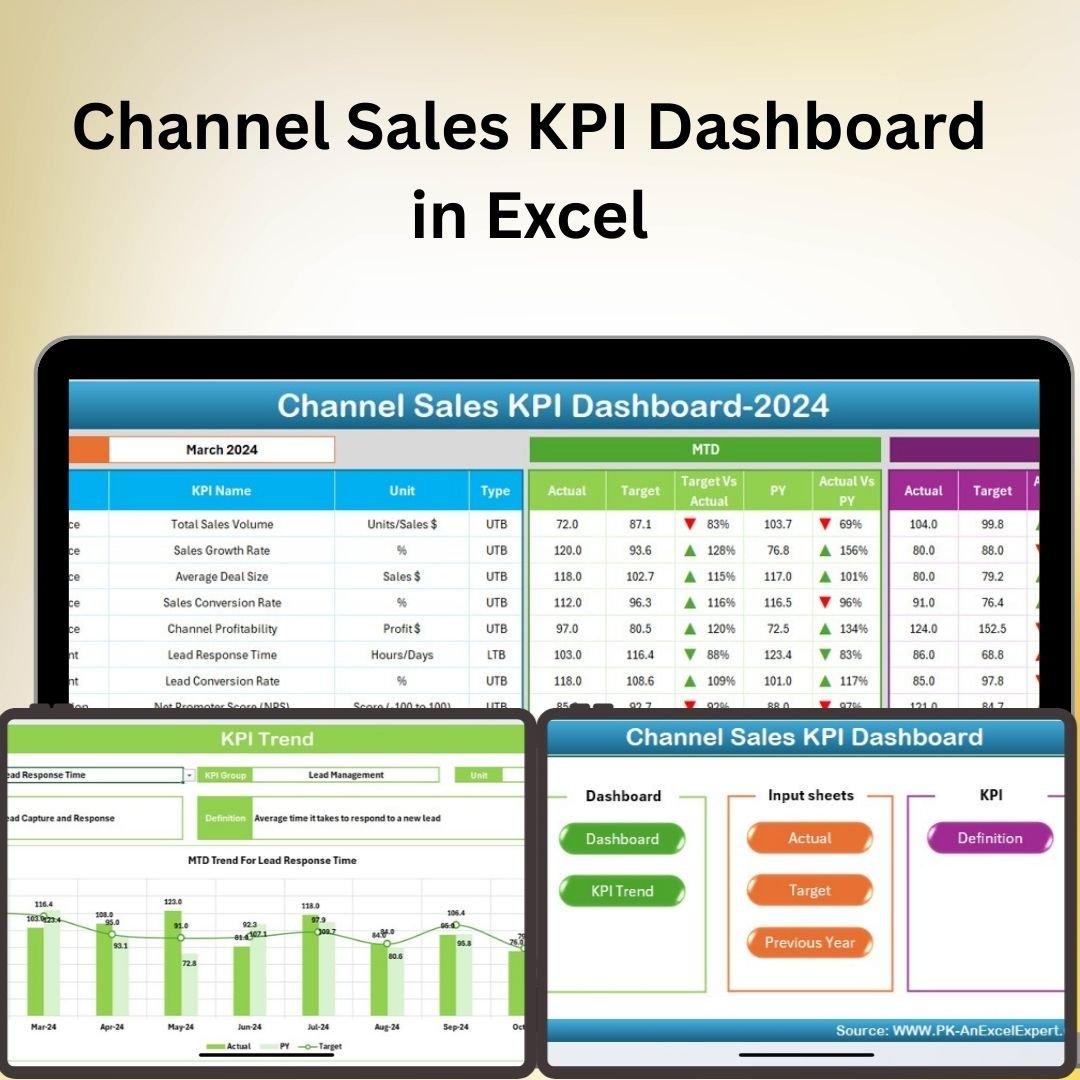
The Channel Sales KPI Dashboard in Excel is a powerful and interactive tool designed to help businesses track, analyze, and optimize their channel sales performance. This comprehensive Excel dashboard allows you to monitor sales trends, performance metrics, and channel effectiveness, giving you a clear view of how your products or services are performing across different channels.
With features like sales comparison, performance metrics tracking, and real-time data updates, this dashboard enables you to make data-driven decisions to enhance your sales strategy. Whether you’re managing multiple sales channels, distributors, or partners, this tool simplifies the complex task of tracking sales performance and ensures you’re always on top of your sales game.
Key Features of the Channel Sales KPI Dashboard in Excel:
📊 Comprehensive KPI Tracking
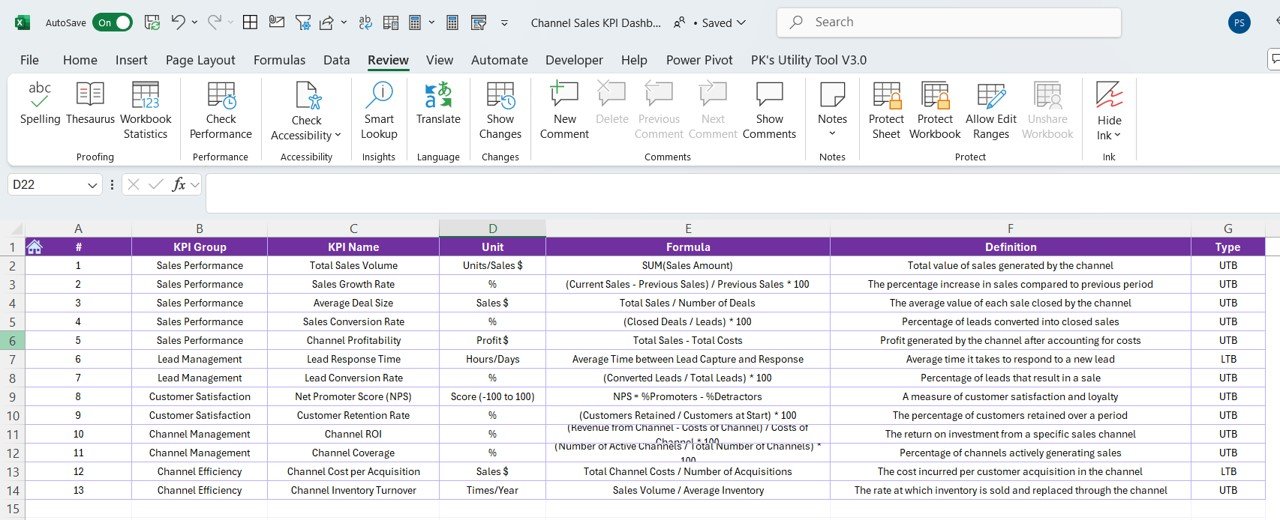
Track key sales metrics like revenue, sales volume, and channel performance to measure the success of your sales channels and identify areas for improvement.
📈 Sales Comparison
Compare sales performance across different channels, periods, and regions to understand which channels are driving the most revenue and where adjustments are needed.
💡 Real-Time Data Updates
The dashboard is designed to update in real time, ensuring you always have the most up-to-date sales data at your fingertips.
🎯 Customizable Sales Targets
Set specific sales targets for each channel and compare actual sales performance against your goals, making it easier to assess the effectiveness of your sales strategies.
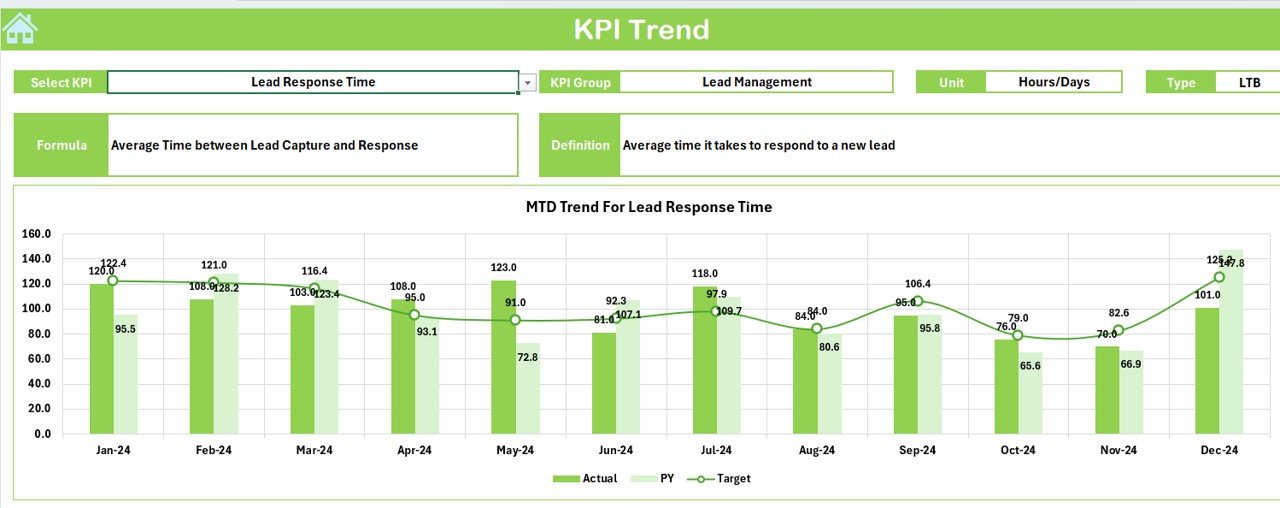
📊 Visual Analytics
The dashboard comes with visually appealing charts and graphs that provide insights into sales performance, helping you quickly identify trends and issues.
📂 Channel Segmentation
Track performance by individual sales channels, such as online, retail, or wholesale, to identify strengths and weaknesses in each segment.
🚀 Why You’ll Love the Channel Sales KPI Dashboard in Excel:
✅ Track Sales Effectiveness – Monitor the performance of each sales channel in real time to ensure your team is meeting targets and driving sales.
✅ Optimize Sales Strategy – Analyze trends and channel performance to adjust your strategy for maximum revenue generation.
✅ Improve Decision-Making – Use real-time insights and sales comparisons to make informed decisions about where to allocate resources and focus efforts.
✅ Enhance Reporting – Create professional, data-driven sales reports that can be shared with stakeholders, managers, or clients to showcase performance.
✅ Simplify Complex Data – With visual charts, graphs, and tables, the dashboard makes it easy to digest complex sales data and turn it into actionable insights.
✅ Customizable for Your Business Needs – Customize the dashboard to fit your specific sales channels, goals, and performance metrics.
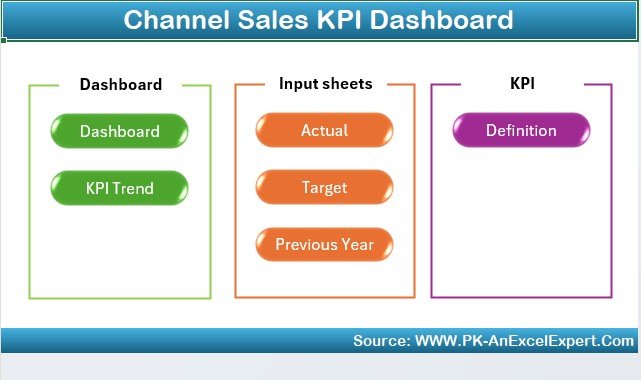
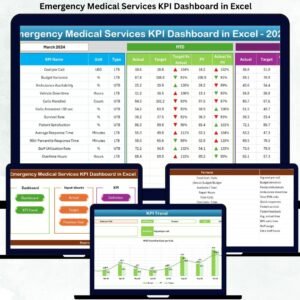
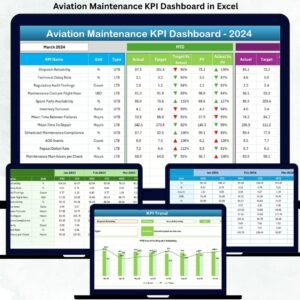
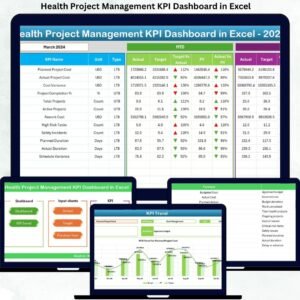
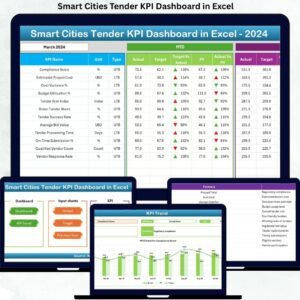
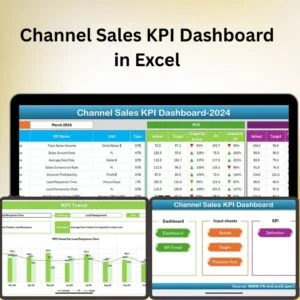
What’s Inside the Channel Sales KPI Dashboard in Excel:
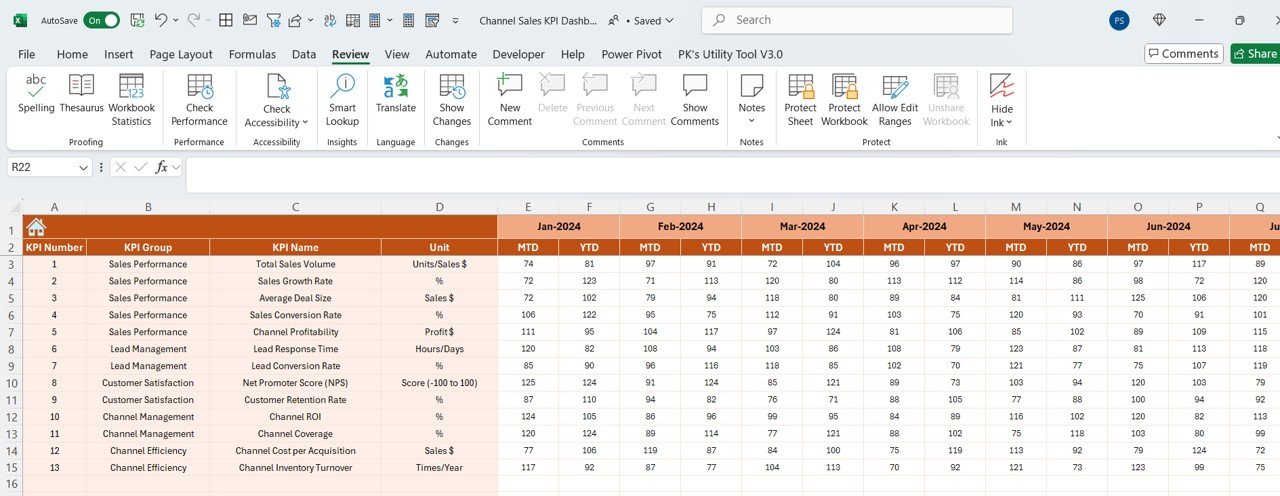
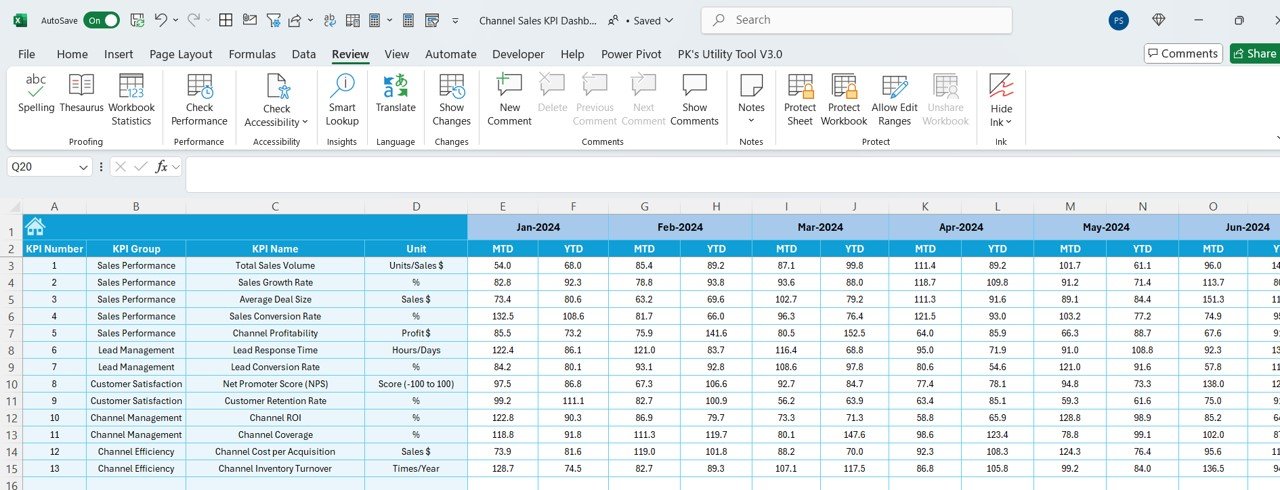
- Sales KPI Tracker: Track key sales metrics, such as revenue, units sold, and conversion rates, across all channels.
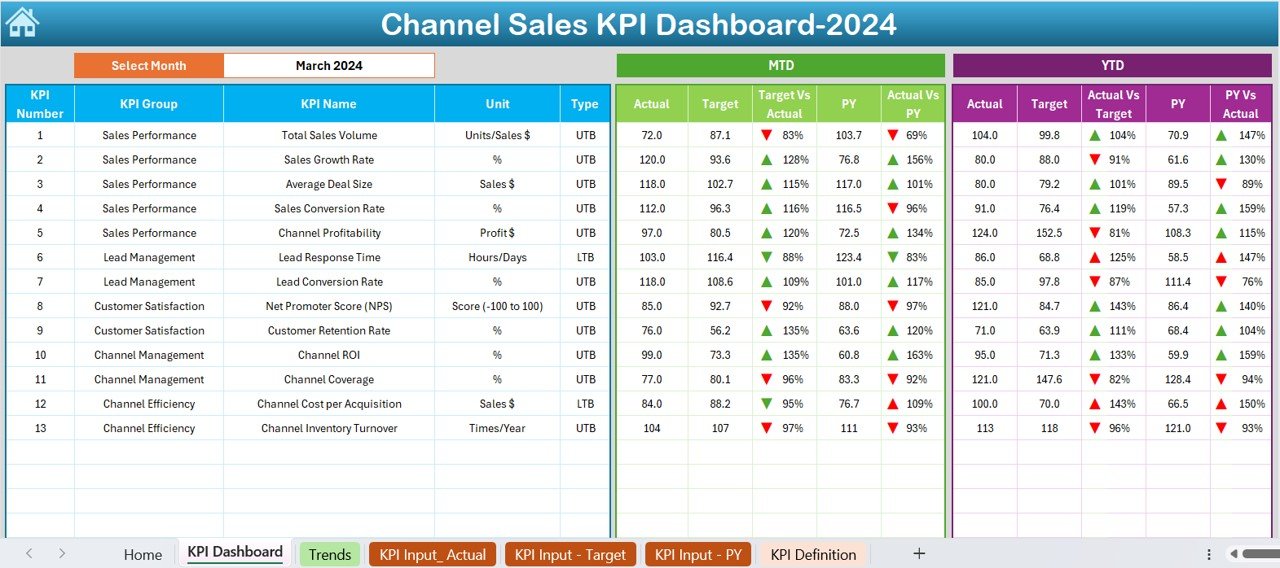
- Channel Performance Analysis: Compare sales performance between different channels (e.g., online, retail, wholesale) to understand which are most effective.
- Target vs. Actual Comparison: Set targets for each channel and monitor actual sales performance against your goals.
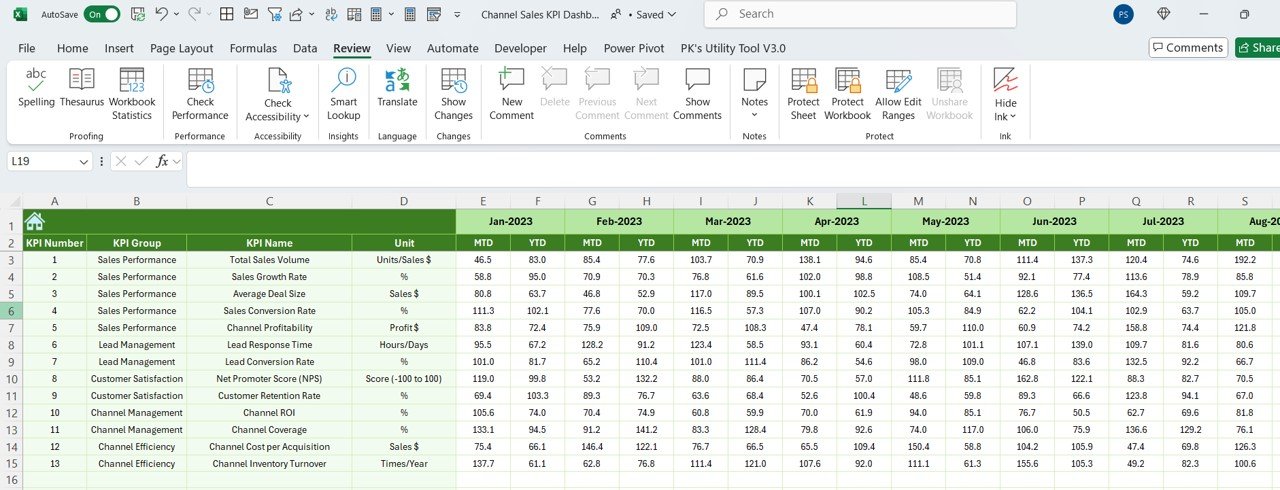
- Sales Trends: Visualize sales trends over time and spot potential opportunities or areas for improvement.
- Real-Time Data Updates: Automatically update data for a current view of your sales performance without the need for manual input.
- Channel Segmentation: Break down your sales performance by channel type, region, and sales team for a deeper analysis.
How to Use the Channel Sales KPI Dashboard in Excel:
1️⃣ Download the Template – Instantly access your Excel file upon purchase.
2️⃣ Input Sales Data – Enter your sales data by channel, including revenue, sales volume, and sales targets.
3️⃣ Set Sales Targets – Define the sales targets for each channel and input them into the dashboard.
4️⃣ Track Performance – Monitor real-time performance across all sales channels and compare actual sales to your targets.
5️⃣ Generate Reports – Use the dashboard to generate professional sales performance reports for internal analysis or external presentations.
Who Can Benefit from the Channel Sales KPI Dashboard in Excel:
- Sales Managers
- Business Owners
- Sales Teams
- Channel Partners
- Distribution Managers
- Retail Managers
- Marketing Teams
- Analysts
The Channel Sales KPI Dashboard in Excel is an essential tool for any business that wants to improve its channel sales performance, optimize strategies, and track key metrics in one easy-to-use dashboard.
Click here to read the Detailed blog post
https://www.pk-anexcelexpert.com/channel-sales-kpi-dashboard-in-excel/
Visit our YouTube channel to learn step-by-step video tutorials
Youtube.com/@PKAnExcelExpert


Reviews
There are no reviews yet.