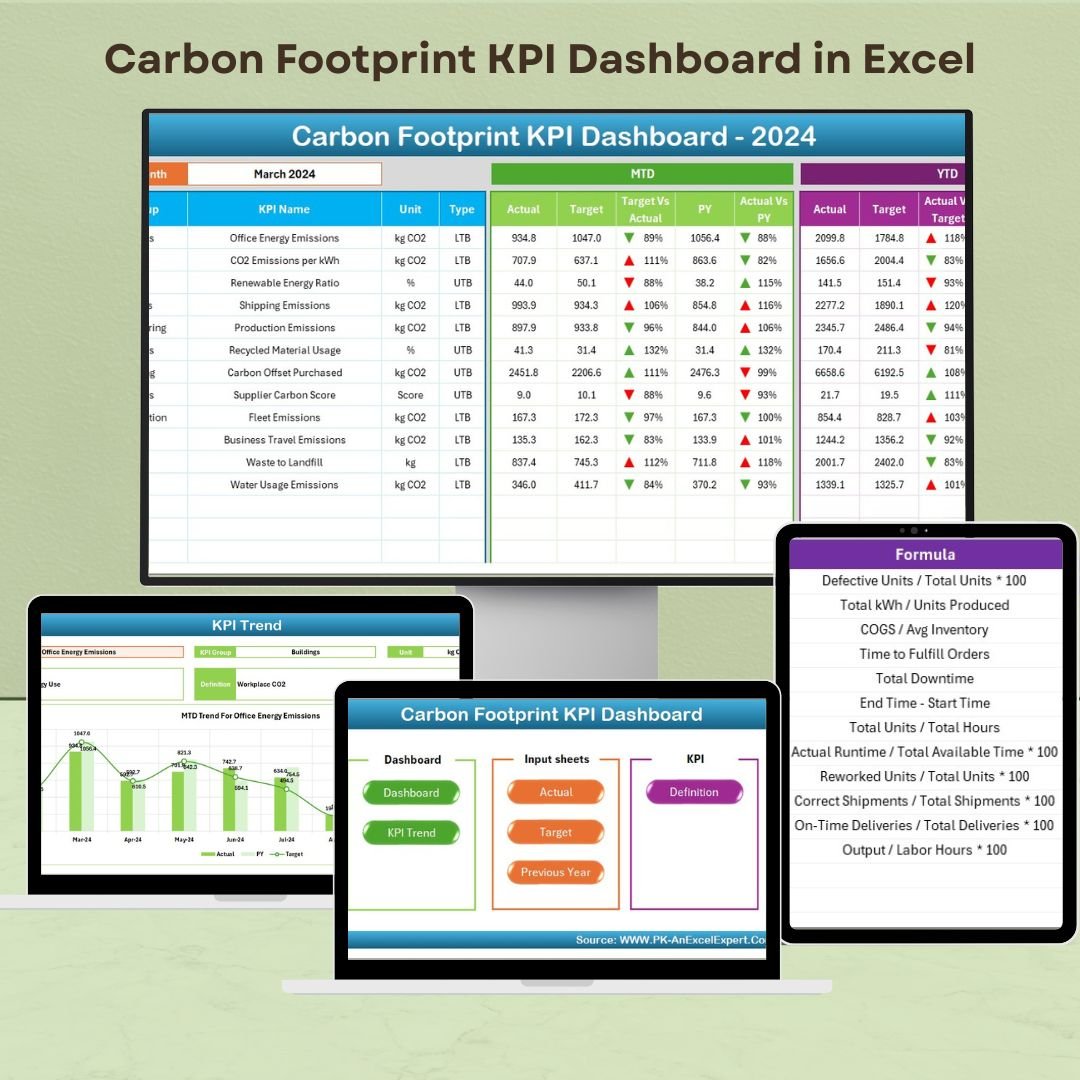
The Carbon Footprint KPI Dashboard in Excel is a powerful tool designed to help organizations track, analyze, and reduce their carbon emissions. This Excel-based dashboard consolidates key performance indicators (KPIs) related to carbon footprint, providing a clear and detailed overview of your environmental impact.
By utilizing this dashboard, businesses can make informed decisions that align with their sustainability goals, optimize carbon footprint management, and ensure compliance with environmental regulations.
Key Features of the Carbon Footprint KPI Dashboard in Excel
📊 Comprehensive KPI Tracking
-
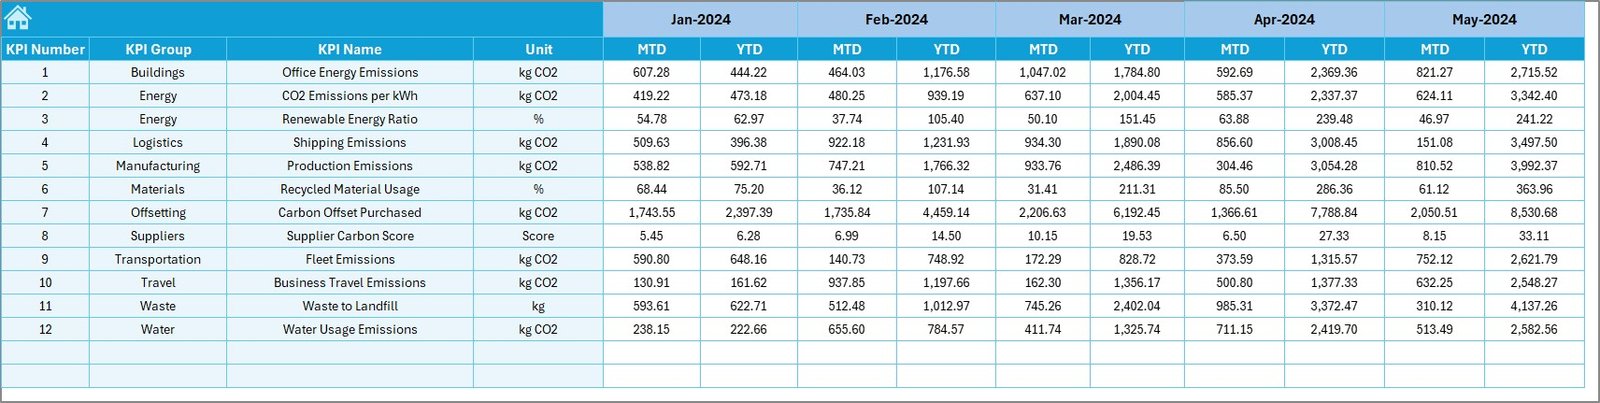
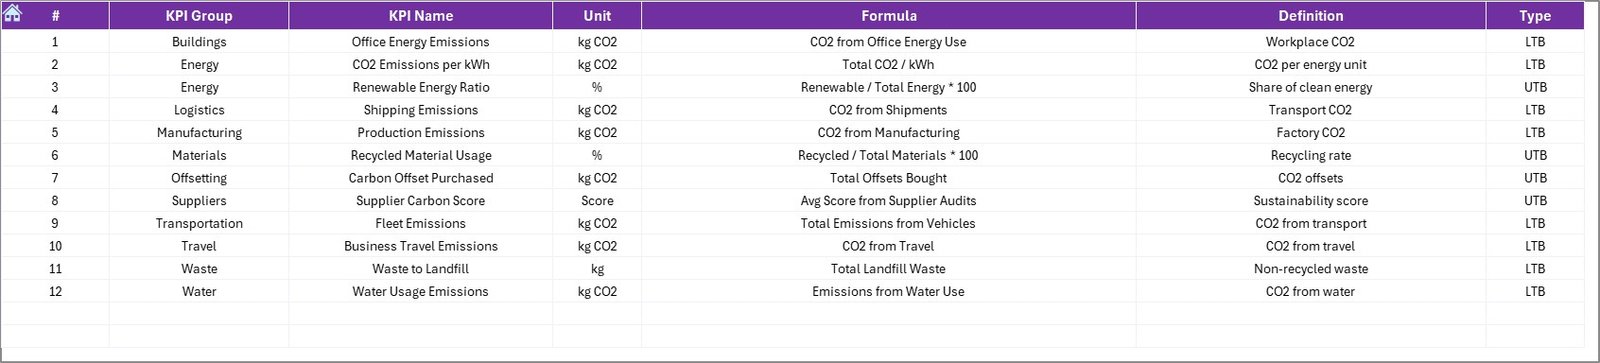
Track Key Emissions Metrics: Monitor KPIs such as carbon emissions per unit of production, energy consumption, transportation emissions, and waste management.
-
Real-Time Data Updates: Ensure that your dashboard is always current with live data updates, so you can stay on top of your environmental performance.
📈 Customizable Metrics
-
Tailor to Your Needs: Adapt the dashboard to suit your organization’s specific sustainability goals and carbon footprint measurement criteria.
-
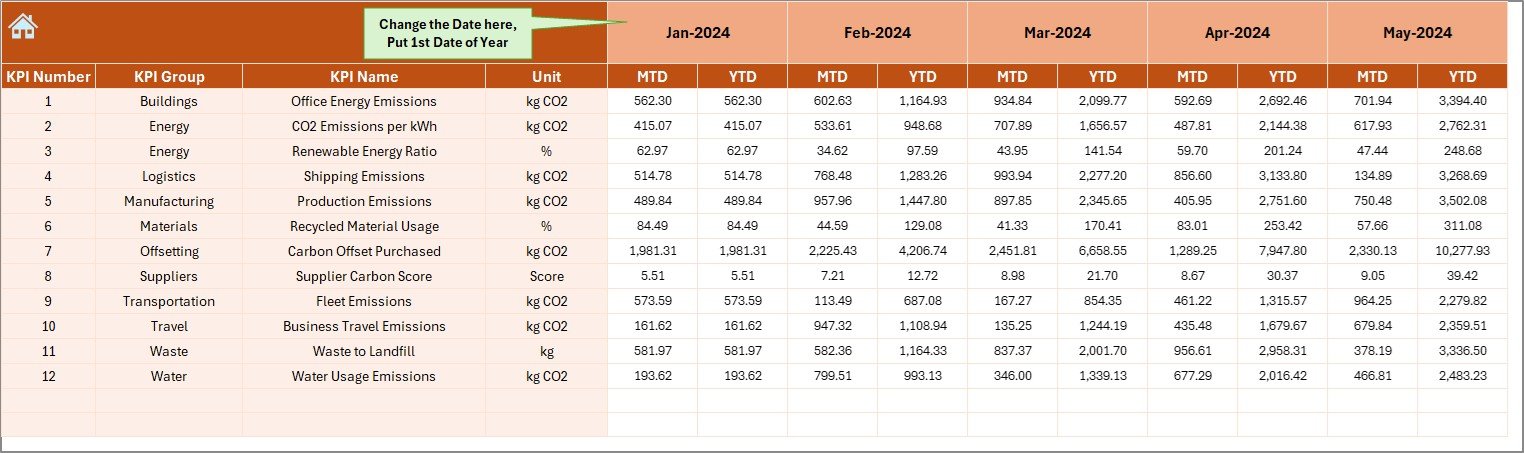
Data Integration: Easily import data from environmental tracking systems or manually input emissions data to keep the dashboard updated.
🔧 User-Friendly Interface
-
Ease of Use: The dashboard is designed for simplicity, making it accessible to all team members, even those with limited experience in Excel.
-
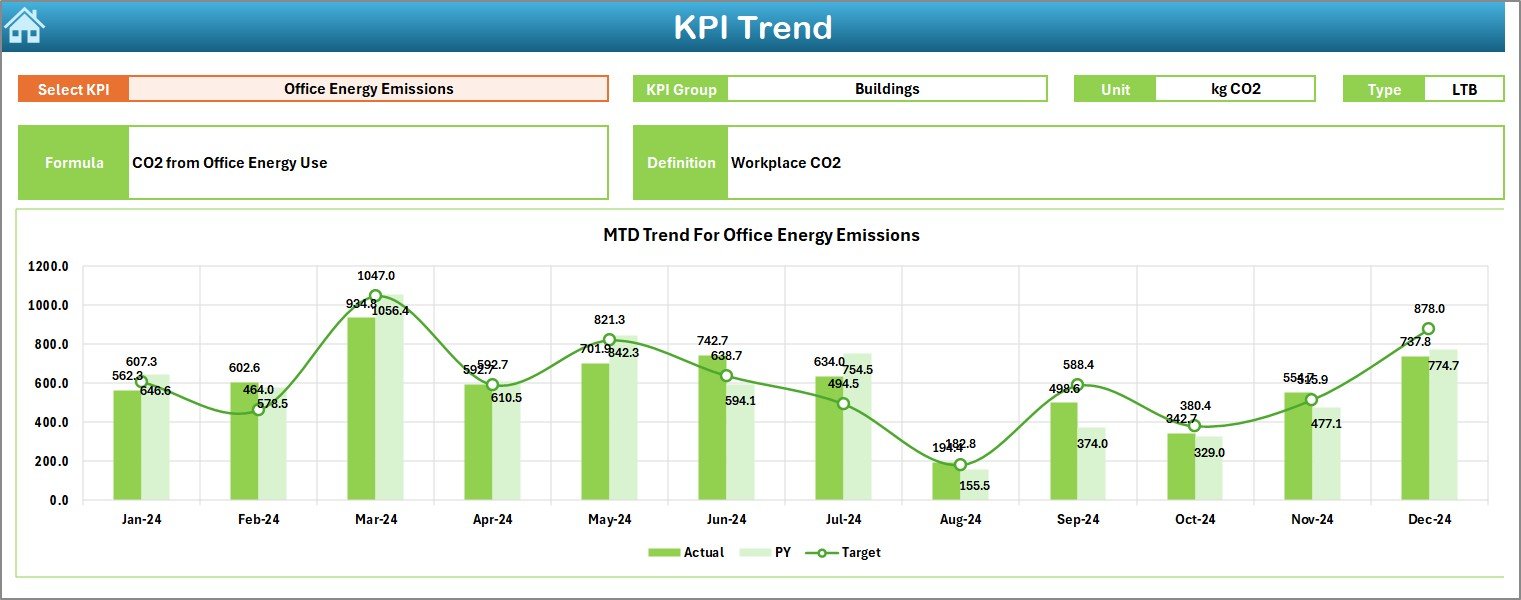
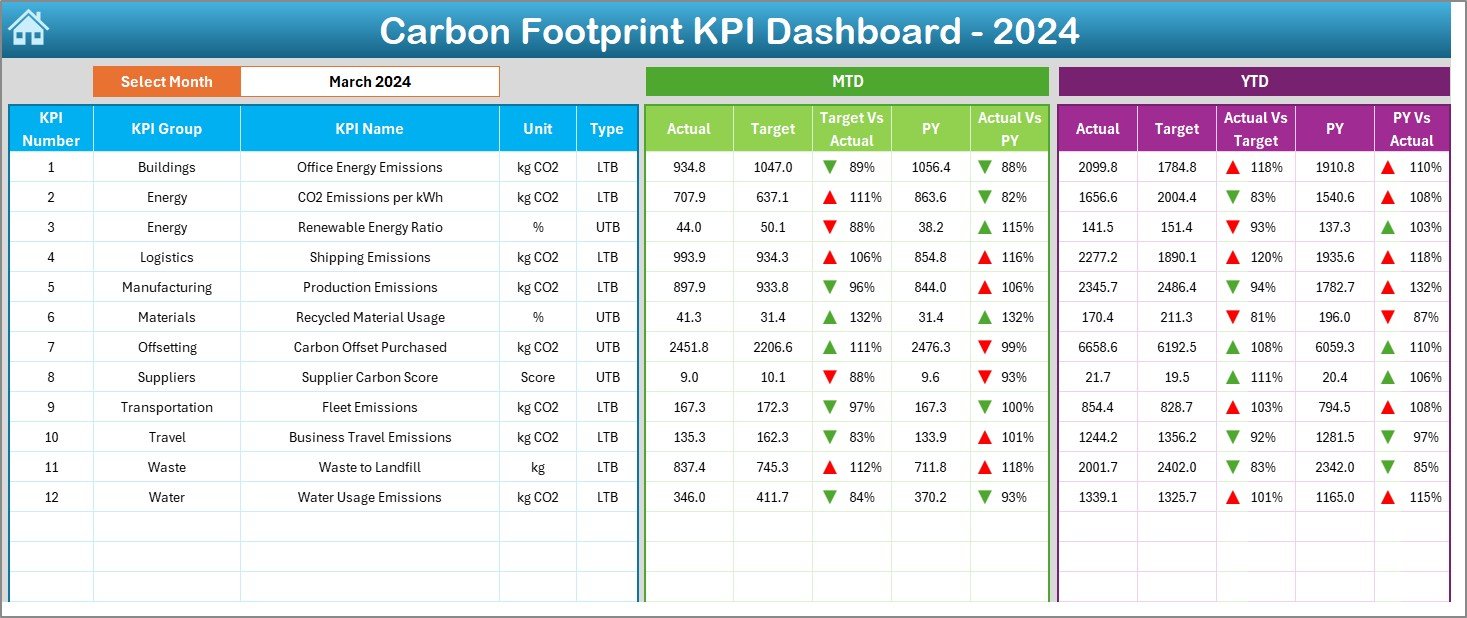
Dynamic Visuals: Use charts, graphs, and color-coded indicators to visualize trends and identify areas for improvement in your carbon footprint management.
📅 Performance Monitoring & Reporting
-
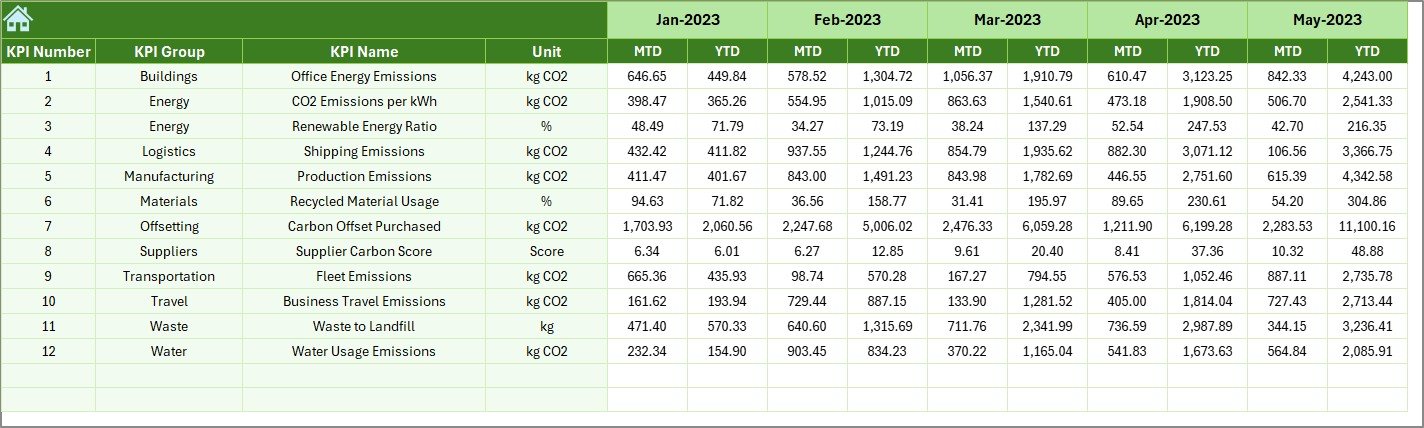
Track MTD & YTD: Monitor Month-to-Date (MTD) and Year-to-Date (YTD) performance to evaluate emissions reductions over time.
-
Target vs. Actual Comparison: Measure actual carbon footprint against predefined targets to assess whether your organization is meeting sustainability goals.
Benefits of Using the Carbon Footprint KPI Dashboard in Excel
✅ Informed Decision-Making
Real-time access to emissions data allows for quick and informed decisions on how to reduce your environmental impact and improve sustainability practices.
✅ Improved Sustainability
Identify areas where emissions are high, such as energy usage or transportation, and take corrective actions to reduce your carbon footprint.
✅ Regulatory Compliance
Ensure your organization is meeting environmental regulations and sustainability standards by continuously monitoring and reporting carbon emissions.
✅ Promote Accountability
With clear KPI tracking, your team can be held accountable for meeting sustainability goals, ensuring a commitment to reducing carbon emissions across the organization.
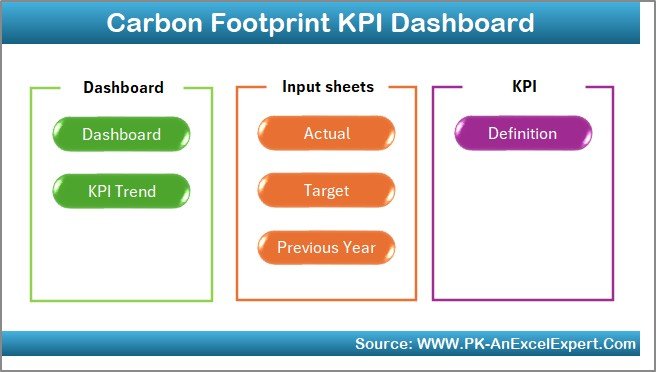
Getting Started with Your Carbon Footprint KPI Dashboard in Excel
-
Download the Template: Get started by downloading the Carbon Footprint KPI Dashboard template, which is ready to be customized for your needs.
-
Set Your KPIs: Define which carbon footprint KPIs align with your sustainability goals and input the relevant data.
-
Import Data: Update the dashboard with real-time emissions data from your energy use, production processes, and logistics systems.
-
Monitor & Analyze: Use the dashboard to track your progress, analyze trends, and identify areas for emissions reduction.
-
Share Insights: Distribute the dashboard to key stakeholders for transparency, collaboration, and informed decision-making.
By utilizing the Carbon Footprint KPI Dashboard in Excel, your organization can enhance sustainability efforts, reduce carbon emissions, and achieve its climate-related goals.
Click here to read the Detailed blog post
Carbon Footprint KPI Dashboard in Excel
Visit our YouTube channel to learn step-by-step video tutorials
YouTube.com/@PKAnExcelExpert
Watch the step-by-step video Demo:
Short Description:
Track and reduce your organization’s carbon emissions with the Carbon Footprint KPI Dashboard in Excel. Monitor key metrics, visualize performance trends, and make data-driven decisions to optimize your carbon footprint management.
-
Comprehensive KPI Tracking: Track all carbon-related metrics in one place.
-
Data-Driven Insights: Visualize trends and identify areas for improvement.
-
Customizable & User-Friendly: Tailor the dashboard to suit your needs and easily input data.


Reviews
There are no reviews yet.