Managing an art gallery isn’t just about the beauty on the walls—it’s about strategy, performance, and engagement. 🎯 The Art Gallery KPI Dashboard in Power BI is the ultimate solution for gallery managers, curators, and arts administrators who want a smarter, visual, and interactive way to track their success.
Designed to work seamlessly with structured Excel inputs, this ready-to-use Power BI dashboard transforms raw data into beautiful visual insights. Whether you’re tracking visitor trends, exhibit performance, marketing effectiveness, or financial goals, this dashboard delivers it all—instantly and intuitively. 🎨📊
🔑 Key Features of Art Gallery KPI Dashboard
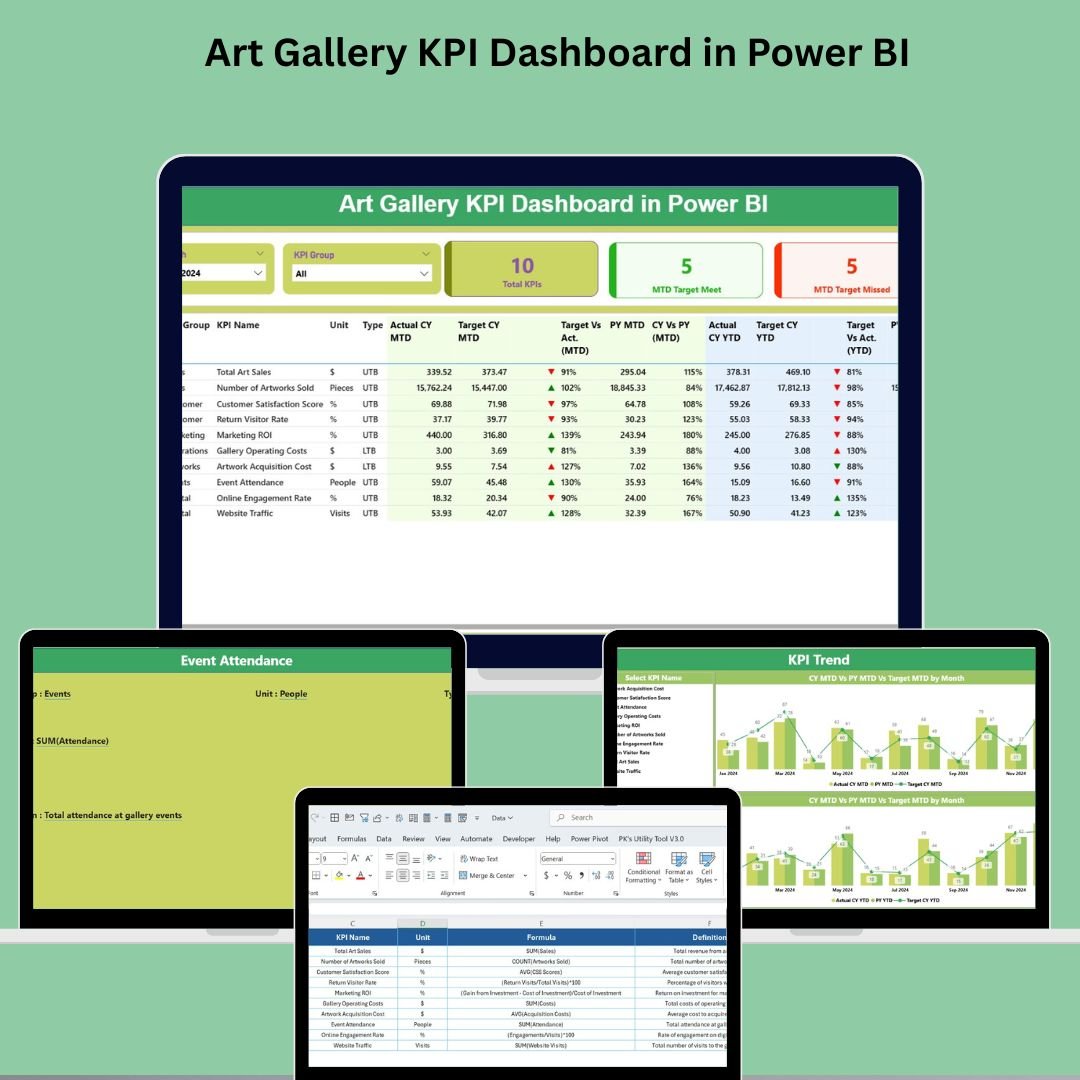
✅ Visual Performance Cards

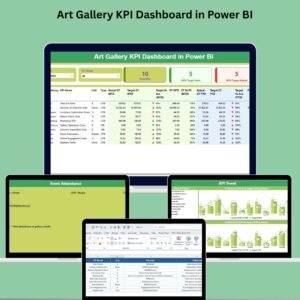
Quickly view Total KPIs, MTD Target Met, and MTD Target Missed using dynamic KPI cards.
✅ Dynamic Slicers
Filter by Month or KPI Group (e.g., Visitors, Engagement, Revenue) for focused insights.
✅ Interactive KPI Table
Track each KPI’s performance with actuals, targets, CY vs PY percentages, and intuitive color-coded arrows (🔺Green for good, 🔻Red for underperformance).
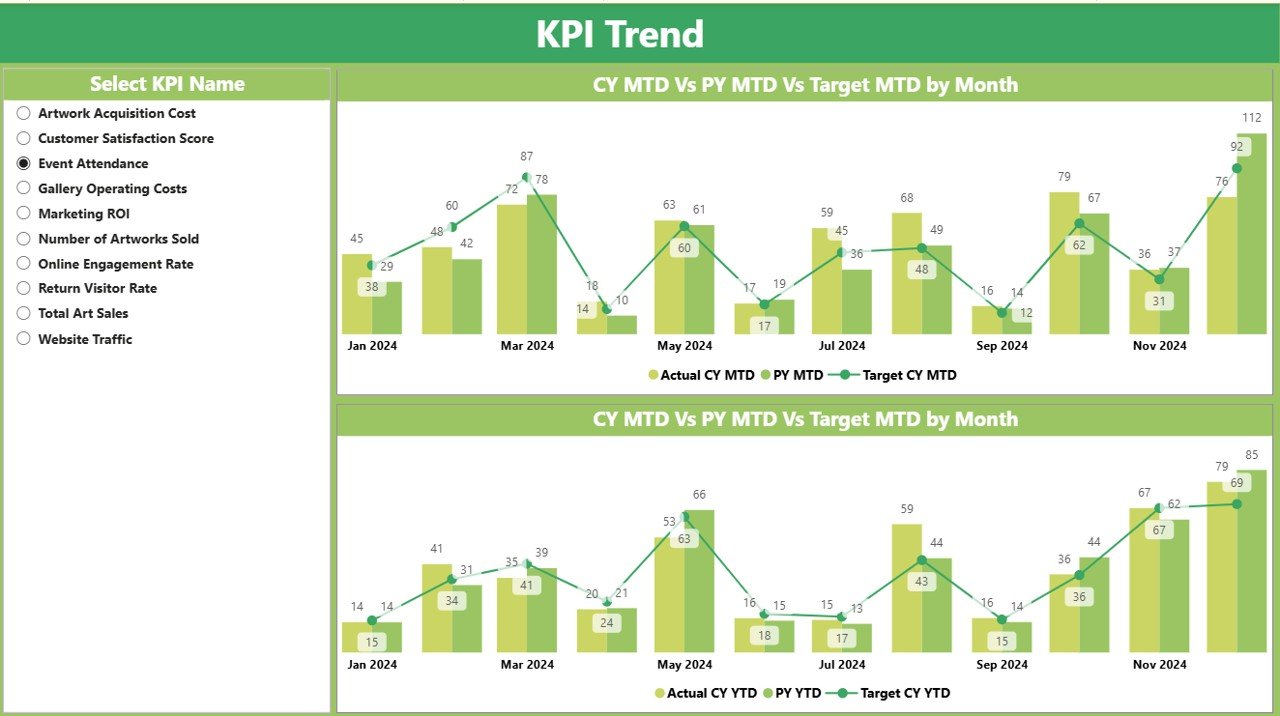
✅ Trend Visualization
Spot patterns, growth, and seasonal dips with side-by-side CY, PY, and Target trends in line and combo charts.
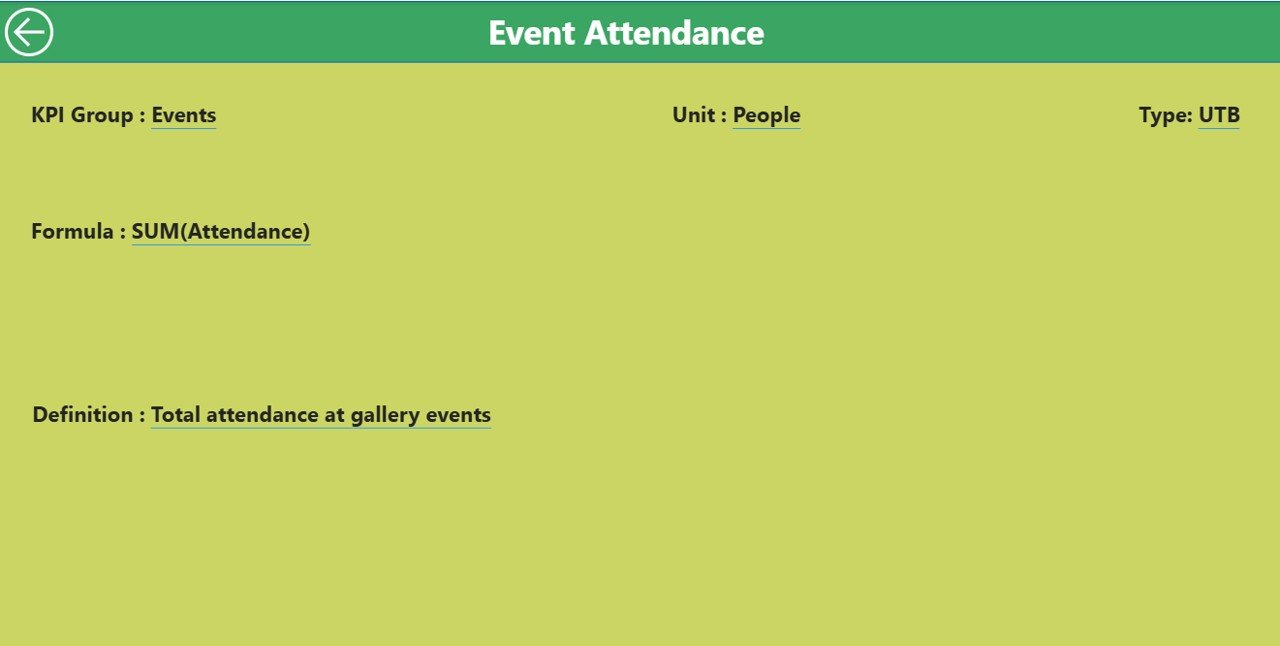
✅ Drillthrough Functionality
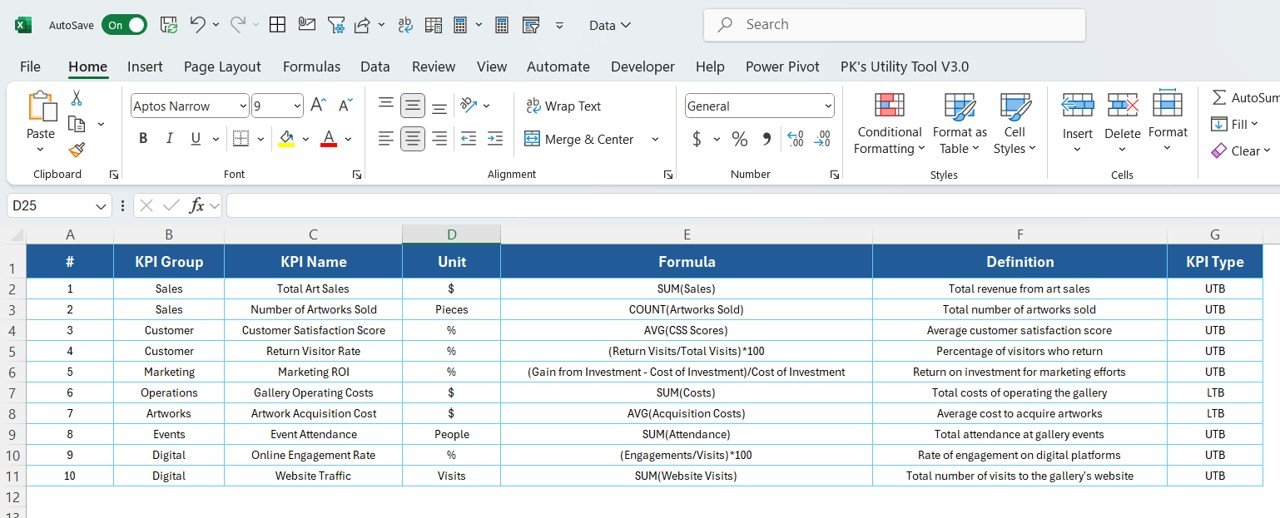
Click any KPI to explore its definition, formula, and measurement logic—right within Power BI.
✅ Excel-Powered Simplicity
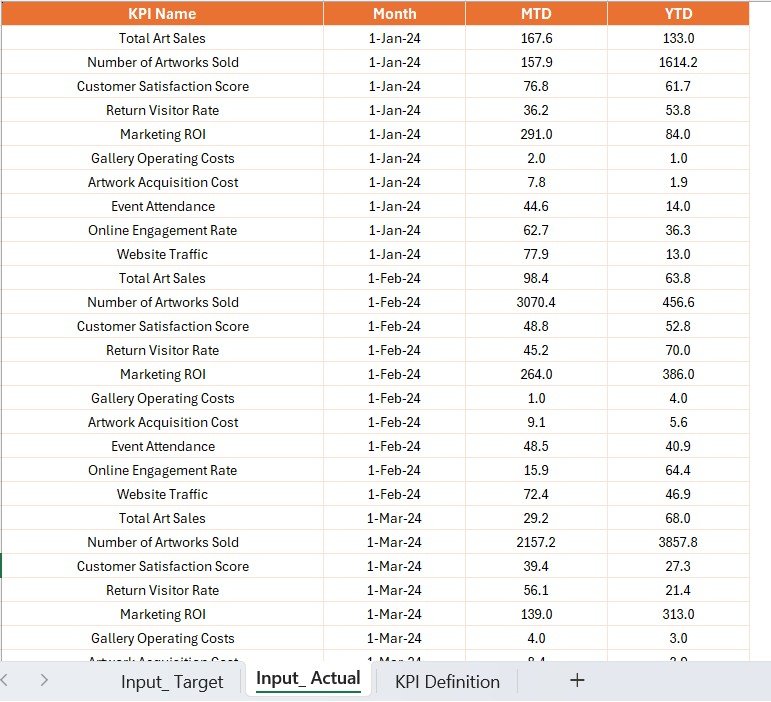
No database or coding required. Update three Excel sheets, and the dashboard reflects everything instantly.
📦 What’s Inside the Art Gallery KPI Dashboard
-
🟢 Power BI Desktop File (.pbix)
-
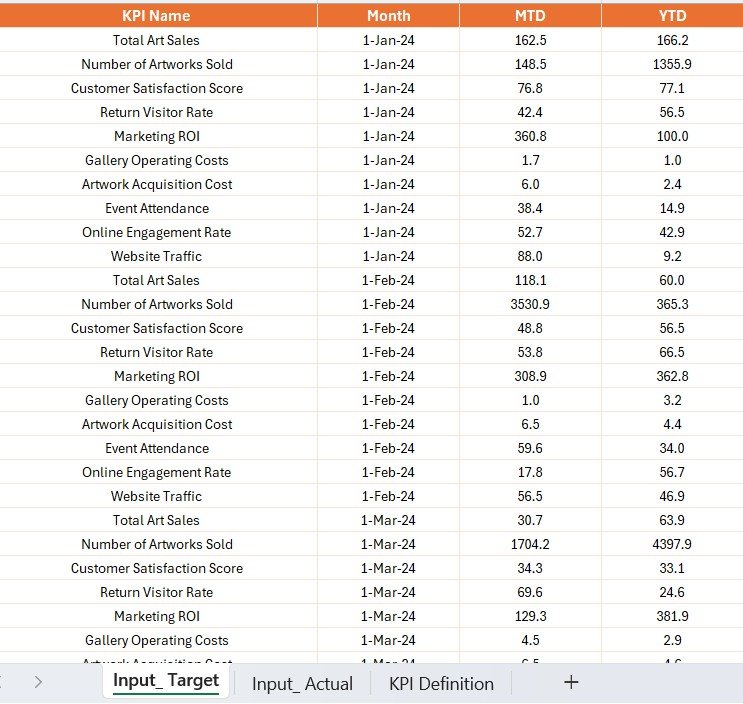
📘 Excel Data File with 3 Structured Sheets:
-
Input_Actual – MTD and YTD actuals
-
Input_Target – MTD and YTD targets
-
KPI Definition – KPI metadata, formula, and measurement logic
-
-
📖 User Guide (Optional)
-
📊 Built-in Drillthrough Page for KPI insight
-
🎛️ 3 Dashboard Pages: Summary, Trend View, and Definition
🛠️ How to Use the Art Gallery KPI Dashboard
1️⃣ Download the Power BI and Excel files
2️⃣ Input Actuals, Targets & Definitions in the Excel file
3️⃣ Open Power BI Desktop, connect to Excel
4️⃣ Refresh the dashboard and see your metrics light up
5️⃣ Use Filters and Slicers for targeted analysis
6️⃣ Drillthrough KPIs for deeper understanding
7️⃣ Publish to Power BI Service to share with your team
💡 Pro Tip: Back up your Excel file before updates to avoid accidental loss of data.
🎯 Who Can Benefit from This Art Gallery KPI Dashboard
-
🖼️ Art Gallery Managers – Monitor performance without relying on IT
-
🎟️ Event & Exhibit Planners – Track attendance, bookings, and engagement
-
📈 Marketing Teams – Analyze outreach, social engagement, and campaign ROI
-
💰 Finance/Donor Relations – Ensure revenue targets and donor accountability
-
🧑🤝🧑 Volunteers & HR Coordinators – Review onboarding, hours, and staff performance
-
🏛️ Museum Directors – Gain holistic operational insights across locations
🔗 Click here to read the Detailed blog post
🎥 Visit our YouTube channel to learn step-by-step video tutorials
(YouTube.com/@PKAnExcelExpert)















Reviews
There are no reviews yet.