Tracking performance across an entire year becomes complex when appraisal data is scattered across multiple files, emails, or static reports. Managers struggle to identify high performers, underperforming areas, and improvement opportunities. As a result, annual reviews often become subjective, slow, and inconsistent.Annual Performance Summary Dashboard in Google Sheets
That is exactly why the Annual Performance Summary Dashboard in Google Sheets becomes an essential performance management and HR analytics tool.Annual Performance Summary Dashboard in Google Sheets
This ready-to-use dashboard converts raw KPI and appraisal data into a structured, visual, and decision-ready reporting system. It allows HR teams, department heads, and leadership to evaluate annual performance using clear ratings, department-wise insights, designation analysis, KPI status evaluation, and month-wise trends—all in one interactive Google Sheets dashboard.
Because it runs entirely in Google Sheets, the dashboard offers real-time updates, smooth collaboration, automatic chart refresh, and cloud-based access—without the cost or complexity of BI tools.Annual Performance Summary Dashboard in Google Sheets
✨ Key Features of the Annual Performance Summary Dashboard in Google Sheets
📊 1. Centralized Annual Performance View
All KPI ratings for the entire year are consolidated into a single dashboard, eliminating the need to review multiple appraisal files.
🏆 2. Rating-Based KPI Cards
Instantly view overall performance health using KPI cards such as Excellent, Good, Poor, and (Average + Poor).
🏢 3. Department & Designation Analysis
Analyze how different departments and roles perform across KPIs and identify strengths and gaps.
👨💼 4. Manager-Wise Performance Insights
Recognize managers who consistently drive high performance and identify areas requiring leadership support.
📅 5. Monthly Performance Trends
Track how performance evolves throughout the year and detect seasonal or workload-driven variations.
📦 What’s Inside the Annual Performance Summary Dashboard in Google Sheets
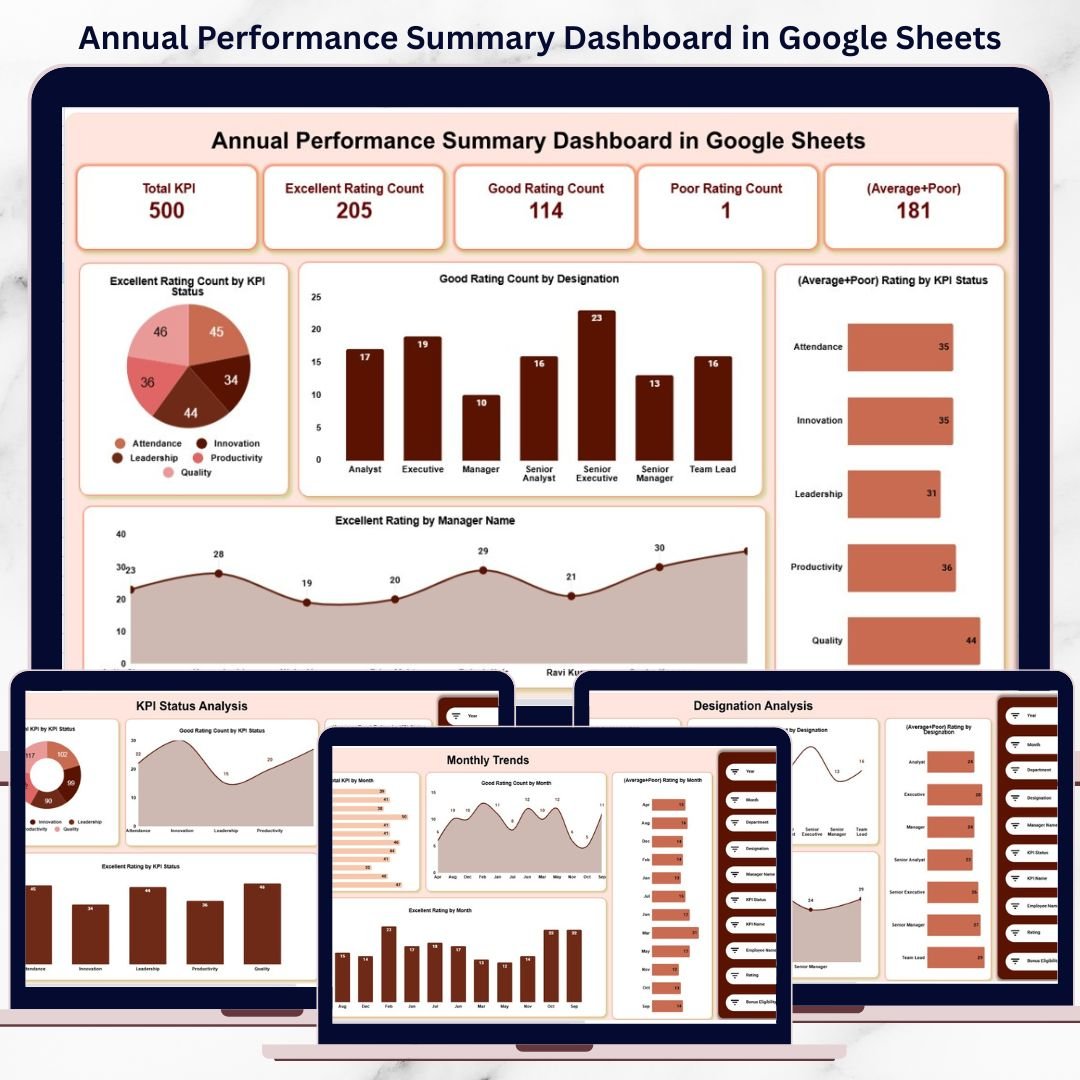
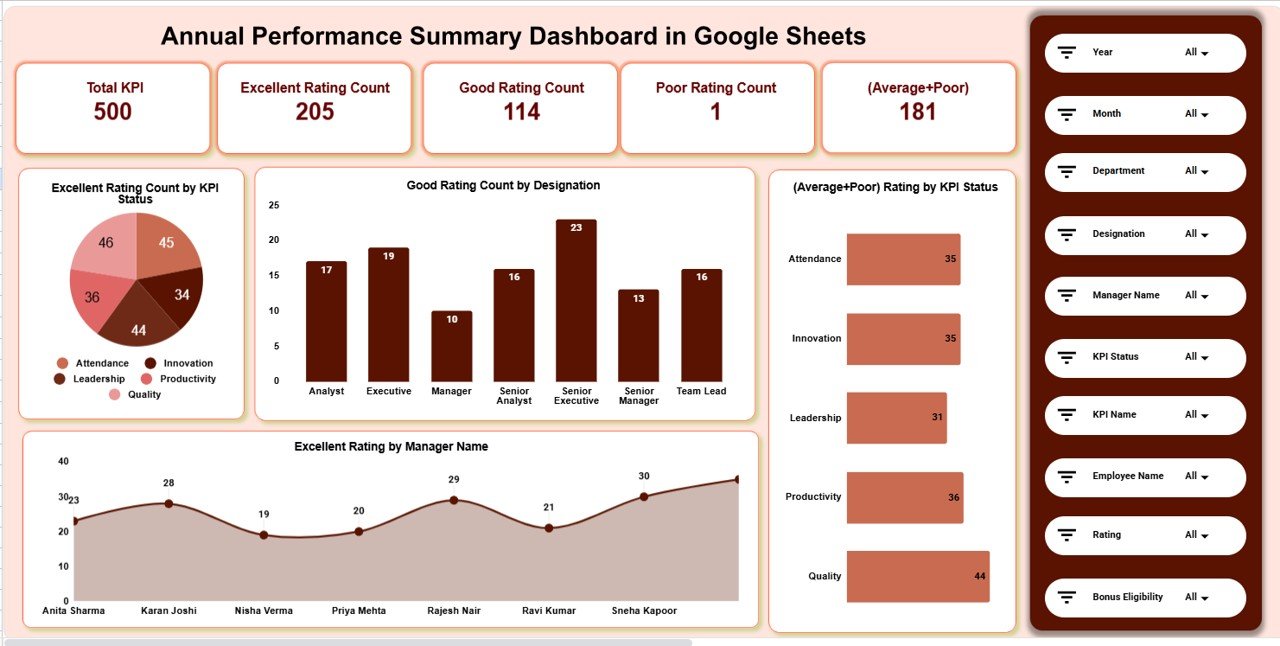
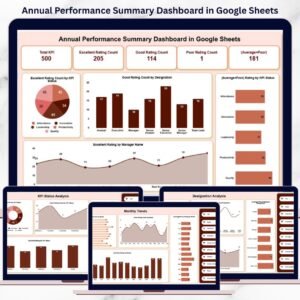
🖥️ Overview Sheet Tab – Performance Snapshot
This is the main dashboard where leadership gets a complete annual overview.
📌 KPI Cards on the Dashboard
-
Total KPI – Total KPIs evaluated during the year
-
Excellent Rating Count – KPIs rated Excellent
-
Good Rating Count – KPIs rated Good
-
Poor Rating Count – KPIs rated Poor
-
(Average + Poor) – Combined count highlighting improvement areas
These cards allow quick, high-level assessment of organizational performance.
📈 Charts in the Overview Section
Excellent Rating Count by KPI Status
Shows which KPI categories consistently achieve top ratings.
Good Rating Count by Designation
Highlights roles that perform steadily well.
(Average + Poor) Rating by KPI Status
Identifies underperforming KPI groups that need attention.
Excellent Rating by Manager Name
Helps recognize managers who drive strong performance outcomes.
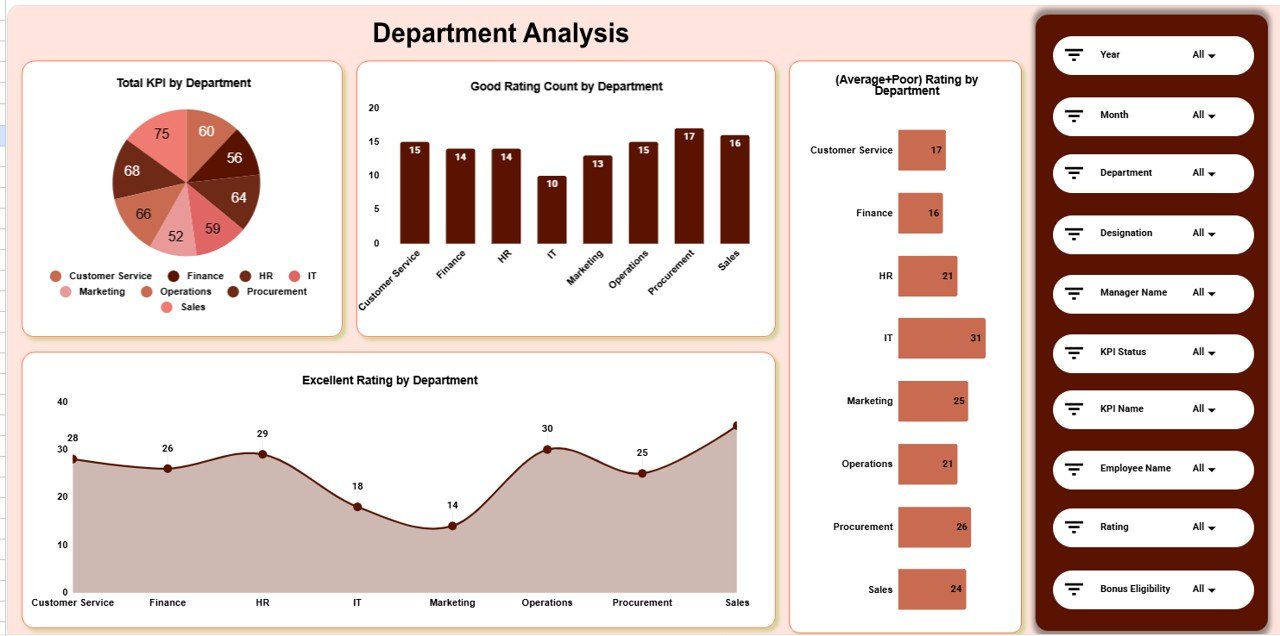
🏢 Department Analysis Section
This section evaluates performance distribution across departments using multiple visuals:
-
Total KPI by Department
-
Good Rating Count by Department
-
(Average + Poor) Rating by Department
-
Excellent Rating by Department
HR teams can easily spot high-performing departments and those needing improvement.
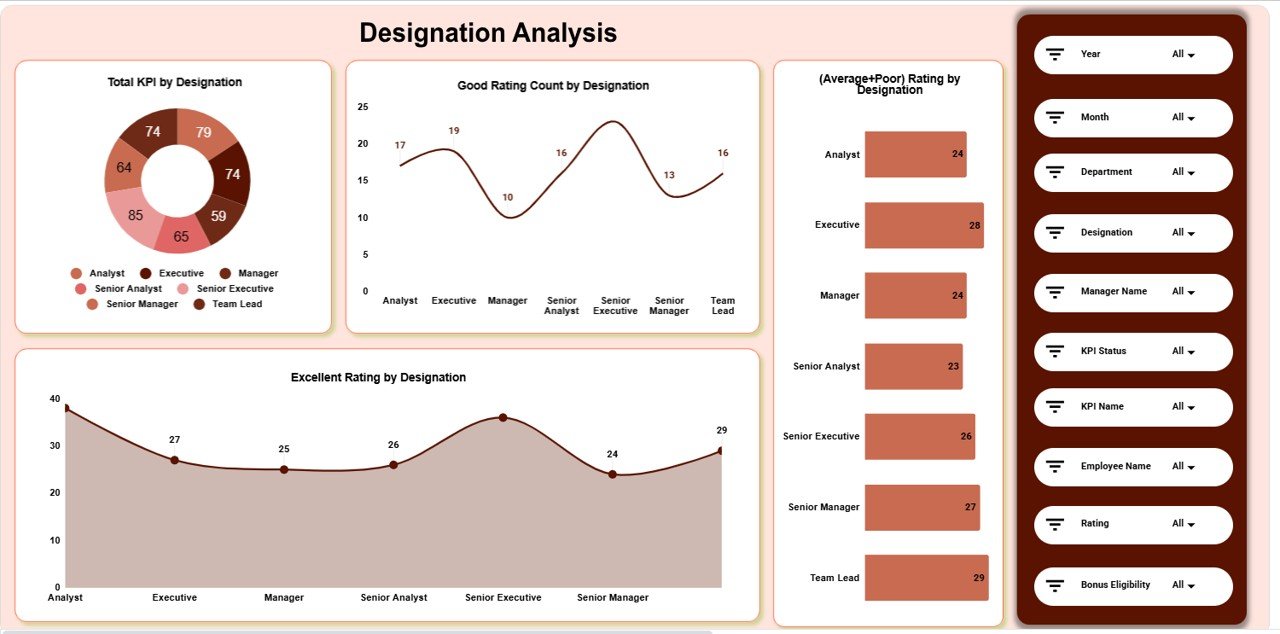
🧑💼 Designation Analysis Section
This section focuses on role-based performance evaluation:
-
Total KPI by Designation
-
Good Rating Count by Designation
-
(Average + Poor) Rating by Designation
-
Excellent Rating by Designation
It supports role-based training, promotions, and workforce planning.
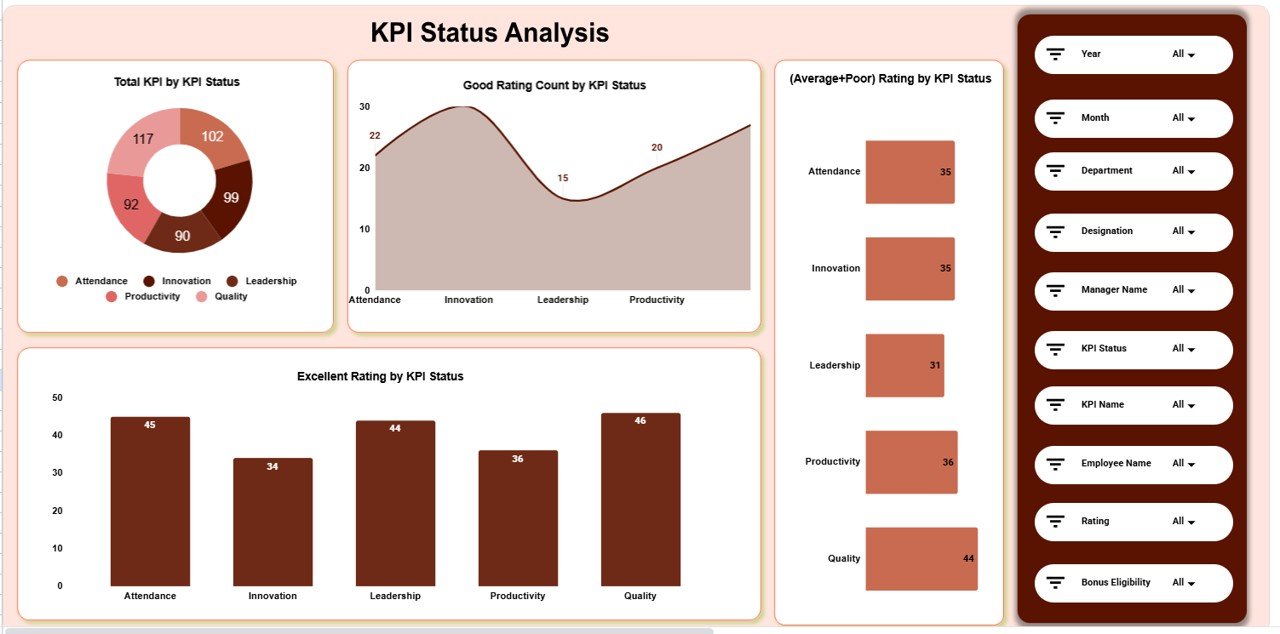
📌 KPI Status Analysis Section
This section analyzes performance based on KPI status:
-
Total KPI by KPI Status
-
Good Rating Count by KPI Status
-
(Average + Poor) Rating by KPI Status
-
Excellent Rating by KPI Status
It helps organizations understand which KPIs consistently succeed or fail.
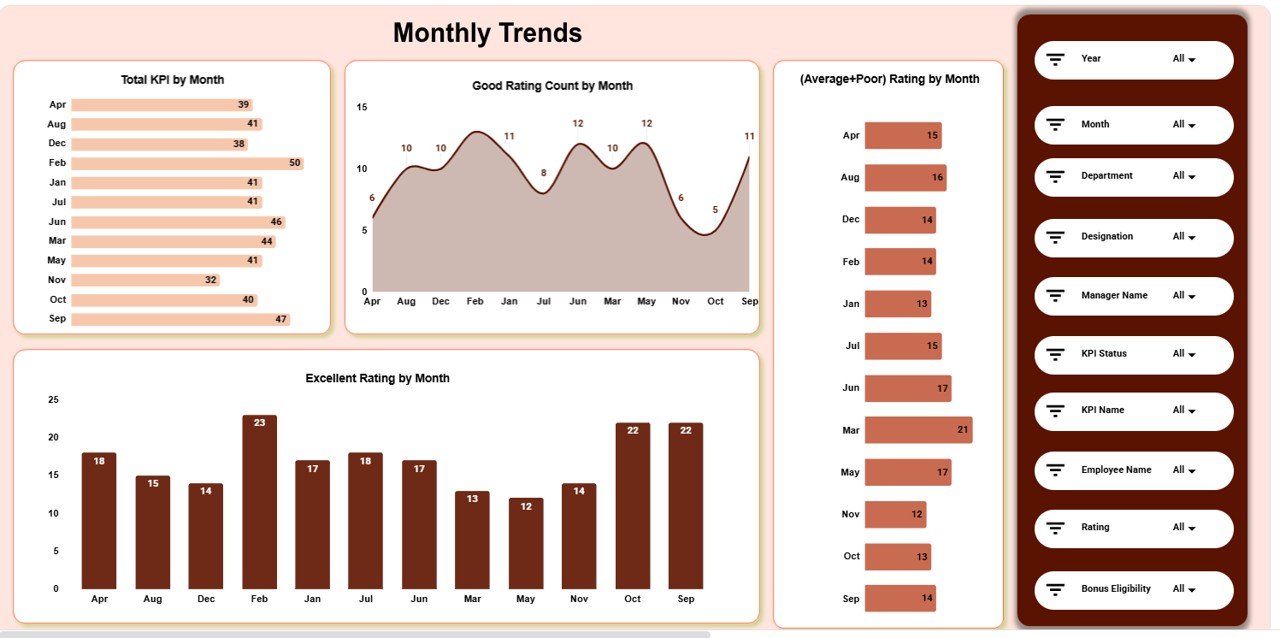
📅 Monthly Trends Analysis Section
Track performance evolution across the year using:
-
Total KPI by Month
-
Good Rating Count by Month
-
(Average + Poor) Rating by Month
-
Excellent Rating by Month
This helps identify seasonal patterns and workload impact on performance.
📄 Data Input Sheet Tab – Backend Data Source
The Data Input sheet drives the entire dashboard. Typical columns include:
-
KPI Name
-
KPI Status
-
Department
-
Designation
-
Manager Name
-
Rating
-
Month
Once data is entered or updated, all dashboard cards and charts refresh automatically.
🎯 Who Can Benefit from This Annual Performance Summary Dashboard
👥 HR Teams
Standardize performance evaluation and reduce bias.
🏢 Department Heads
Understand team strengths and improvement areas.
👔 Managers
Track KPI outcomes and support team development.
📊 Leadership Teams
Make data-driven promotion, reward, and planning decisions.
🚀 Growing Organizations
Maintain transparency and consistency as teams scale.
### Click here to read the Detailed blog post
Watch the step-by-step video tutorial:


Reviews
There are no reviews yet.