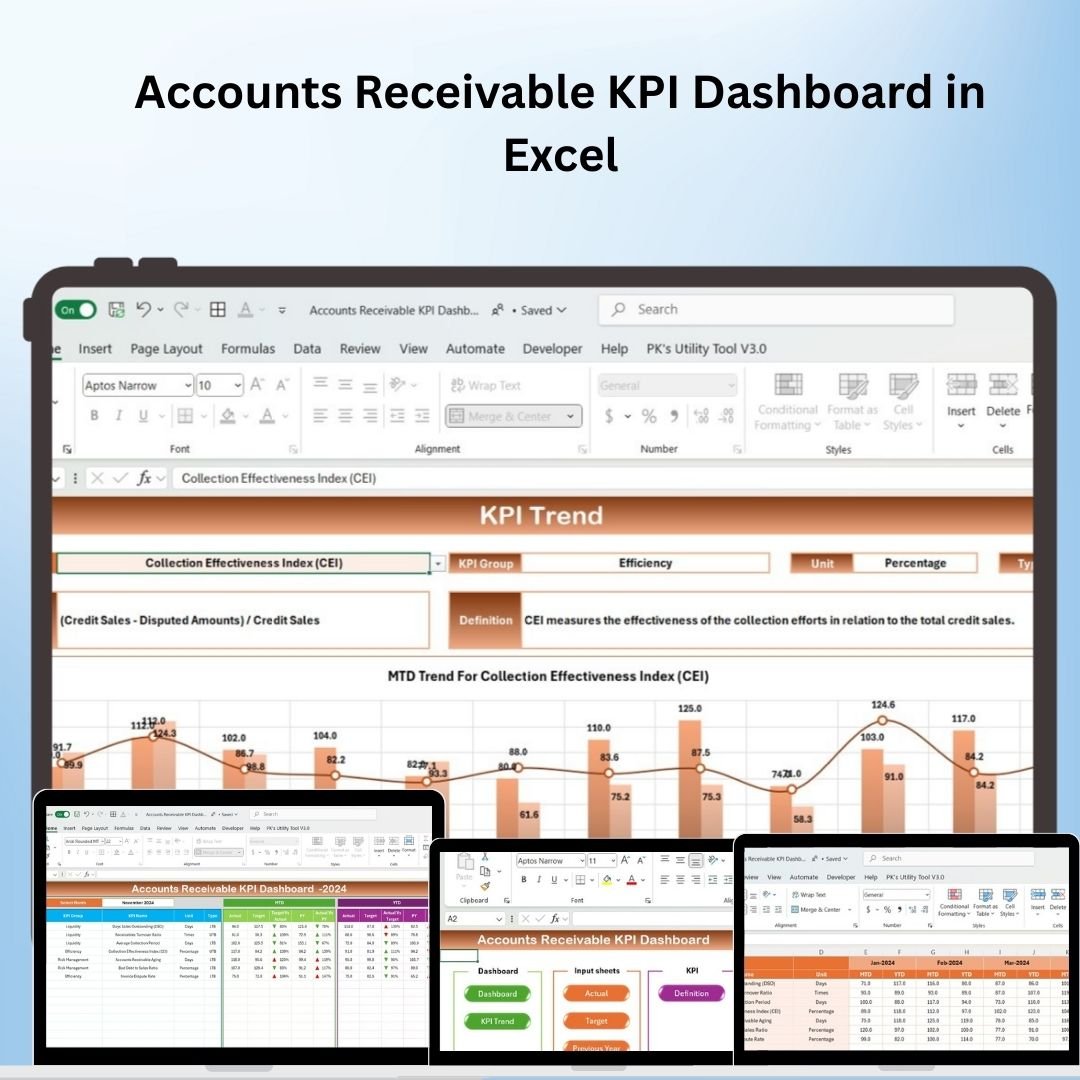


The Accounts Receivable KPI Dashboard in Excel is a robust tool designed to help businesses monitor and manage their accounts receivable efficiently. This dynamic dashboard enables you to track key performance indicators (KPIs) such as outstanding invoices, aging accounts, and payment collection rates, allowing you to stay on top of your cash flow and ensure timely payments from clients.
With its interactive design and real-time data updates, this dashboard offers a comprehensive overview of your accounts receivable performance. Whether you’re managing a small business or overseeing a large team, the Accounts Receivable KPI Dashboard in Excel helps you quickly identify overdue payments, analyze collection efforts, and track your financial health.
Key Features of the Accounts Receivable KPI Dashboard in Excel
📌 Comprehensive Accounts Receivable Metrics
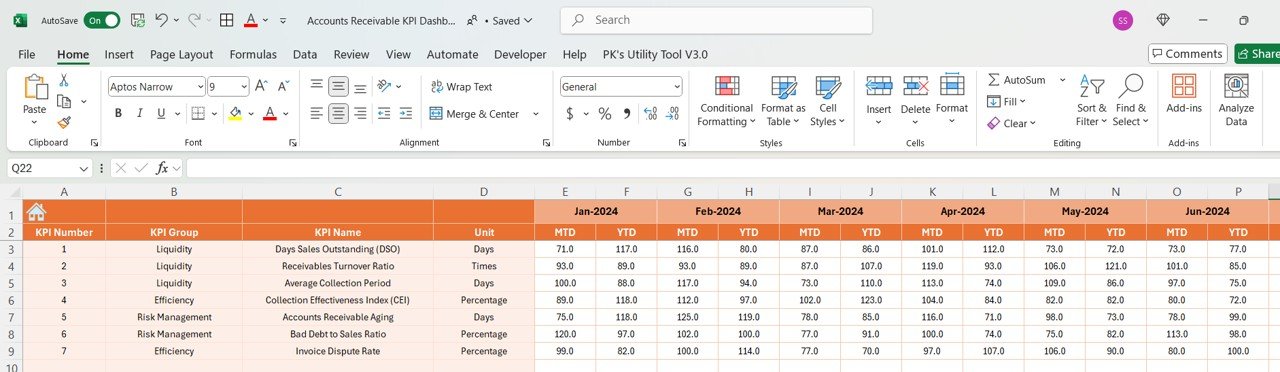
The dashboard tracks a variety of KPIs such as total outstanding balances, overdue accounts, aging analysis, collection efficiency, and days sales outstanding (DSO). These metrics help you understand how well your business is managing its accounts receivable.
🛠 Interactive Data Visualizations
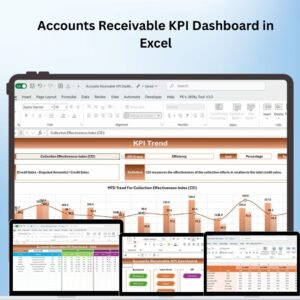
With dynamic charts and graphs, the dashboard provides clear visual insights into your accounts receivable data. Interactive filters allow you to drill down into specific time periods, customers, or account types to get a detailed view of your receivables.
💡 Real-Time Data Updates
As you enter or update new data, the dashboard automatically refreshes to show the latest information. This ensures that you always have up-to-date insights into the status of your accounts receivable.
🔢 Accounts Receivable Aging Analysis
The dashboard includes a detailed aging analysis, breaking down outstanding accounts by their age (e.g., 0-30 days, 31-60 days, etc.). This feature helps you identify overdue accounts and prioritize collection efforts.
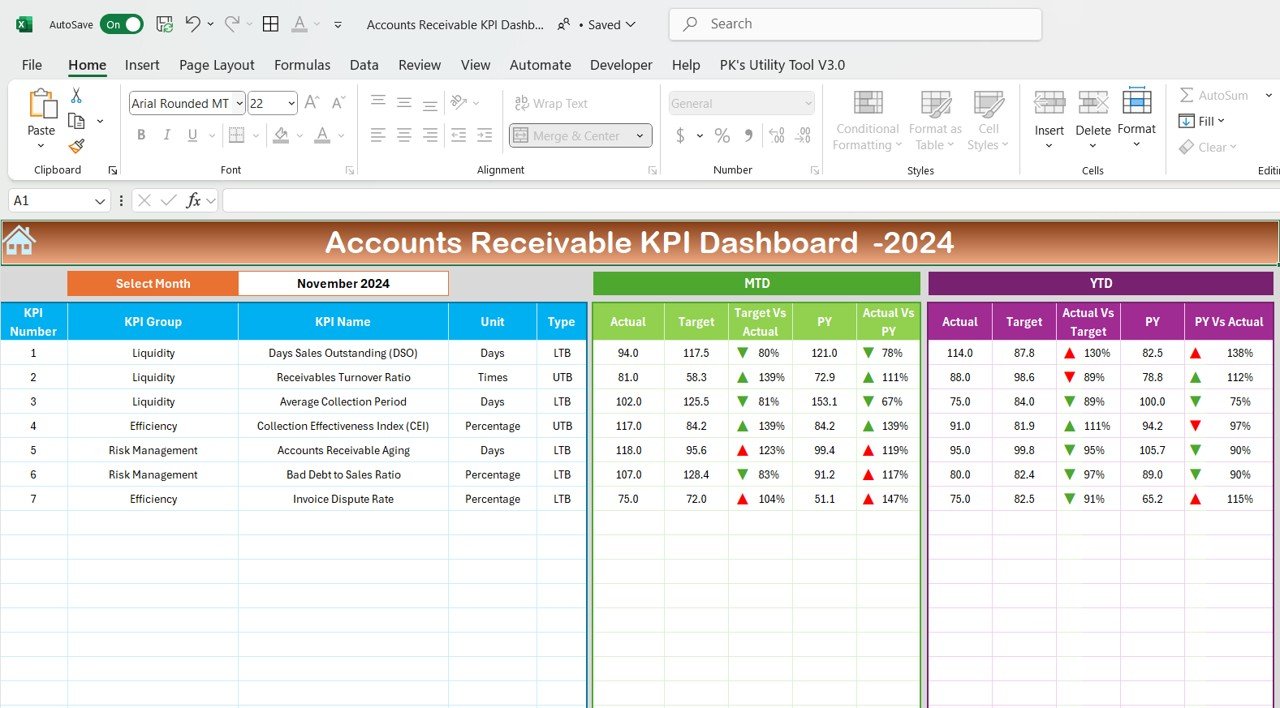
🚀 Clear and Visual Data Representation
The dashboard uses color-coded visuals, such as bar charts, pie charts, and progress indicators, to represent key data points. This makes it easy to spot trends, measure performance, and identify areas that require attention.
📊 Cash Flow Monitoring
Track your accounts receivable turnover, monitor cash flow trends, and analyze collection efficiency. This helps you maintain a healthy financial position by ensuring that outstanding balances are collected on time.
⚙ Easy Setup and Customization
The Accounts Receivable KPI Dashboard is simple to set up and highly customizable. With clear instructions and the ability to modify key metrics and visuals, you can tailor the dashboard to meet your specific business needs.
🚀 Why You’ll Love the Accounts Receivable KPI Dashboard in Excel
✅ Comprehensive KPI Tracking – Monitor critical accounts receivable metrics to ensure timely collections. ✅ Interactive Data Visualizations – Use dynamic charts to drill down into your data and gain valuable insights. ✅ Real-Time Data Updates – The dashboard refreshes automatically as you update your accounts receivable data. ✅ Aging Analysis – Track overdue accounts and prioritize collection efforts with the aging analysis feature. ✅ Clear and Visual Design – Spot trends and measure performance with color-coded visuals and charts. ✅ Simple Setup – Get started quickly with clear, easy-to-follow instructions.
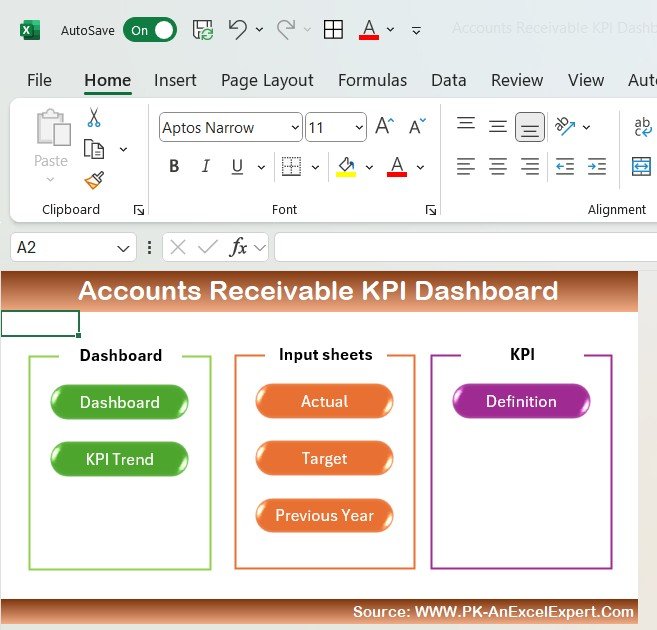
📂 What’s Inside the Accounts Receivable KPI Dashboard in Excel?
- Comprehensive KPI Dashboard: Track and visualize key performance metrics related to accounts receivable.
- Interactive Data Visualizations: Charts, graphs, and tables that update in real-time as data is entered.
- Aging Analysis: Track overdue accounts and aging categories to prioritize collection.
- Cash Flow Monitoring: Monitor accounts receivable turnover and financial health.
- Clear Setup Instructions: Simple, easy-to-follow steps for customization and setup.
🔍 How to Use the Accounts Receivable KPI Dashboard in Excel
1️⃣ Download the Template – Instant access to the Excel file upon purchase. 2️⃣ Input Your Accounts Receivable Data – Enter client names, amounts, and due dates. 3️⃣ Customize the Dashboard – Adjust metrics, aging categories, and visualizations to fit your business needs. 4️⃣ Track and Monitor – Use the dashboard to track overdue accounts, collection performance, and cash flow. 5️⃣ Present and Share – Use the dashboard in meetings, reports, or presentations to showcase your financial data.
🎯 Who Can Benefit from the Accounts Receivable KPI Dashboard in Excel? 🔹 Financial Managers
🔹 CFOs and Accounting Teams
🔹 Business Owners
🔹 Credit and Collections Teams
🔹 Anyone managing accounts receivable and cash flow
Stay on top of your accounts receivable with the Accounts Receivable KPI Dashboard in Excel. This dynamic, real-time tool helps you monitor overdue accounts, improve collection efforts, and maintain strong cash flow.
Click here to read the Detailed blog post
https://www.pk-anexcelexpert.com/accounts-receivable-kpi-dashboard-in-excel/
Visit our YouTube channel to learn step-by-step video tutorials


Reviews
There are no reviews yet.